vol. 14 no. 2, June, 2009
vol. 14 no. 2, June, 2009 | ||||
The overall purpose of this study was to develop a comprehensive bibliometric mapping of a Swedish administrative, cultural and political region's research efforts, as mirrored by publications included in the Science Citation Index Expanded (SCIE). Bibliometric methods may be applied for the mapping of different aspects of science and technology systems and contribute to informed research political decisions and management of research. The value of analysing scholarly productivity and citations at various levels of aggregation (nations, regions, institutions, departments or individual research groups) is well recognized. Peer review represents the standard approach by which science is evaluated and is increasingly complemented by bibliometric evaluation. One reason for this is the rapid growth of research publications and another is the increasing specialization of research, which makes it difficult for experts to fully comprehend the dynamics of current research. As well as the various levels of aggregation, there are also various reasons for evaluation. Generally, there is the need for optimizing the use of limited resources and accordingly, a need for the mapping of fields that are expected to expand or contract due to the allocation or re-allocation of resources. Seen in the context of national research management, bibliometric indicators may provide information about weaknesses or strengths on a comparative basis. Such bibliometric assessments could, for instance, map and compare the development of publication activity and citation impact for countries within a certain geo-economical area. An example of this is given in Glänzel (2000), where publication profiles of Scandinavian countries were derived along with an examination of the relation between profiles and international co-authorship.
In other cases certain aspects or domains of the national science and technology system are studied. In Sandström et al (2000) parts of the Swedish biotechnology innovation system were examined with the focus on knowledge production and knowledge flows between different public research organisations, and between business enterprises and public research organisations, along with the identification of dominant institutions and collaborative clusters. In Glänzel et al. (2003), an observed decline in the citation impact of Swedish neuroscience was elaborated at different levels of aggregation. National citation data were broken down to the institutional, departmental and individual level and the study also facilitated a better understanding of how research political investments may affect subsequent measures of citation impact. In a study by Bondemark and Lilja-Karlander (2004), the focus was also on a specific national research field and the objective was to map the production and publication pattern of Swedish orthodontic articles and to classify these with regard to study designs and topics. When applying a national perspective, the focus may also be on a certain national sector such as business enterprise, higher education or government. In Kyvik (2003) the higher education sector was studied on the basis of surveys of the published output among university staff in Norway. Changes in publication patterns over a twenty-year period were monitored and aspects of research collaboration, publication types and publication languages were examined.
Though most bibliometric evaluations pertain to national or higher aggregation levels, there is a need for a regional (sub-national) level of analysis. Generally, one would consider the importance of geographical proximity and interactive environments: '...the ideas of regionally concentrated skills or physical infrastructures are behind many measurements and explanations of high growth rates' (Tsipouri 1999). There are also theories that suggest that global competition more and more concerns the competition between city-regions rather than between countries (cf. Florida 2005; Hansen et al. 2005). Consequently, questions relating to the evolution and development of regional science and technology systems are highly relevant for regional as well as national planning, in particular with regard to less prosperous regions where policy makers need to intervene (cf. Tsipouri 1999). Therefore, other bibliometric evaluations may focus on the national science and technology system from a regional perspective, analysing administrative regions rather than nations.
In Tuzi (2005), the specialization patterns of Italian regions were studied by examining regional scientific profiles across research fields and providing with impact analyses of different Italian regions. In Altvater-Mackensen et al. (2005), the main objective was to gain an understanding of the influence of technology and science fields and publishing institutions in different German regions. In their study, demographic and economical variables were applied in combination with bibliometric indicators in order to measure science and technology intensity and the interrelation between science and technology.
Finally, analysis of research collaboration assumes an ever growing importance and co-authorship analyses are important tools for the mapping of such scientific collaboration and globalisation. On the basis of an analysis of UK scientific output, (Hicks and Katz1996) concluded that increases in collaboration suggest that more resources are needed in the production and advancement of knowledge within the sciences. Increased collaboration between individuals is transforming research systems into highly collaborative ones and this implies that more competence would be required when administering future research. Though increased globalisation and collaboration may be beneficial in terms of increased research activity, productivity and impact, these benefits can not be expected necessarily, and bibliometric monitoring would be a necessity in order to comprehend possible collaboration gains (Glänzel and Schubert 2004: 274).
The purpose of this study was to derive a comprehensive regional research profile from publication and citation data and to map and visualize the regional publication structure as well as patterns of research collaboration. In this context, the concept of visibility was understood as a compound one, with constituents being published articles and received citations.
The research objectives of the study were to:
The scope is limited to the study of the regional science and technology system as mirrored by journal articles included in the Science Citation Index Expanded (SCIE). The social sciences and the humanities are not included; thus the regional scholarly communication system as a whole is not studied.
The Institute for Scientific Information (ISI) citation databases have since long been the major means for bibliometric evaluation studies, providing comprehensive coverage of the central literature in a wide range scientific disciplines. However, some of their limitations must be taken into account when interpreting findings. More peripheral journals with a narrow focus aiming at the dissemination of information within smaller specialties, often with a national scope and thereby including non-English journals, may not be included in the database (cf. Moed et al. 1995) and the risk of under-assessment of the impact of research in the periphery and not-yet established fields as well as non-English publications has been verified in other studies (Marx et al. 2001).
Placing restrictions on source data so that only published research of the journal type is included may be motivated by the fact that scientific journals are peer-reviewed and that 'genuine' articles are likely to present genuine contributions to knowledge. However, the contribution of conference proceedings, monographs or contributions to compilations may be significant for some fields (Moed et al. 1995). In spite of this, most scientists, particularly in the natural sciences and medical fields, try to publish in the more prestigious international journals and experience confirms a similar development for engineering sciences and the social and behavioural sciences (van Raan 2004: 26).
With regard to journal coverage, it is worth emphasising that the SCIE was applied in this study. The difference between the SCI and the SCIE in terms of coverage is notable: 3,700 journals versus 6,550 (Thomson Reuter 2009). Various biases and the risk of under-assessment of smaller fields should still be considered. We conclude that for a more exhaustive evaluation of the region's article production and citation impact, an assessment of the ISI coverage of the total regional science and technology publication output would also be required. This would be particularly relevant for analyses on lower aggregations of data, e.g. the evaluation of research groups or departments (cf. Moed 2002).
The basic methodology concerning research evaluation on the national level was laid out in Schubert and Braun (1986), Schubert et al. (1988; 1989). Their methodology and the methods presented by the Centre for Science and Technology Studies (CWTS) in the Third European Report on S&T indicators (European Commission 2003) have served as guidance when adapting the study to a sub-national level. A similar approach was applied in Tuzi (2005) where the scientific specialization of Italian regions was studied.
All bibliographic records in the Science Citation Index Expanded of the document type article with a Swedish address published during the period of 1998-2006 were downloaded in May 2007 from the Web of Science. Some cleansing of the resulting data file was necessary as a few records lacked complete bibliographic information or were considered duplicates. The size of the file was further reduced by filtering out records from the social sciences and the humanities. This resulted in a set of 131,544 records. On the basis of a listing of names of population centres derived from the regional authorities' sources, geographical sources and Swedish Statistics, the address fields in the bibliographic records of the final set were searched for regional addresses. Through an iterative process, spelling variants and additional addresses were identified and variants unified.
A specific problem was the merging of author addresses. This particularly concerned large university hospitals and their associated universities, e.g., 'Gothenburg Univ, Sahlgrens Hosp'. In such cases, if no other method was available, the first institution was chosen. Due to political and administrative changes over time, institutions were sometimes incorporated under a more current institutional name. A total of 24,823 records made up a final set of regionally-authored articles. On grounds of the longitudinal character of this study, an expanding journal set was applied in order to avoid under-representation of specialties emerging at the outset of the observation period (cf.. National Science Foundation 2007). Annual observation periods were applied when assessing trends over the full period, otherwise, the whole period (1998-2006) or three consecutive periods, 1998-2000, 2001-2003 and 2004-2006, were used.
For the classification of articles, the hierarchical classification system of the Centre for Science and Technology Studies was applied (European Commission, 2003). In the Centre's classification system, sub-fields largely correspond to the journal subject categories assigned to journals covered by Institute for Scientific Information. Each sub-field is assigned to one discipline and each discipline to one broad field. In this study, the discipline level was excluded; hence a two-level hierarchical classification scheme was applied in practice. Some minor adjustments of the classification scheme were deemed appropriate as the scheme, for obvious reasons, is not consistent over time. A few sub-fields were excluded, (e.g., Nursing) as they were not considered to have their main focus in the sciences but rather in the social sciences, and a few were added (e.g., Agronomy). The Centre's classification system originally comprised twelve broad fields, but here, eleven broad fields were applied as articles belonging to the twelfth field (12 Multidisciplinary) were re-classified (see the following subsection) and assigned to one or more of the other eleven broad fields. The classification scheme applied for the classification of sub-fields into broad fields is presented in the Appendix.
All multidisciplinary sources (e.g., Proceedings of the National Academy of Sciences of the United States, Nature and Science) were gathered in one file. Next, all cited journal-references were separated and each referenced unique journal title name was fitted to one or more of the ISI journal subject categories. In those instances where the title could not be found, sufficient information concerning the scope of the journal was mostly found in journal homepages or in indexing sources. Referenced journal names that were assigned to more than two subject categories were excluded so that only the more narrowly focused referenced journals would give rise to new subject categories (cf. Glänzel et al. 1999). This way, a classification file with unique multidisciplinary source names and their corresponding journal subject categories was compiled, referenced multidisciplinary sources excluded. In this process, some additional articles included in the SCIE, but pertaining to the social sciences or the humanities where identified and removed. The final classification file was then used to classify all science articles published in multidisciplinary journals.
As articles frequently have more than one corporate address, the method of counting addresses must be decided on. There are basically three standard counting methods:
In whole counting, all unique countries, institutions or authors receive one credit, while in fractional counting, one credit (corresponding to one publication) is equally divided up amongst unique contributing countries, institutions or authors (Gauffriau et al. 2007). Fractional counting implies a difficulty as there is no clear correspondence between authors and corporate addresses. Also, there is no fair method to determine the effort made by each institution or nation, and the dividing up of an article between authors and institutions would be arbitrary (European Commission 2003).
Furthermore, empirical experiences have shown that at the macro level, all three methods may yield satisfactory results, but at lower levels of aggregation, the whole counting scheme is the more appropriate (Glänzel 1996). Therefore, the publication frequency of an institution was counted as the number of articles in which its standardised name occurred. With regard to the ISI journal classification system, a large share of indexed journals is assigned to multiple categories; sometimes scientific journals have a rather wide scope in which case the category labelling of journals also transcend the borders between broad fields. In such cases, a multiple count was applied. Citation counts were produced in accordance with article counts, applying full and multiple counting schemes. Hence, the citations received by an article were counted in full in each instance the article was counted.
The evenness of distributions was of interest when comparing the regional publication pattern with the national. The equality or evenness of the dispersion of articles over fields or institutions was measured by the Gini coefficient. The Gini coefficient is frequently applied in economics, where it has been used for measuring income inequality, but also in various other fields like ecology, biology and also bibliometrics (e.g., Rousseau and Van Hecke 1999; Rousseau 2000). Applying this measure we may consider a scatter of items over sources as items produced (articles) within broad fields or by institutions (sources) and define it as:

where X = (x1, x2,...xN) is the vector of abundances, i.e., denotes the number of items produced by the ith source i =1,...N (Rousseau, 2000). This measure takes on values in the interval [0,1] where 0 indicates perfect equality (perfectly even distribution) and 1 perfect inequality.
Considering the divergence between fields with regard to publication and citation habits, relative citation and publication indicators are necessary, otherwise cross-field comparisons cannot be made. Hence, publication and citation counts need to be matched against appropriate standards. The Activity Index (AI) characterizes the relative research effort a country devotes to a given subject field. Its definition is:

where:
The Relative Specialization Index (RSI) is defined as:
This index takes on values in the range [-1, 1] and RSI = -1 indicates a completely inactive research field and RSI = 1 if the country is active in no other field. RSI < 0 indicates lower than average activity and rsi > 0 a higher than average activity. RSI = 0 corresponds to a perfectly balanced situation and RSI = 0 for all fields to the world standard (Glänzel 2000).
In this study the AI was adjusted to a sub-national level, meaning that the numerator is the region's share in the nation's publication output in the given field and the denominator the region's share in the nation's total publication output in all science fields. Analogous, RSI -values concern regional fields' relative publication activity.
With regard to citation based indicators, the CWTS field-normalised score served as a model (cf. European Commission 2003). The field-normalisation used in this study applies the mean citation frequency of all articles within a regional field or sub-field as the observed value, while the national mean citation frequency of the corresponding field or sub-field is the expected value. We name this indicator the Relative Citation frequency (RCF) and define it as:
where
In line with the transformation of the ai to the rsi, a transformation of the rcf to a relative citation index (rci) is accomplished by:
This index takes on values in the range [-1, 1]. RCI = 1 corresponds to the fictitious case of an infinitive number of citations ((RCF-1)/ (RCF+1) can approach, but never reach 1). RCI = -1 indicates a complete uncitedness. RCI > 0 indicates a higher than average citation rate, whereas RCI < 0 indicates a lower than average citation rate and rci = 0 indicates that the citation rate corresponds to the standard. the rci is an adaptation of the relative citation impact index (cf. Glänzel 2000).
With regard to the period during which the set of articles under study are citable, a variable citation window was applied ranging from 1998 to 2007 (May). This implies that some articles have no chance of being cited at all while others reach through their citation peak (cf. Schubert et al. 1989).
During the observation period 1998-2006, there was a linear growth for both the region and the nation. The average growth of published research for the region was 2,738 articles per year and the corresponding figure for the nation as a whole was 14,715. Hence, the region contributes approximately 19% yearly.
In order to get an appreciation of the trend of regional influence on the national production for each broad field, the annual shares of the cumulated number of national articles were computed. In Figure 1 we can identify the more and the less influential broad fields. At the upper scale we see 11 Clinical Medicine, 1 Engineering Sciences, 2 Physics and Astronomy, 3 Chemistry and 4 Mathematics and Statistics, and below the curve for shares in the national total, the remaining fields are seen with 8 Agriculture and Food Sciences and 9 Basic Life Sciences at the bottom positions. As can be appreciated, the regional influence is quite stable for most fields. A notable dip for 4 Mathematics and Statistics is seen in 2001 which is followed by a clear recovery and a continuous positive trend. Negative trends can be seen for 8 Agriculture and Food Sciences and 2 Physics and Astronomy.
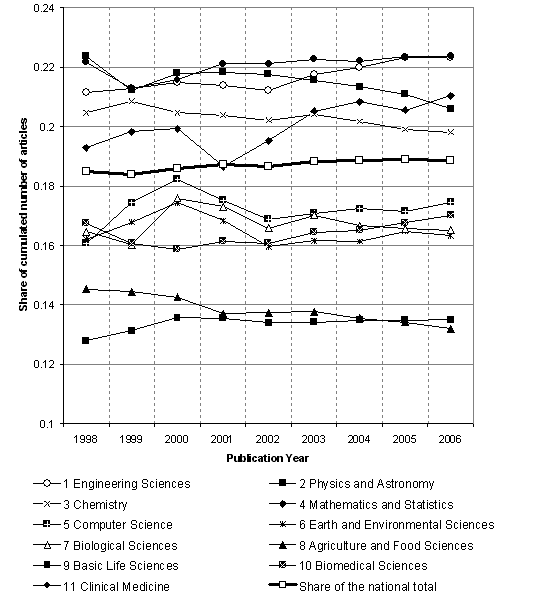
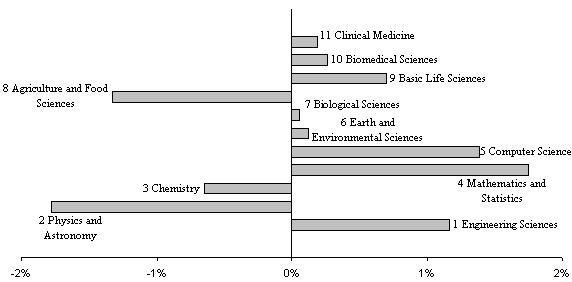
Seen over the whole period of observation, changes of growth are modest. Those fields showing some marked changes with regard to the difference between shares at the outset and the end of the observation period are 4 Mathematics and Statistics (+ 2 pp) and 2 Physics and Astronomy (- 2 pp) (Figure 2).
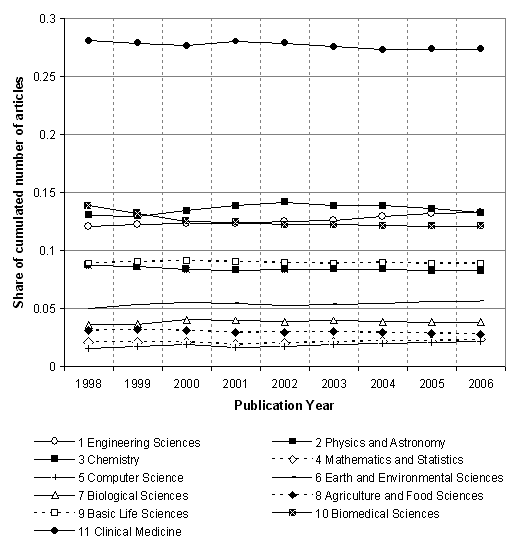
In order to establish which regional fields are the more or less productive in terms of published articles, the balance between regional fields was assessed. For each broad field, the annual shares of the cumulated number of regional articles were computed (Figure 3). There is little fluctuation over time and minute alterations of rank positions of broad fields. The most influential field, continuously covering more than a quarter of all articles during the observation period, is 11 Clinical Medicine. The remaining fields each contribute with less than 15% annually.
The most influential producers, the University of Gothenburg, Chalmers Institute of Technology and Sahlgrenska University Hospital, together cover 88% of the region's articles. The enterprise sector, distributed national agencies, regional hospitals and smaller universities make up the remainder. The University of Gothenburg is one of the major universities in Europe with eight faculties and fifty-seven departments, covering a wide range of the science fields. Of particular interest is the Sahlgrenska Academy, constituted by the faculties of Medicine, Odontology and Health Care Sciences. The research of Sahlgrenska Academy comprises a wide range of medical research, including clinical and pharmaceutical research, in cooperation with Sahlgrenska University Hospital, which is one of six teaching hospitals with medical education in Sweden. This provides an infrastructure necessary for teaching and research in cooperation with the Sahlgrenska Academy (Gothenburg University 2009). Hence, the strong impact of Clinical Medicine on regional research could be attributed to these two institutions. Chalmers University of Technology conducts research on a broad front within technology, natural science and architecture and covers 'everything from mathematics and natural sciences through technology to industrial sciences to social structures' (Chalmers University of Technology 2009).
A depiction of the institutional influence on science and technology fields for the whole period is arrived at mapping the percentage coverage of individual broad fields for regional institutions, and the Gini Index provides with a better understanding of how articles are distributed over broad fields (Table 1).
| Field | Gini coeff. |
Rank 1 producers |
Rank 1 percentage |
Rank 2 producers |
Rank 2 percentage |
Rank 3 producers |
Rank 3 percentage |
|---|---|---|---|---|---|---|---|
| 1 Engineering Sciences | 0.93 | Chalmers Inst Technol | 75% | Gothenburg Univ | 18% | SP Swed Natl Testing & Res | 3% |
| 2 Physics and Astronomy | 0.95 | Chalmers Inst Technol | 85% | Gothenburg Univ | 39% | EURATOM NFR | 1% |
| 3 Chemistry | 0.92 | Chalmers Inst Technol | 58% | Gothenburg Univ | 33% | Astra Zeneca AB | 11% |
| 4 Mathematics and Statistics | 0.89 | Chalmers Inst Technol | 82% | Gothenburg Univ | 35% | Astra Zeneca AB | 3% |
| 5 Computer Science | 0.86 | Chalmers Inst Technol | 63% | Gothenburg Univ | 19% | University of Skövde | 9% |
| 6 Earth and Environmental Sciences | 0.92 | Gothenburg Univ | 67% | Chalmers Inst Technol | 22% | IVL Swedish Environm Inst | 7% |
| 7 Biological Sciences | 0.91 | Gothenburg Univ | 87% | Chalmers Inst Technol | 5% | SLU | 2% |
| 8 Agriculture and Food Sciences | 0.86 | Gothenburg Univ | 42% | Chalmers Inst Technol | 21% | SLU | 16% |
| 9 Basic Life Sciences | 0.92 | Gothenburg Univ | 69% | Chalmers Inst Technol | 15% | Sahlgrenska Univ Hosp | 13% |
| 10 Biomedical Sciences | 0.93 | Gothenburg Univ | 63% | Sahlgrenska Univ Hosp | 27% | Astra Zeneca AB | 9% |
| 11 Clinical Medicine | 0.95 | Gothenburg Univ | 49% | Sahlgrenska Univ Hosp | 46% | Astra Zeneca AB | 6% |
Basically, there is a dividing up of first rank positions in broad fields between Gothenburg University and Chalmers University of Technology: Gothenburg University is ranked first in the biological sciences and earth & environmental sciences, while Chalmers University of Technology holds first rank positions in the engineering and physical sciences. As both Chalmers and Gothenburg have a wide scope of research, one would expect a common interest with regard to some broad fields. It is also apparent that Gothenburg University also makes substantial contributions to the physical sciences and one would expect a considerable overlap of articles produced in cooperation.
We appreciate that the two most concentrated broad fields are 11 Clinical Medicine and 2 Physics & Astronomy, with a Gini coefficient of 0.95 for both. In the first case, Gothenburg University and Sahlgrenska University Hospital cover (respectively) 49% and 46% of all publications and on the third rank position we see Astra Zeneca with a coverage of 6%. The remaining publishing producers in this field cover less than 1% each. With regard to 2 Physics & Astronomy, Chalmers Institute of Technology is the main producer, alone covering 85% of all publications. Ranked second, Gothenburg University covers 39% of all publications, and on the third rank position we see EURATOM (European Atomic Energy Community) with 1% coverage. The less concentrated fields are 5 Computer Science and 8 Agriculture and Food Science with a Gini coefficient of 0.86 for both fields.
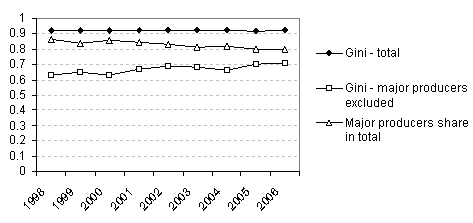
We conclude that the regional science and technology system is characterized by a large inequality among the producers. In Figure 4, the annual Gini coefficients computed with and without the three major producers, along with the annual shares of articles in regional totals of the three top producers are displayed. As can be seen, the total influence of the three major producers decreases somewhat over time, while the inequality within the set of minor producers increases. At the same time, the Gini coefficient computed on basis of all producers, is perfectly stable. Hence, the strong influence of the three major producers to some extent obscures a minor trend of increasing concentration of articles to less influential producers.
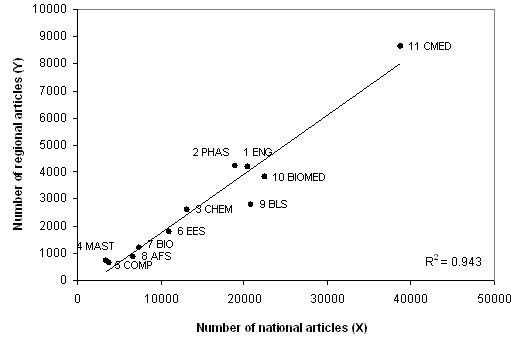
It would be of further interest to elaborate on the deviations between the national total and the regional sub-set with regard to the distribution of articles over broad fields. Put differently, could the nation serve as a model for the region with regard to scientific publishing on the broad field level? If so, a national model would suffice for predictive purposes, regional analyses may be superfluous, and we can suppose that the underlying dynamics of the regional and the national science and technology systems are similar. We consider X the publication frequency of national broad fields of the nation, and Y the publication frequency of the regional broad fields. The number of observations corresponds to the number of broad fields (2 · 11). In Figure 5, the data points are fitted to the regression line and we measure the proportion of variability with the coefficient of determination (r2). We arrive at the relatively high value 0.94 for r2 , though there are a couple of notable deviations. The broad field 9 Basic Life Sciences appears as an outlier in the plot and 11 Clinical Medicine may be regarded an influential point.
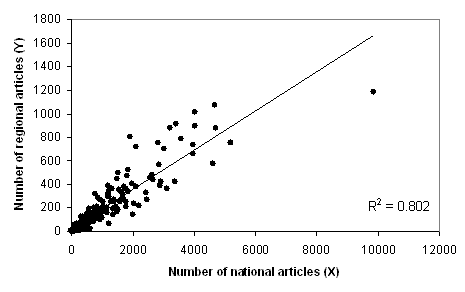
Repeating the analysis on the sub-field level, a lower coefficient of determination is arrived at with r2 = 0.80 and data points are more spread out (Figure 6). Hence, we conclude that the fit to a national model is less accurate on the sub-field level.
So far, with regard to the production of research articles, we have dealt with one set and three types of sub-sets which may not evolve in tune with each other over time:
The total set and the sub-sets are interrelated. The relation between the sub-sets (i) and (ii) concerns the balance between regional fields, while the relation between (ii) and (iv) concerns the influence of regional publication on the national total. The relation between the sub-sets (i) and (iii) concerns the influence of regional publication on a specific national broad field. Moreover, associating the relation between (i) and (iii) with the relation between (ii) and (iv), the relative output of the research effort the region has put into a specific field can be mirrored by the AI or the RSI.
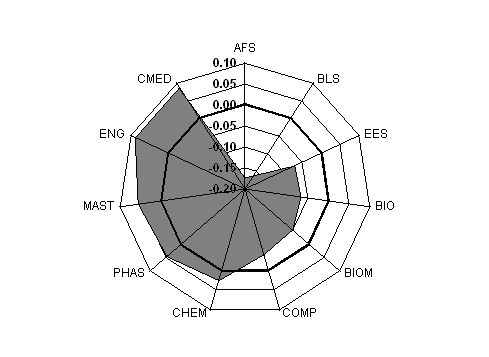
In Figure 7 the RSI has been applied for the mapping of the relative research output for the observation period 1998-2006.
In the polar-diagram applied, the standard (the perfectly balanced situation) is represented by a regular polygon where the edges cross the zero line. Deviations from the standard are represented by an irregular polygon. As can be seen, 11 Clinical medicine and 2 Engineering Sciences are clearly the most dominant regional fields. We can also recognize that the regional publication profile deviates somewhat from a western model (cf. Glänzel 2000) as it is not predominantly characterized by Clinical Medicine and Biomedicine. 1 Engineering Sciences, 4 Mathematics & Statistics and 2 Physics & Astronomy are above the standard, while 5 Computer Sciences and several fields from the life sciences are below.
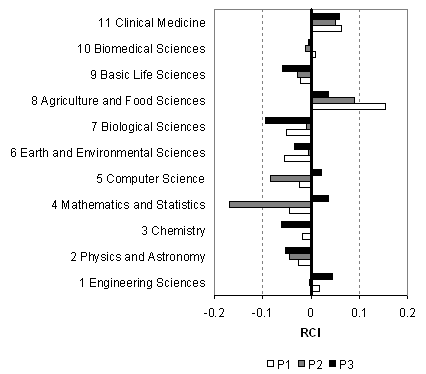
The impact of regional publishing was assessed in relation to the national standard, i.e., the mean number of citations of a national broad field. In Figure 8 the RCI for eleven regional broad fields during three consecutive periods (1998-2000, 2001-2003 and 2004-2006) is shown. It can be concluded that deviations from the standard were generally moderate, or at least not drastic.
The broad field 8 Agriculture and Food Sciences is notably above the standard during 1998-2000 and 4 Mathematics and Statistics clearly below during 2001-2003 . The large broad field 11 Clinical Medicine along with the considerably smaller 8 Agriculture and Food Sciences are never below the standard while 2 Physics and Astronomy, 6 Earth and Environmental Sciences, 7 Biological Sciences and 9 Basic Life Sciences are constantly below. Generally, regional articles tend to be cited slightly below the national average. Interestingly, the correlation between size of broad fields in terms of number of publications and the RCF changes over time from r = +0.208 in 1998-2000 to r = +0.323 in 2004-2006. The strongest correlation was seen during 2001-2003 where r = +0.363. Hence, there may be some advantages of a larger publication size in terms of citation impact. However, there is no explanation readily at hand for this temporal variation.
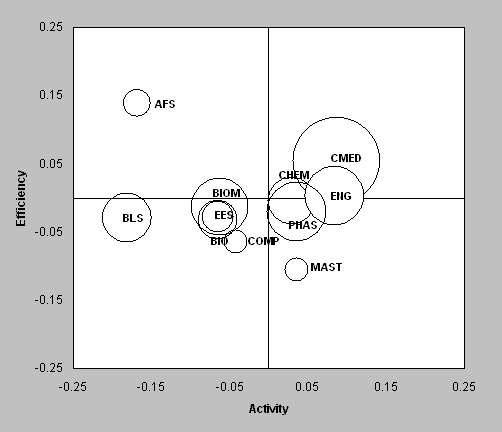
After studying the aspects of production and citation separately, the balance between production and citation impact of regional broad fields was examined. Mapping the relation between productivity and citation impact for regional broad fields is required since publication and citation indicators may show deviating trends, and it aids the identification of conspicuous fields. For this purpose, a two-dimensional orthogonal diagram, where the RSI indicates the abscissa (x) and the RCI the ordinate (y), was applied. This way, the position of two coordinates, (x, y) in the diagram mirrors the relative position of a broad field with regard to both productivity and citation impact. With a point of departure in the four quadrants of the diagram, i - iv (labelled counter-clockwise starting from the upper right), a research-performance typology referring to productivity as activity and citation impact as efficiency may be applied:
The balance between activity and efficiency was first examined with regard to three consecutive observation periods (1998-2000, 2001-2003 and 2004-2006) (Table 2).
| broad field | 1998-2000 | 2001-2003 | 2004-2006 |
|---|---|---|---|
| 1 Engineering Sciences | + + | + - | + + |
| 2 Physics and Astronomy | + - | + - | - - |
| 3 Chemistry | + - | + + | + - |
| 4 Mathematics and Statistics | + - | + - | + + |
| 5 Computer Science | - - | - - | - + |
| 6 Earth and Environmental Sciences | - - | - - | - - |
| 7 Biological Sciences | - - | - - | - - |
| 8 Agriculture and Food Sciences | - + | - + | - + |
| 9 Basic Life Sciences | - - | - - | - - |
| 10 Biomedical Sciences | - + | - - | - - |
| 11 Clinical Medicine | + + | + + | + + |
As can be seen, only one broad field, 11 Clinical Medicine, is active-efficient in all periods and 8 Agriculture and Food Sciences is the only broad field with a permanent position of inactive-efficient.
The broad fields 9 Basic Life Sciences, 7 Biological Sciences and 6 Earth and Environmental Sciences are positioned as inactive - inefficient in all periods. Extending the observation period to comprise the full period, 1998-2006, it appears that the larger, traditional and long-established disciplines, Physics, Chemistry and Medicine, along with Engineering and Mathematics, are the more active ones (right half of the diagram), though a simultaneous efficiency is only observed with regard to 11 Clinical Medicine (Figure 9).
Just as researchers must focus on a narrow range of problems, one may imagine that institutions or regions in some cases may have reasons to do the same, and invest more in some prioritised areas. Hence, the term specialization here refers to those national sub-fields in which the region has a strong influence, that is, those sub-fields with the largest shares in corresponding national sub-fields. As too low publication frequencies involve diminished reliability, sub-fields with fewer than ten articles published during a three-year interval (1998-2000, 2001-2003 or 2004-2006) were excluded with regard to that period of observation, independent of share. For each period of observation, those regional sub-fields that make up for at least 30% of a national sub-field total were identified. This percentage is of course to some extent arbitrary. However, considering that the annual average share of the national total is about 19%, an indication of specialization, one would think, ought to imply a considerably higher share.
The percentage shares for each sub-field are presented together with their RCFs for each observation period (Table 3-5). Five of these sub-fields are notably influential over all three observation periods:
| Sub-field | % of total | RCF |
|---|---|---|
| Materials Science, Biomaterials | 46.3 | 0.852 |
| Oceanography | 40.9 | 1.027 |
| Transportation Science & Technology | 40.7 | 0.978 |
| Emergency Medicine* | 40.0 | 1.510 |
| Dentistry, Oral Surgery & Medicine | 37.4 | 1.154 |
| Engineering, Biomedical | 36.1 | 0.940 |
| Engineering, Manufacturing | 34.5 | 1.311 |
| Cardiac & Cardiovascular Systems | 34.0 | 0.915 |
| Marine & Freshwater Biology | 33.7 | 1.028 |
| Engineering, Chemical | 31.8 | 1.037 |
| Sub-field | % of total | RCF |
|---|---|---|
| Emergency Medicine | 54.5 | 1.087 |
| Materials Science, Biomaterials | 43.8 | 1.048 |
| Dentistry, Oral Surgery & Medicine | 43.4 | 1.153 |
| Oceanography | 42.4 | 1.052 |
| Transportation Science & Technology | 36.1 | 1.256 |
| Engineering, Biomedical | 35.4 | 1.222 |
| Engineering, Manufacturing | 35.2 | 0.719 |
| Fisheries | 34.8 | 1.083 |
| Cardiac & Cardiovascular Systems | 34.0 | 0.959 |
| Geriatrics & Gerontology | 33.5 | 1.031 |
| Sub-field | % of total | RCF |
|---|---|---|
| Emergency Medicine | 48.0 | 1.023 |
| Dentistry, Oral Surgery & Medicine | 44.9 | 1.224 |
| Oceanography | 42.9 | 0.804 |
| Engineering, Multidisciplinary | 38.5 | 1.096 |
| Gastroenterology & Hepatology | 34.4 | 1.110 |
| Engineering, Chemical | 33.9 | 1.226 |
| Cardiac & Cardiovascular Systems | 33.6 | 1.243 |
| Mechanics | 32.5 | 0.995 |
| Materials Science, Biomaterials | 32.3 | 1.478 |
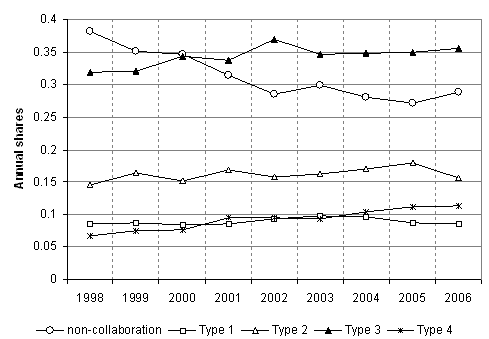
The pattern of collaboration, specifically, different types of joint publishing and their relations to research areas, was next explored. For this purpose, a collaboration typology applied by Melin and Persson (1998) was adopted and adapted to the design of this study:
From Table 6, we can see that quite a large share of articles was produced by a single institution. Hence, the production of a considerable share of articles did not involve collaboration between institutions (31%). This relatively large share, one may presume, is to some extent a reflection of the large inequality between institutions with regard to the distribution of published articles. The most frequent collaboration type was global collaboration, involving collaboration with exclusively foreign partners, whereas the mixed collaboration type covered only a little more than 9% of all articles and is of equal size as the internal collaboration type. The second most common collaboration type is the national, only involving other Swedish institutions.
| Statistics | No institutional collaboration | Region-region | Region-national | Region-global | Region-national-global |
|---|---|---|---|---|---|
| Percent of total | 31.1% | 9.0% | 16.2% | 34.4% | 9.3% |
| Number of publications | 7730 | 2226 | 4020 | 8537 | 2310 |
Over time, the non-collaborative type of articles decreases whereas international collaboration (type 3 and 4) increases and the national and regional collaboration types remain rather stable (Figure 10).
The balance between national and global collaboration is more clearly illustrated by the annual shares for national and international articles respectively in the total article production, non-collaborative articles excluded (Figure 11).
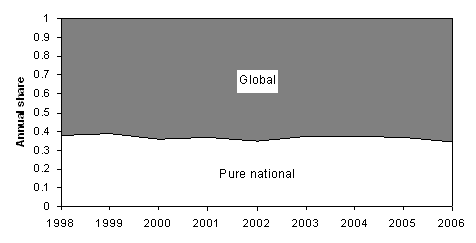
We conclude that the majority of collaborative research enterprises that lead to the publishing of research results in scientific journals require international collaboration.
One would also want to know something about the relation between collaboration types and research fields. In Figure 12, the distribution of shares over collaboration types for each broad field is shown. Some interesting features of this distribution may be noted: 2 Physics and Astronomy is the field that relies most on pure international collaboration (type 3) and such international enterprises make up for nearly half of its published research. Another field devoted to pure international collaboration is 7 Biological Sciences. With regard to the largest broad field, 11 Clinical Medicine, 31% of all published articles are of the non-collaborative type, which possibly is a reflection of the large size of Sahlgrenska University Hospital (incorporating several sub-units) and the Sahlgrenska Academy (the faculty of health sciences at the University of Gothenburg) which facilitates intra-institutional collaboration. This percentage may be compared with the share of type 3 publications for 11 Clinical Medicine, which was 26%. Other fields involve in collaboration to a relatively lesser extent, most notably 5 Computer Science which has the largest share of non-collaborative articles (41%).
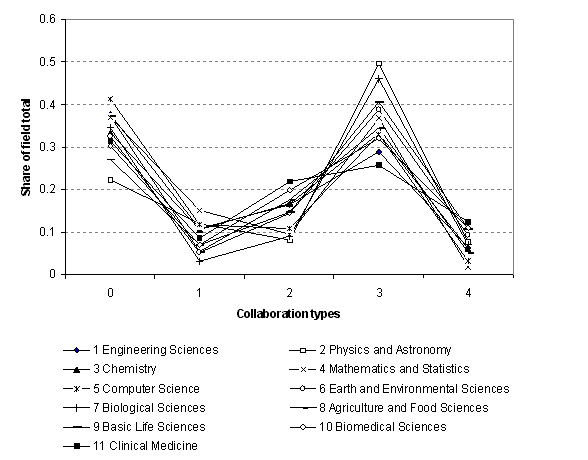
Considering the distribution of articles over collaboration types and broad fields, pure global collaboration within 11 Clinical Medicine and 2 Physics and Astronomy is the most common form of joint research enterprise (Figure 13).
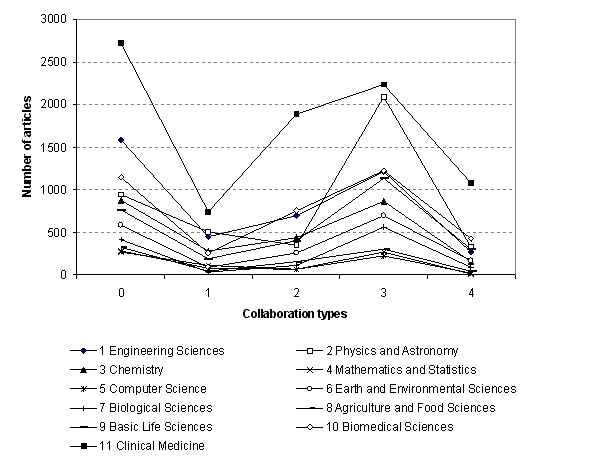
Adding together type 3 and type 4 articles, we get a more complete appreciation of the total international collaboration. Those broad fields with the largest shares of their totals generated in collaboration with foreign partners are 2 Physics and Astronomy (57%) and 7 Biological Sciences (53%) (Table 7). Similarly, 11 Clinical Medicine (22%) and 10 Biomedical Sciences (20%) are among those broad fields more inclined to perform pure national collaboration (type 2), (Table 8).
| Broad field | Share |
|---|---|
| 2 Physics and Astronomy | 57% |
| 7 Biological Sciences | 53% |
| 9 Basic Life Sciences | 51% |
| 6 Earth and Environmental Sciences | 48% |
| 10 Biomedical Sciences | 43% |
| 8 Agriculture and Food Sciences | 40% |
| 3 Chemistry | 39% |
| 4 Mathematics and Statistics | 38% |
| 11 Clinical Medicine | 38% |
| 5 Computer Science | 36% |
| 1 Engineering Sciences | 35% |
| Broad field | Share |
|---|---|
| 11 Clinical Medicine | 22% |
| 10 Biomedical Sciences | 20% |
| 8 Agriculture and Food Sciences | 18% |
| 3 Chemistry | 17% |
| 1 Engineering Sciences | 16% |
| 9 Basic Life Sciences | 15% |
| 6 Earth and Environmental Sciences | 14% |
| 5 Computer Science | 11% |
| 4 Mathematics and Statistics | 9% |
| 7 Biological Sciences | 9% |
| 2 Physics and Astronomy | 8% |
In this study, publication and citation-based indicators were applied with the intention to provide with an overview of the regional research publication pattern. As there are no all-purpose indicators, this study was limited to a condensed overview of regional visibility as opposed to an exhaustive evaluation of specific regional fields and departments, or certain other aspects of the regional science and technology system. Hence, it is important to keep in mind that bibliometric indicators are linked to particular levels and parts of the science and technology system and the application of bibliometric evaluations in regional or local political decision-making regarding research would require a breakdown of regional trends to the departmental or research group level, as well as other bibliometric indicators (cf. Persson and Danell 2004).
In this study, indicators are only appropriate for that part of the regional science and technology system that concerns scholarly communication within academic science and technology fields and, thus, the total contribution of regional enterprises to the system is not mapped. For instance, it would be misleading to use these indicators alone if the purpose was to map the output of industrial research and technology development, as patents play an important role in that context. Furthermore, the use of national aggregate data (as opposed to global aggregate data) when constructing performance indicators limits the range of interpretation of findings to the national political context of research.
With these limitations in mind, it is suggested that the design of this study may serve as a possible template for similar investigations on the regional level, as it covers the most basic bibliometric aspects of the regional science and technology system: (1) production, (2) citation impact, and (3) research collaboration. Starting from these three aspects, a large number of facts related to the original research questions were derived. However, an unselective observation of facts is not likely to produce useful results. Therefore, the relevance and particularities of the types of fact arrived at should be discussed briefly.
The percentage distributions of articles among the eleven broad fields as well as the time series presented are needed for the assessment of trends of the regional influence on the national research production and the regional publication character. With regard to the fit of regional publication to a national model, deviations on both the broad field level as well as on the sub-field level may point to areas where the impact of regional research political decisions and/or nationally-directed resources may be worth closer examination. Similarly, influential regional sub-fields that publish significantly more than average, indicating an aspect of specialization, are of particular interest.
The regional publication pattern was further modelled using relative publication indicators. The usefulness of these indicators is that they provide us with a depiction of the internal balance between regional fields and a comprehensive visualizations of publication profiles. Assessing the region's publication rewards in terms of relative citation frequencies is needed in order to understand to what extent regional research is acknowledged, and to identfy regional fields that produce publications that are frequently used by peers. However, previous research (Aksnes and Sivertsen 2004) as well as findings in this study showed that citation averages may be highly dependent on a few heavily cited articles. Therefore, an exhaustive interpretation of the regional citation impact would need a subsequent detailing of the citation averages. A more comprehensive description of research performance is achieved when the interrelation between productivity (activity) and citation impact (efficiency) is mapped, facilitating the identification of conspicuous fields.
The mapping of regional producers and their impact on science and technology fields is important in order to gain an understanding of the regional dependence on fields and institutions. The trend of increasing institutional collaboration and highly collaborative networks makes co-authorship analyses on various levels an essential part of bibliometric evaluation. Administration, evaluation, funding and control over institutions are all affected by the increasing complexity of collaborative networks.
The main findings of this study are summarised as follows.
Though there is a strong resemblance between the regional and the national science and technology systems, some notable deviations were found. In all cases, these were a stronger regional focus on 11 Clinical Medicine and 1 Engineering Sciences and a weaker focus on 9 Basic Life Sciences. On the sub-field level, deviations from the national model were enhanced, though not further detailed in the study. In terms of published articles, the markedly most productive regional broad field was 11 Clinical Medicine. A significantly higher relative publication output of regional sub-fields was recognized as regional specialization. Five such sub-fields were found to be notably influential over three consecutive periods of observation:
The analysis of citation impact revealed that the region was slightly under-cited in comparison with the nation, though deviations from national citation averages were generally moderate. When the balance between productivity and citation impact for regional broad fields was mapped, it was found that 11 Clinical Medicine was the only broad field with a high article production paired with a continuously high, relative citation impact during all periods of observation.
The regional science and technology system mirrored by published research articles was characterized by a large inequality among the producers. The most influential producers were University of Gothenburg, Chalmers University of Technology and Sahlgrenska University Hospital. This inequality was stable over the whole period of observation, though a weak trend of a collective diminishing influence for these producers was detected.
When mapping regional research collaboration between institutions in terms of joint publication efforts, it was found that approximately one third of all articles were produced by a single institution. The most frequent collaboration type was global collaboration, involving collaboration with exclusively foreign partners, and the second most common collaboration type was the national, only involving other Swedish institutions. A clear relation between fields and collaboration types was found. Considering to the different sizes of broad fields, the distribution of articles over collaboration types and broad fields showed that pure global collaboration within 11 Clinical Medicine and 2 Physics and Astronomy was the most common type of regional research collaboration. Though some important features of the regional collaboration network have been laid bare, an exhaustive mapping of regional research collaboration would require a more detailed study, in particular with regard to the type 3 and 4 networks. Conclusively, the regional level of analysis adds a level of complexity and we may view the total regional collaborative network as a layer cake comprising associations between regional institutions, regional and domestic institutions and regional and foreign institutions.
The author wishes to thank Amanda Cossham for copy-editing and improvements to the text.
Bo Jarneving is a senior lecturer in the Department of Library and Information Science, University of Borås, Sweden. He received his Master's degree in Library and Information from University of Borås, Sweden and his PhD from the University of Gothenburg, Sweden. He can be contacted at: bo.jarneving@hb.se
| Find other papers on this subject | ||
| 1 Engineering Sciences Agricultural Engineering Automation & Control Systems Construction & Building Technology Energy & Fuels Engineering, Aerospace Engineering, Chemical Engineering, Civil Engineering, Electrical & Electronic Engineering, Environmental Engineering, Geological Engineering, Industrial Engineering, Manufacturing Engineering, Marine Engineering, Mechanical Engineering, Multidisciplinary Engineering, Ocean Engineering, Petroleum Ergonomics Imaging Science & Photographic Technology Instruments & Instrumentation Materials Science, Biomaterials Materials Science, Ceramics Materials Science, Characterization & Testing Materials Science, Coatings & Films Materials Science, Composites Materials Science, Multidisciplinary Materials Science, Paper & Wood Materials Science, Textiles Mechanics Metallurgy & Metallurgical Engineering Microscopy Mining & Mineral Processing Nanoscience & Nanotechnology Nuclear Science & Technology Operations Research & Management Science Robotics Telecommunications Transportation Science & Technology 2 Physics and Astronomy Acoustics Astronomy & Astrophysics Crystallography Optics Physics, Applied Physics, Atomic, Molecular & Chemical Physics, Condensed Matter Physics, Fluids & Plasmas Physics, Mathematical Physics, Multidisciplinary Physics, Nuclear Physics, Particles & Fields Spectroscopy Thermodynamics 3 Chemistry Chemistry, Analytical Chemistry, Applied Chemistry, Inorganic & Nuclear Chemistry, Medicinal Chemistry, Multidisciplinary |
Chemistry, Organic Chemistry, Physical Electrochemistry Polymer Science 4 Mathematics and Statistics Mathematics Mathematics, Applied Mathematics, Interdisciplinary Applications Social Sciences, Mathematical Methods Statistics & Probability 5 Computer Science Computer Science, Artificial Intelligence Computer Science, Cybernetics Computer Science, Hardware & Architecture Computer Science, Information Systems Computer Science, Interdisciplinary Applications Computer Science, Software Engineering Computer Science, Theory & Methods 6 Earth and Environmental Sciences Ecology Environmental Sciences Geochemistry & Geophysics Geography Geography, Physical Geology Geosciences, Multidisciplinary Limnology Meteorology & Atmospheric Sciences Mineralogy Oceanography Paleontology Remote Sensing Water Resources 7 Biological Sciences Biology Entomology Evolutionary Biology Marine & Freshwater Biology Mathematical & Computational Biology Mycology Ornithology Plant Sciences Zoology 8 Agriculture and Food Sciences Agriculture, Dairy & Animal Science Agriculture, Multidisciplinary Agriculture, Soil Science Agronomy Fisheries Food Science & Technology Forestry Horticulture Nutrition & Dietetics Soil Science Veterinary Sciences Agricultural Economics & Policy 9 Basic Life Sciences Biochemical Research Methods Biochemistry & Molecular Biology Biodiversity Conservation |
Biophysics Biotechnology & Applied Microbiology Cell Biology Developmental Biology Genetics & Heredity Microbiology Reproductive Biology 10 Biomedical Sciences Anatomy & Morphology Andrology Behavioural Sciences Engineering, Biomedical Immunology Infectious Diseases Medicine, legal Medicine, Research & Experimental Neuroimaging Neurosciences Parasitology Pathology Pharmacology & Pharmacy Physiology Radiology, Nuclear Medicine & Medical Imaging Toxicology Virology 11 Clinical Medicine Allergy Anaesthesiology Cardiac & Cardiovascular Systems Clinical Neurology Critical Care Medicine Dentistry, Oral Surgery & Medicine Dermatology Emergency Medicine Endocrinology & Metabolism Gastroenterology & Hepatology Geriatrics & Gerontology Haematology Integrative & Complementary Medicine Medical Informatics Medical Laboratory Technology Medicine, General & Internal Obstetrics & Gynaecology Oncology Ophthalmology Orthopaedics Otorhinolaryngology Paediatrics Peripheral Vascular Disease Psychiatry Public, Environmental & Occupational Health Rehabilitation Respiratory System Rheumatology Sport Sciences Substance Abuse Surgery Transplantation Tropical Medicine Urology & Nephrology |
© the author, 2009. Last updated: 18 April, 2009 |