vol. 17 no. 1, March, 2012
vol. 17 no. 1, March, 2012 | ||||
Internet corporate reporting has emerged since the last decade (Poon et al. 2003; Wong and Poon 2008; Poon and Yu 2012). In this model, firms use the Web to disseminate up-to-date corporate information to a global audience (Wong and Poon 2008). Corporate information can be financial (such as share price) or non-financial (such as organisational profile). As financial information may influence investment decisions (Holder-Webb et al. 2008), Internet financial reporting is almost invariably an integral part of Internet corporate reporting (Poon et al. 2003).
Hong Kong is a prominent financial centre in the Asia-Pacific region. In the past decade, there has been an influx of mainland China-incorporated companies being traded at the Hong Kong Exchanges and Clearing Limited (or the Hong Kong Stock Exchange) under the guise of the H-share. These offshore companies are called H-share firms (for example, China Construction Bank Corporation). Other companies listed in the Hong Kong Stock Exchange are called non-H-share firms (for example, Cathay Pacific Airways Limited). Some H-share firms have established their subsidiaries or representative offices in Hong Kong and have implemented corporate Websites for information dissemination, thus further contributing to the growth of Internet corporate reporting in Hong Kong.
We expect that many firms in Hong Kong have corporate Websites and, hence, are Web-present. Moreover, we postulate that many Web-present firms use Internet corporate/financial reporting to their benefit. To provide a clearer picture of the degree of Internet corporate reporting by firms in Hong Kong, we performed two rounds of studies within a three-year period. We define the degree of Internet corporate reporting in terms of the richness of the corporate information disclosed on the Websites. This was measured by the quantity of online corporate information categories. Our premise is that the richness of corporate information disclosed on a firm's Website reflects the firm's commitment, effort, resources and level of strategic significance attached to Internet corporate reporting.
We performed two rounds of studies within a three-year period, analysing 200 firms in each round. The firms originated from two different groups of regions (mainland China and other locations) and showed a distinct difference in their level of corporate governance. Whereas Internet financial reporting has been studied in other regions, our work is unique in studying listed firms in Hong Kong and in considering the broader context of Internet corporate reporting. (Internet corporate reporting also covers Internet financial reporting in our analysis as long as financial information is relevant to the firm's characteristic under discussion.)
Our study shows that firms increasingly adopted Internet corporate reporting over the three-year study period, regardless of their origin. The degree of such reporting was generally high. In today's dynamic and competitive business environment, Internet corporate reporting is no longer a 'nice-to-have' option, but rather an essential and affordable one that any firm should implement for information dissemination.
This empirical study also shows how the research framework developed in Part 1 of this study (Poon and Yu 2012) can be adapted to study the adoption of Internet corporate reporting in a local context.
Our research framework is grounded on the diffusion of innovation theory (Baskerville and Pries-Heje 2001; Carter et al. 2001; Moore and Benbasat 1991; Rogers 2003), the expectation-confirmation theory (Bhattacherjee 2001; Chea and Luo 2008; Lin et al. 2005), corporate governance theories (Claessens 2006; Cohen et al. 2004) and the learning/experience curve theories (Chang 1996; Henderson 1973; Lieberman 1987).
The diffusion of innovation theory states that individuals exhibit different degrees of willingness to adopt innovations, which can be an idea, practice or object that is perceived as new. The rate of adopting an innovation is influenced by several determinants, such as relative advantage (the degree to which an innovation is perceived to be better than its precursor) and trialability (the degree to which an innovation may be experimented with before adoption).
The expectation-confirmation theory is widely used to study customer satisfaction and post-purchase behaviour. It states that consumers have expectations of a product prior to purchase. If the product performs better than expected, customer satisfaction with the product increases. On the contrary, if the product performs less well than expected, customers are less likely to purchase the product in the future.
Corporate governance theories postulate a positive relationship between corporate governance (a mechanism to ensure that a corporation conducts its business in accordance with corporate laws and regulations) and voluntary dissemination of company information. Thus, a firm with weak corporate governance is often less transparent in operations and, hence, is less inclined to voluntarily disclose company information to outsiders.
Finally, the learning/experience curve theories state that the more frequently a task is performed, the lower its cost. Therefore, firms should capitalise on the learning/experience effects to reduce operations costs and increase market share, profitability and market dominance.
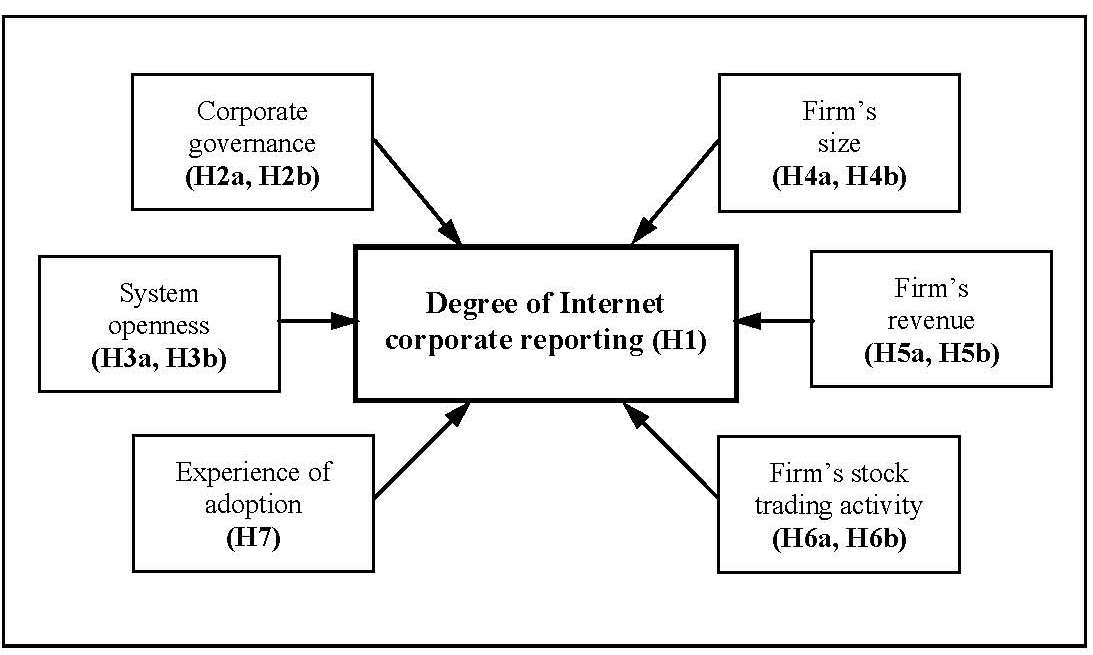
Our research framework is generic and therefore applicable to a variety of contexts. It poses several research questions related to the adoption of Internet corporate reporting. The research questions were further refined into a set of hypotheses. Our first paper (Poon and Yu 2012) has discussed these theories in detail and explained how they led to the research framework. In this paper, we adapted the framework to the local context for an empirical study of the degree of Internet corporate reporting in listed firms in Hong Kong. Modifications in our research questions are highlighted by words in italics, while the hypotheses are reproduced from our previous paper for application to the context of listed firms in Hong Kong.
Figure 1 summarises the research model that incorporates the major potential determinants affecting the degree of Internet corporate reporting.
The empirical study tests the hypotheses formulated in the previous section. This section reports the data collection process and describes the development of the operational measures for the variables in the hypotheses.
We tested our hypotheses with data collected from all the firms listed in the Hong Kong Stock Exchange which constitute the Hang Seng Composite Index Series (or the Index Series). The Index Series is composed of the top 200 listed firms in terms of market capitalisation. These firms collectively account for over 80% of the total capitalisation of the stocks in Hong Kong. They thus form a significant and representative data set.
Data collection was performed during August-October 2004 and October-November 2007. Comparing the two data sets, we found that seventy listed firms that appeared in the Index Series in the first round were replaced by a different set of seventy firms in the second round, as changes in these firms' financial performance had led to a change of the composition of the Index Series.
In each round, we first verified the existence of the firms' corporate Websites. We phoned the firm directly to confirm the absence of its Website if the latter could not be located.
The following proxy variables are used to test our hypotheses.
H1 [degree of Internet corporate reporting]
Web presence can be directly determined by the existence (or absence) of a Website. No proxy was therefore needed here.
For each Web-present firm, we analysed its corporate Website in detail. We classified the online corporate information into two types, financial and non-financial, as shown in Table 1. The table was developed from e-commerce literature, investor relations literature and online visits to corporate Websites.
| Scoring rule: Count one for each of the following categories present on the corporate Website; zero otherwise. Degree of Internet corporate reporting (CI) = Total score of both online financial and non-financial categories. Degree of Internet financial reporting (FI) = Total score of online financial categories only. |
|
| Online non-financial categories: | |
| 1. Organisational profile | 12. Monitoring and control |
| 2. Organisational information | 13. Dividend announcement |
| 3. Organisational news | 14. Notice of annual general meeting |
| 4. Directors' information | 15. List of properties |
| 5. Employment information | 16. Business review |
| 6. Contact information | 17. Environment |
| 7. Product/service information | 18. Energy |
| 8. Chairman's statement | 19. Human resources and management |
| 9. Chief executive's review | 20. Products and customers |
| 10. Directors' report | 21. Community |
| 11. Audit committee | |
| Online financial categories: | |
| 22. Profit and loss account | 29. Multiple currencies |
| 23. Balance sheet | 30. Segmental analysis |
| 24. Cash flow statement | 31. Share price |
| 25. Notes to accounts | 32. Share price analysis |
| 26. Financial ratios | 33. Analysis of shareholdings |
| 27. Financial summary | 34. Auditor's report |
| 28. Financial highlights | 35. Interim report |
We measured the degree of Internet corporate reporting by the amount of online corporate information categories presented on the Website. This is denoted by the variable CI. The value of CI gives an indication of the richness of corporate information disseminated through the firm's Website. Similarly, we use the amount of online financial information categories presented on the Website, denoted by the variable FI, as the measure of the degree of Internet financial reporting. Operationally, CI refers to the count of both financial and non-financial information categories found in the corporate Website, while FI refers to the count of financial information categories only.
H2a [corporate governance![]() Web presence]
Web presence]
H2b [corporate governance![]() degree of Internet corporate reporting]
degree of Internet corporate reporting]
Cheung et al. (2007) argue that Hong Kong-based companies perform better than China-related companies in terms of corporate governance. This suggests that H-share and non-H-share firms are good indicators for corporations with (relatively) weak and strong corporate governance, respectively.
H3a [>system openness![]() Web presence]
Web presence]
H3b [system openness![]() degree of Internet corporate reporting]
degree of Internet corporate reporting]
System openness measures the degree to which a firm is linked to its external environment. Non-executive (independent) directors generally play a pivotal role in corporate decision-making in listed firms. The independence of non-executive directors allows them to apply their experience and competencies with fresh, objective input. Some researchers (Agrawal and Chadha 2005; Baysinger and Hoskisson 1990) argue that the appointment of non-executive directors reflects the effectiveness of a firm in receiving and responding to ‘external' forces in its environment. Thus, the number of non-executive directors in the Board of Directors (or the Board) is a good proxy for system openness.
The Hong Kong Stock Exchange requires every listed firm to appoint three or more non-executive directors to its Board, regardless of the Board's size. H-share firms must also fulfil the listing rules in mainland China, which require that at least one-third of their Boards must be non-executive directors. For example, if the size of a Board is 12, then the minimum number of non-executive directors is four, which more than fulfils the minimum requirement imposed by the Hong Kong Stock Exchange.
Owing to the above statutory requirements, a listed firm does not have complete discretion in deciding the number of non-executive directors. Hence, the percentage of non-executive directors in a Board is not a good proxy for system openness. Instead, we divided all listed firms into two groups. We refer to firms that fulfil above the minimum statutory requirements for non-executive directors as Group-A firms, and other firms as Group-B firms. With respect to the appointment of non-executive directors, Group-A firms have adopted a more open and proactive management style, while Group-B firms have a relatively conservative and passive style. Therefore, Group-A firms and Group-B firms are used as proxies for corporations with a higher and lower level of system openness, respectively.
H4a [size![]() Web presence]
Web presence]
H4b [size![]() degree of Internet corporate reporting]
degree of Internet corporate reporting]
H5a [revenue![]() Web presence]
Web presence]
H5b [revenue![]() degree of Internet corporate reporting]
degree of Internet corporate reporting]
H6a [stock trading activity![]() Web presence]
Web presence]
H6b [stock trading activity![]() degree of Internet corporate reporting]
degree of Internet corporate reporting]
Market capitalisation, net profit and stock turnover are often used as proxies for a firm's size, revenue and stock trading activity, respectively. We followed this practice when testing H4a, H4b, H5a, H5b, H6a and H6b. All the measurement information came directly from the Hong Kong Stock Exchange and, therefore, is reliable and free of bias.
H7 [experience of adoption![]() degree of Internet corporate reporting]
degree of Internet corporate reporting]
To test H7, we divided the firms into two groups: less experienced and more experienced adopters of Internet corporate reporting. For this purpose, we considered only the firms which were Web-present in both 2004 and 2007. Suppose Firm-A is one such firm. Then Firm-A in 2004 was obviously less experienced as an adopter of Internet corporate reporting than the same firm in 2007. By comparing the degrees of Internet corporate reporting of each firm in 2004 and 2007, we could test statistically whether H7 holds. For easy reference, we called these firms in 2004 Group-1 firms (which were less experienced in adopting Internet corporate reporting) and the same firms in 2007 as Group-2 firms (which were then more experienced). Even though the two groups consist of the same firms, they were actually at different states (in terms of possessing different experiences of adopting Internet corporate reporting) in 2004 and 2007, respectively.
We obtained two data sets, which we refer to as the 2004 data set and 2007 data set. For notational convenience, given a hypothesis Hn, we denoted its corresponding null hypothesis by Hno. For example, corresponding to H2a [corporate governance![]() Web presence], we denoted by H2ao the null hypothesis that 'there is no difference between the level of corporate governance of Web-present and non-Web-present firms'.
Web presence], we denoted by H2ao the null hypothesis that 'there is no difference between the level of corporate governance of Web-present and non-Web-present firms'.
For each hypothesis (except H1), we computed both its test statistic and p-value. Unless stated otherwise, we adopted 5% as the threshold of significance level to determine whether to reject a null hypothesis. When a result to reject a null hypothesis is statistically significant (that is, when p-value <0.05), we present the p-value with an asterisk (for example, ‘p-value = 0.021*').
Table 2 shows that, in both data sets, a very high proportion of the firms were Web present. In 2004, 89.5% of the firms were Web present. This percentage increased to 96.5% in 2007. The data sets confirm that the adoption of Internet corporate reporting has been very popular since 2004, and that this popularity has increased over time. This phenomenon is true of both H-share and non-H-share firms (see the results on corporate governance later). The proportion of firms with a Web presence is high irrespective of their origins.
| First round of study (2004) | Second round of study (2007) | |||
|---|---|---|---|---|
| Number | Percentage | Number | Percentage | |
| Web-present firms | 179 | 89.5% | 193 | 96.5% |
| Non-Web-present firms | 21 | 10.5% | 7 | 3.5% |
| Total | 200 | 100% | 200 | 100% |
Table 3 shows statistics of the degrees of Internet corporate/financial reporting in Web-present firms. In 2004, the mean degree of Internet corporate reporting of Web-present firms was 26.9 out of a maximum of 35, and in 2007 the corresponding mean was 29.4 out of 35. For the degree of Internet financial reporting of Web-present firms, the mean values were 10.9 and 12.1 in 2004 and 2007, respectively, out of a maximum of 14. We observed a similar pattern regarding the respective median values. These results provide strong support for H1 [degree of Internet corporate reporting].
| First round of study (2004) | Second round of study (2007) | |||||
|---|---|---|---|---|---|---|
| Mean (%age) |
Median | Standard deviation |
Mean (%age) |
Median | Standard deviation |
|
| Number of online corporate information categories, CI (degree of Internet corporate reporting, max = 35) |
26.9 (76.9%) |
28 | 6.3 | 29.4 (84.0%) |
30 | 2.6 |
| Number of online financial information categories, FI (degree of Internet financial reporting, max = 14) |
10.9 (77.9%) |
11 | 3.2 | 12.1 (86.4%) |
13 | 1.4 |
There are interesting changes in the degrees of Internet corporate/financial reporting in the two data sets. Table 3 shows that both the mean and median degrees of Internet corporate/financial reporting increased over the three-year period. At the same time, the standard deviations for the degrees of Internet corporate/financial reporting decreased by more than half (from 6.3 to 2.6 for Internet corporate reporting and from 3.2 to 1.4 for Internet financial reporting). In other words, the variation of the degrees of Internet corporate/financial reporting had been largely reduced.
The mean degrees of Internet corporate reporting in 2004 and 2007 were 76.9% and 84.0%, respectively, of the maximum, showing a growth of 7.1% within the three-year period. In comparison, the percentages for the degree of Internet financial reporting were 77.9% and 86.4%, respectively, showing a growth of 8.5%. The median values show a similar pattern. Thus, not only were the percentages in both 2004 and 2007 for the degree of Internet financial reporting consistently higher than the corresponding percentages for the degree of Internet corporate reporting, but the amount of growth of the degree of Internet financial reporting was also higher. This supports the common belief that financial information is generally of more interest than non-financial information, especially to investors. Holder-Webb et al. (2008), for instance, report that 62% of retail investors prefer financial information for use in investment decisions.
We have used H-share and non-H-share firms as proxies for corporations with (relatively) weak and strong corporate governance, respectively. We analysed whether firms with weak corporate governance (H-share firms) and strong corporate governance (non-H-share firms) were statistically different in terms of Web presence (H2a) and, for Web-present firms, in terms of their degrees of Internet corporate reporting (H2b).
Table 4 shows that the percentages of H-share firms with Web presence (84.2% in 2004 and 93.9% in 2007) were consistently lower than the corresponding percentages of non-H-share firms (94.9% in 2004 and 100% in 2007). The chi-squared (χ2) two-sample test statistics were 6.20 (p-value = 0.013*) in 2004 and 5.36 (p-value = 0.021*) in 2007, thereby rejecting the null hypothesis H2ao. Thus, the data sets provide strong support for H2a [corporate governance → Web presence].
| First round of study (2004) | Second round of study (2007) | |||
|---|---|---|---|---|
| Number of firms | Number (percentage) of Web-present firms | Number of firms | Number (percentage) of Web-present firms | |
| H-share firms (weak corporate governance) | 101 | 85 (84.2%) | 115 | 108 (93.9%) |
| Non-H-share firms (strong corporate governance) | 99 | 94 (94.9%) | 85 | 85 (100%) |
| Chi-squared (χ2) two-sample test statistic | 6.20 (p-value = 0.013*) |
5.36 (p-value = 0.021*) |
||
We then considered H2b [corporate governance![]() degree of Internet corporate reporting]. Table 5 shows the mean, median and standard deviation values of the degrees of Internet corporate reporting of H-share and non-H-share Web-present firms. In both 2004 and 2007, H-share Web-present firms had smaller mean and median (but larger standard deviation) values of CI than non-H-share Web-present firms. Moreover, the differences are significant based on the Mann-Whitney U test (p-value = 0.015* in 2004 and 0.001* in 2007). Thus, H2bo was rejected. In other words, both data sets support H2b. This result is in line with previous findings (Claessens 2006; Cohen et al. 2004) which show that corporate governance is directly related to the disclosure of company information mainly through the traditional (non-Web-based) reporting channel.
degree of Internet corporate reporting]. Table 5 shows the mean, median and standard deviation values of the degrees of Internet corporate reporting of H-share and non-H-share Web-present firms. In both 2004 and 2007, H-share Web-present firms had smaller mean and median (but larger standard deviation) values of CI than non-H-share Web-present firms. Moreover, the differences are significant based on the Mann-Whitney U test (p-value = 0.015* in 2004 and 0.001* in 2007). Thus, H2bo was rejected. In other words, both data sets support H2b. This result is in line with previous findings (Claessens 2006; Cohen et al. 2004) which show that corporate governance is directly related to the disclosure of company information mainly through the traditional (non-Web-based) reporting channel.
| First round of study (2004) | Second round of study (2007) | |||||
|---|---|---|---|---|---|---|
| Number of online corporate information categories (CI) | Number of online corporate information categories (CI) | |||||
| Mean | Median | Standard deviation |
Mean | Median | Standard deviation |
|
| H-share Web-present firms (weak corporate governance) |
26.0 | 28 | 6.8 | 28.9 | 29 | 2.7 |
| Non-H-share Web-present firms (strong corporate governance) |
27.8 | 29 | 5.7 | 30.1 | 30 | 2.3 |
| Mann-Whitney U test statistic | 3163 (p-value = 0.015*) |
3370 (p-value = 0.001*) |
||||
Corporate governance can be measured by many aspects of a firm, most of which are non-financial (Bushman et al. 2004). For example, Governance Metrics International, a corporate governance research and ratings agency established in April 2000, uses a rating system which considers six categories of analysis in determining the rating of corporate governance of a firm: (1) board accountability, (2) financial disclosure and internal controls, (3) executive compensation, (4) shareholder rights, (5) ownership base and takeover provisions, (6) corporate behaviour and social responsibility. Most of these categories correspond to the non-financial information categories in Table 1. In relation to corporate governance, therefore, there is little theoretical ground to consider the disclosure of financial information alone. As such, we did not further analyse Internet financial reporting with respect to H2b.
We classified the 200 firms into two groups: firms that fulfilled above the minimum statutory requirements for non-executive directors (Group-A firms), and those that did not (Group-B firms). Group-A firms had a higher level of system openness than Group-B firms. We analysed whether Group-A firms and Group-B firms were statistically different in terms of Web presence (H3a) and, for Web-present firms, in terms of their degrees of Internet corporate reporting (H3b). Similar to corporate governance, while system openness is shown in the literature to bear relation to the disclosure of corporate (mainly non-financial) information, there is little theoretical ground to consider the disclosure of financial information alone. For example, Rashid and Lodh (2008) report that introducing non-executive directors (our proxy of system openness) to a Board of Directors would result in a significant increase in corporate social reporting, which corresponds to the non-financial information categories such as ‘Environment', ‘Energy' and ‘Community' in Table 1. Therefore, we did not include Internet financial reporting in the data analysis for H3b.
Table 6 shows that in 2004, 92.8% of Group-A firms were Web-present, compared to only 87.2% of Group-B firms. By 2007, however, the percentage of Web-present firms (95.3%) within Group-A was smaller than the percentage (97.9%) within Group-B. Thus, the results do not clearly show which group contained the higher proportion of Web-present firms. Moreover, when comparing the Web-present firms in Group-A and Group-B, the chi-squared (χ2) two-sample test statistics were 1.62 (p-value = 0.204) and 0.99 (p-value = 0.320) for the 2004 and 2007 data sets, respectively. Neither difference is statistically significant. Thus, H3ao cannot be rejected in favour of H3a [system openness![]() Web presence].
Web presence].
| First round of study (2004) | Second round of study (2007) | ||||
|---|---|---|---|---|---|
| Number of firms | Number (percentage) of Web-present firms | Number of firms | Number (percentage) of Web-present firms | ||
| Group-A firms† (higher level of system openness) | 83 | 77 (92.8%) | 106 | 101 (95.3%) | |
| Group-B firms† (lower level of system openness) | 117 | 102 (87.2%) | 94 | 92 (97.9%) | |
| Chi-squared (χ2) two-sample test statistic | 1.62 (p-value = 0.204) |
0.99 (p-value = 0.320) |
|||
| † Group-A firms = firms that fulfilled above the minimum statutory requirements for non-executive directors; Group-B firms = other firms | |||||
We then considered H3b [system openness![]() degree of Internet corporate reporting]. Table 7 shows the mean, median and standard deviation values of the degrees of Internet corporate reporting of Group-A and Group-B Web-present firms. In 2004, Group-A Web-present firms had a marginally lower mean but a somewhat higher median value of CI than those in Group-B. Moreover, the Mann-Whitney U test shows no significant difference between these two groups (p-value = 0.310). On the other hand, in 2007, both the mean and median values of CI of Group-A Web-present firms were higher than those in Group-B, and this difference is significant (p-value = 0.028*) according to the Mann-Whitney U test. Thus, the statistical evidence for H3b is mixed, and the null hypothesis H3bo cannot be clearly rejected.
degree of Internet corporate reporting]. Table 7 shows the mean, median and standard deviation values of the degrees of Internet corporate reporting of Group-A and Group-B Web-present firms. In 2004, Group-A Web-present firms had a marginally lower mean but a somewhat higher median value of CI than those in Group-B. Moreover, the Mann-Whitney U test shows no significant difference between these two groups (p-value = 0.310). On the other hand, in 2007, both the mean and median values of CI of Group-A Web-present firms were higher than those in Group-B, and this difference is significant (p-value = 0.028*) according to the Mann-Whitney U test. Thus, the statistical evidence for H3b is mixed, and the null hypothesis H3bo cannot be clearly rejected.
| First round of study (2004) | Second round of study (2007) | |||||
|---|---|---|---|---|---|---|
| Number of online corporate information categories (CI) | Number of online corporate information categories (CI) | |||||
| Mean | Median | Standard deviation |
Mean | Median | Standard deviation |
|
| Group-A Web-present firms (higher level of system openness) | 26.9 | 29 | 7.0 | 29.9 | 30 | 2.2 |
| Group-B Web-present firms (lower level of system openness) | 27.0 | 28 | 5.7 | 29.0 | 29 | 2.9 |
| Mann-Whitney U test statistic | 3198 (p-value = 0.310) |
3803 (p-value = 0.028*) |
||||
We first considered H4a [size![]() Web presence], H5a [revenue
Web presence], H5a [revenue![]() Web presence] and H6a [stock trading activity
Web presence] and H6a [stock trading activity![]() Web presence]. We measured a firm's size, revenue and stock trading activity by its market capitalisation, net profit and stock turnover (denoted by MC, NP and ST, respectively), and compared firms with Internet corporate/financial reporting to those without.
Web presence]. We measured a firm's size, revenue and stock trading activity by its market capitalisation, net profit and stock turnover (denoted by MC, NP and ST, respectively), and compared firms with Internet corporate/financial reporting to those without.
Table 8 shows the median values of MC, NP and ST of all the subject firms. (To avoid the table being clustered too densely with numbers, the mean and standard deviation values are not shown in Table 8). The 2004 and 2007 data sets are remarkably consistent: with no exception, the median values of MC, NP and ST of firms with Internet corporate/financial reporting are substantially larger than those without. More interestingly, according to the Mann-Whitney U test statistics, these differences are all statistically significant in 2004, but no longer so in 2007. Thus, Table 8 supports H4a, H5a and H6a in 2004 but not in 2007.
| First round of study (2004) | Second round of study (2007) | |||||
|---|---|---|---|---|---|---|
| Median value (in million Hong Kong dollars) |
Median value (in million Hong Kong dollars) |
|||||
| MC | NP | ST | MC | NP | ST | |
| Firms with Internet corporate reporting | 5,258 | 424 | 18 | 28,358 | 1,258 | 71 |
| Firms without Internet corporate reporting | 1,694 | 150 | 10 | 18,287 | 553 | 63 |
| Mann-Whitney U test statistic p-value |
868 <0.001* |
1180 = 0.005* |
1350 = 0.035* |
582 = 0.534 |
445 = 0.125 |
672 = 0.981 |
| Firms with Internet financial reporting | 5,628 | 433 | 20 | 28,687 | 1,265 | 72 |
| Firms without Internet financial reporting | 1,986 | 169 | 9 | 16,616 | 479 | 46 |
| Mann-Whitney U test statistic p-value |
1195 <0.001* |
1636 = 0.002* |
1817 = 0.012* |
610 = 0.325 |
458 = 0.053 |
688 = 0.615 |
Furthermore, our data shows that the degrees of Internet corporate financial reporting varied widely. For example, in 2004, out of the thirty-five online corporate information categories listed in Table 1, one corporate Website presented fewer than ten information categories, whilst another included more than thirty. In view of the wide range observed, we decided to perform a more fine-grained analysis of the relationship between the degrees of Internet corporate/financial reporting and the size, revenue and stock trading activity of the firm.
We plotted the scatter diagrams for each of the values of CI and FI of Web-present firms against each of their corresponding values of MC, NP and ST in 2004 and 2007, respectively. In total, there are 2 × 3 × 2 = 12 scatter diagrams. The patterns of data point distributions are amazingly similar across all the scatter diagrams. The consistency of the data point distribution patterns enhances the validity of our findings. Limited by the space of this paper, we include only the four scatter diagrams related to the variable MC in Figures 2 to 5.
Figures 2 and 3 show the scatter diagrams of CI against MC for all Web-present firms in 2004 and 2007, respectively. It is quite clear that the data points do not exhibit a visually linear relationship. Hence, the hypotheses H4b [size![]() degree of Internet corporate reporting], H5b [revenue
degree of Internet corporate reporting], H5b [revenue![]() degree of Internet corporate reporting] and H6b [stock trading activity
degree of Internet corporate reporting] and H6b [stock trading activity![]() degree of Internet corporate reporting] are rejected because of the lack of linear correlation between the variables in each hypothesis.
degree of Internet corporate reporting] are rejected because of the lack of linear correlation between the variables in each hypothesis.
There is however a very interesting phenomenon here. Both Figures 2 and 3 show that most data points cluster in the top-left regions and very few appear in the bottom-right. To further investigate this distinctive distribution pattern and to refine and quantify our observations, we drew a horizontal line and a vertical line in each figure, corresponding to the mean values of CI and MC, respectively. The two lines divide each graph into four areas: area 1 (top-left), area 2 (top-right), area 3 (bottom-left) and area 4 (bottom-right). Points are separated in these four areas according to whether the firms represented by the points have above or below average values of CI and MC. The percentages of data points in these four areas are shown in Tables 9 and 10.
| Percentages of data points (see Figure 2) | |||
|---|---|---|---|
| Below-average MC | Above-average MC | Total | |
| Above-average CI | (Area 1, top-left) 59.2% | (Area 2, top-right) 16.2% | (Areas 1 and 2, top) 75.4% |
| Below-average CI | (Area 3, bottom-left) 24.0% | (Area 4, bottom-right) 0.6% | (Areas 3 and 4, bottom) 24.6% |
| Total | (Areas 1 and 3, left) 83.2% | (Areas 2 and 4, right) 16.8% | (All areas) 100.0% |
| Percentages of data points (see Figure3) | |||
|---|---|---|---|
| Below-average MC | Above-average MC | Total | |
| Above-average CI | (Area 1, top-left) 49.7% | (Area2, top-right) 18.1% | (Areas1 and2, top) 67.8% |
| Below-average CI | (Area 3, bottom-left) 30.6% | (Area 4, bottom-right) 1.6% | (Areas3 and4, bottom) 32.2% |
| Total | (Areas 1 and 3, left) 80.3% | (Areas 2 and 4, right) 19.7% | (All areas) 100.0% |
Since the patterns of data point distributions are very similar across all scatter diagrams, we use Figure 3 as an example to elaborate our observations, while also referring to the percentages of data points in each area as shown in Table 10.
Figures 4 and 5 show the corresponding scatter diagrams of FI against MC in 2004 and 2007 respectively. The above observations also apply to Figures 2, 4 and 5, with appropriate adaptations, such as 2004 instead of 2007 for Figure 2, and FI in place of CI for Figures 4 and 5. Indeed, these observations are also applicable to scatter diagrams (not shown in this paper) involving NP and ST, since all the data point distribution patterns are essentially the same.
Finally, we considered the experience of adopting Internet corporate/financial reporting of firms. 122 Web-present firms appear in both the 2004 and 2007 data sets. According to our classification scheme, the 122 Web-present firms in the 2004 data set (Group-1 firms) were less experienced adopters of Internet corporate reporting than the same firms in 2007 (Group-2 firms). Table 11 shows the mean, median and standard deviation values of CI and FI for both groups of firms and the corresponding computed Wilcoxon signed-rank test statistics. Both the mean and median values of CI and FI for less experienced adopters of Internet corporate reporting are correspondingly smaller than those for more experienced adopters. These differences are highly significant (p-value <0.001* and = 0.002*, respectively). Thus, Table 11 provides strong statistical support for H7 [experience of adoption![]() degree of Internet corporate reporting].
degree of Internet corporate reporting].
| Number of online corporate information categories (CI) | Number of online financial information categories (FI) | |||||
|---|---|---|---|---|---|---|
| Mean | Median | Standard deviation |
Mean | Median | Standard deviation |
|
| Group-1 firms (less experienced adopters) | 28.3 | 29 | 4.7 | 11.6 | 12 | 2.3 |
| Group-2 firms (more experienced adopters) | 29.6 | 30 | 3.0 | 12.1 | 13 | 1.5 |
| Wilcoxon signed-rank test statistic, W | 2496 (p-value <0.001*) |
605 (p-value = 0.002*) |
||||
The results for H1, H2a, H2b and H7 are not surprising, as these hypotheses were all motivated by the diffusion of innovation theory, expectation-confirmation theory, corporate governance theories and learning or experience curve theories, and furthermore statistically supported by the respective data. Thus, our discussion here focuses more on the other hypotheses.
Consider H3a [system openness![]() Web presence] and H3b [system openness
Web presence] and H3b [system openness![]() degree of Internet corporate reporting]. Both hypotheses fail to be supported by the data (see Tables 6 and 7). Apart from the possibility of unavoidable statistical Type I or Type II errors, one straightforward interpretation is that, contrary to the relevant theories, system openness actually does not have significant influence on whether a firm adopts Internet corporate reporting. On the other hand, it might also be because, in reality, whether or not a firm fulfils more than the minimum statutory requirements for non-executive directors is not a good enough proxy for its level of system openness. A plausible explanation is that, when a listed firm appoints an external person as a non-executive director, that person is already likely to be known by (and possibly has a good relationship with) other directors of the firm. In other words, non-executive directors may not be truly or totally independent after all. It is thus not entirely surprising that hypothesis testing involving the number of non-executive directors does not yield meaningful or expected statistical results.
degree of Internet corporate reporting]. Both hypotheses fail to be supported by the data (see Tables 6 and 7). Apart from the possibility of unavoidable statistical Type I or Type II errors, one straightforward interpretation is that, contrary to the relevant theories, system openness actually does not have significant influence on whether a firm adopts Internet corporate reporting. On the other hand, it might also be because, in reality, whether or not a firm fulfils more than the minimum statutory requirements for non-executive directors is not a good enough proxy for its level of system openness. A plausible explanation is that, when a listed firm appoints an external person as a non-executive director, that person is already likely to be known by (and possibly has a good relationship with) other directors of the firm. In other words, non-executive directors may not be truly or totally independent after all. It is thus not entirely surprising that hypothesis testing involving the number of non-executive directors does not yield meaningful or expected statistical results.
Next we considered H4a [size![]() Web presence], H4b [size
Web presence], H4b [size![]() degree of Internet corporate reporting], H5a [revenue
degree of Internet corporate reporting], H5a [revenue![]() Web presence], H5b [revenue
Web presence], H5b [revenue![]() degree of Internet corporate reporting], H6a [stock trading activity
degree of Internet corporate reporting], H6a [stock trading activity![]() Web presence] and H6b [stock trading activity
Web presence] and H6b [stock trading activity![]() degree of Internet corporate reporting]. We obtained mixed results for these hypotheses. Regarding Web presence (H4a, H5a and H6a), in both 2004 and 2007, with no exception, firms which adopt Internet corporate/financial reporting have larger median values of MC, NP and ST than those which do not (see Table 8). Mann-Whitney U tests show that all such differences were significant in 2004 but not in 2007. In other words, H4a, H5a and H6a are supported by data in 2004 but not in 2007. On one hand, the 2004 data clearly verify that a firm's size, revenue and stock trading activity did have a significant effect on the degree of Internet corporate reporting as proposed. On the other hand, the 2007 data reveal somewhat different results. This posteriori finding itself is significant in research value, since it suggests that the traditional theories reviewed in our earlier paper (Poon and Yu 2012) may need to be reconsidered in light of the new observed trend when applied to the context of Internet corporate reporting. In this regard, our empirical results will help inspire renewed interests and advances in the respective theories.
degree of Internet corporate reporting]. We obtained mixed results for these hypotheses. Regarding Web presence (H4a, H5a and H6a), in both 2004 and 2007, with no exception, firms which adopt Internet corporate/financial reporting have larger median values of MC, NP and ST than those which do not (see Table 8). Mann-Whitney U tests show that all such differences were significant in 2004 but not in 2007. In other words, H4a, H5a and H6a are supported by data in 2004 but not in 2007. On one hand, the 2004 data clearly verify that a firm's size, revenue and stock trading activity did have a significant effect on the degree of Internet corporate reporting as proposed. On the other hand, the 2007 data reveal somewhat different results. This posteriori finding itself is significant in research value, since it suggests that the traditional theories reviewed in our earlier paper (Poon and Yu 2012) may need to be reconsidered in light of the new observed trend when applied to the context of Internet corporate reporting. In this regard, our empirical results will help inspire renewed interests and advances in the respective theories.
Regarding the testing of H4b, H5b and H6b, we did not find a linear relationship between the values of MC/NP/ST and the degrees of Internet corporate/financial reporting. Instead, our analyses of the scatter diagrams (see Figures 2 to 5) revealed that the majority of Web-present firms, regardless of their size, revenue and stock trading activity, exhibited above-average degrees of Internet corporate and financial reporting.
The results of H4a, H4b, H5a, H5b, H6a and H6b provide a clear insight into the state of Internet corporate reporting in 2004, when such reporting was less popular than in 2007. Larger firms with higher revenues and stock trading activities are typically more innovative, have more financial resources and greater access to technical knowledge and expertise to adopt Internet corporate reporting. Thus, size, revenue and stock trading activity were some of the key indicators of whether a firm had implemented Internet corporate reporting (that is, was Web-present) in 2004. By 2007, almost all Web-present firms (including the smaller firms) exhibited a high degree of Internet corporate reporting. As the popularity of Internet corporate reporting grew, the size, revenue and stock trading activity of a firm were no longer key indicators of adopting such a reporting practice. This change from 2004 to 2007, together with our positive test results of H1 [degree of Internet corporate reporting] and H7 [experience of adoption![]() degree of Internet corporate reporting], suggest that Internet corporate reporting has become not just a nice-to-have option, but rather an essential and affordable corporate strategy that could be implemented across all firms.
degree of Internet corporate reporting], suggest that Internet corporate reporting has become not just a nice-to-have option, but rather an essential and affordable corporate strategy that could be implemented across all firms.
In principle, firms could have made changes to their Web content whilst our data were being collected. To reduce this potential threat of data validity, we have made our best effort to shorten the time taken for collecting the data from the large number of firms involved.
Strictly speaking, our measurement by counting the online corporate information categories in Table 1 addresses the variety (that is, different types) rather than the amount of online corporate information (though we use both terms interchangeably in the paper). Nevertheless, we focused on the variety of online corporate information categories for two reasons. First, investors are keen to obtain and analyse different types of corporate information before making their investment decisions. Secondly, there is no simple yet meaningful and practical measurement to quantify the amount of a particular type of corporate information. For example, it is not meaningful to measure the information by the number of words. To some extent, the variety of online corporate information categories reflects the richness of the contents of the corporate Websites.
One may argue that, in addition to the six factors in Figure 1, other factors, such as a firm's transparency and management curriculum, may have an influence on the degree of Internet corporate reporting. Our six factors, however, are largely external, that is, the relevant information is publicly available and quantitatively measurable. By contrast, factors such as a firm's transparency and management curriculum, are mostly related to information that is internal to a firm and, hence, is often hard to access externally or quantify meaningfully. A study of these internal factors should probably be done by collaborative and in-depth qualitative analyses with the subject firms, which belongs to a different research paradigm, and has to be left to further work. Instead, this paper focused on the study of the statistical relations between a firm's attributes or factors and the degree of its Internet corporate reporting.
As pointed out in the previous Subsection, Implications, following the growth of Internet corporate reporting, the size, revenue and stock trading activity of a firm were no longer key indicators of its adoption of such a reporting practice. Follow-up research could investigate whether the prevalence of Internet corporate reporting in 2007 had dwarfed the factors of the size, revenue and stock trading activity of a firm that were significant in 2004.
This paper reports research on the common practice of adopting Internet corporate reporting. In particular, it investigates the relationship between certain characteristics of firms and the corporate information content of their Websites.
Our work focused on the richness of the content of the corporate Websites. We are aware, however, that a corporate Website should not only be rich in content, but also facilitate online visitors to locate the corporate information they require. To achieve this objective, online corporate information should be logically organised and incorporated into well-structured Web pages, and navigation of related online information should be made easy (Poon and Lau 2006). Furthermore, the format of presentation should also be considered (Poon et al. 2003; Wong and Poon 2008). For example, instead of simply presenting financial data on the corporate Website, such data could be provided in the form of an electronic spreadsheet so that potential investors may download the data from the Website for detailed study and offline analysis. From an investor's point of view, financial data disseminated in a form that facilitates further processing would be much more useful. Further studies should take these considerations into account.
Finally, the empirical study reported in this paper shows how the research framework and its associated research questions/hypotheses developed in our earlier paper (Poon and Yu 2012) can be adapted to study the adoption of Internet corporate reporting in a local context.
We thank F.F. Chan and T.H. Ng for their assistance in compiling the data and performing the statistical tests for this paper. We also thank all those people who have helped review and edit this paper.
Pak-Lok Poon is an Associate Professor in the School of Accounting and Finance, The Hong Kong Polytechnic University, Hong Kong. He received his Master of Business (Information Technology) from Royal Melbourne Institute of Technology, Australia and his PhD in software engineering from The University of Melbourne, Australia. He can be contacted at: afplpoon@inet.polyu.edu.hk .
Yuen Tak Yu is an Associate Professor in the Department of Computer Science, City University of Hong Kong, Hong Kong. He received his Bachelor's degree in Mathematics from The University of Hong Kong, Hong Kong and his PhD in software engineering from The University of Melbourne, Australia. He can be contacted at: csytyu@cityu.edu.hk.
| Find other papers on this subject | ||
© the authors, 2012. Last updated: 12 February, 2012 |
|
