Proceedings of the Eighth International Conference on Conceptions of Library and Information Science, Copenhagen, Denmark, 19-22 August, 2013
Social tagging in a scholarly digital library environment: users' perspectives
A. Noorhidawati, N. Fariza Hanum and N. Zohoorian-Fooladi
Digital Library Research Group, Faculty of Computer Science & Information Technology, University of Malaya, Kuala Lumpur, Malaysia
Introduction
Social tagging services such as Delicious, CiteUlike and PennTag offer an alternative mechanism for resource discovery and browsing of digital resources (e.g. website, scholarly papers) through tags that were added by users. The tags also serve as ways for users to organize their information based on their own preference for future retrieval. However there are conflicting opinions that social tagging is too flexible and do not have enough control over the vocabulary (Lu, Park and Hu, 2010). This is often criticized for imprecise and ambiguously chosen keywords for tags when compared to conventional classification scheme used by professional indexers such as librarians or information specialist who manually categorize the resources. But with the advent of Internet which has radically increased the amount of information to the public, to continually manually categorizing resources by professional indexer is not only impractical but costly as well.
To add into that, in these recent years, many academic institutions have taken the initiatives to develop digital repositories or also known as digital libraries to preserve, publish and disseminate scholar communications (e.g. pre-print articles, thesis, dissertation and etc.). In order to make these resources freely and widely visible and available, many institutions opt to self-archiving their resources through open access initiatives. In self-archiving, the document producers or owners are responsible to deposit their resources and create metadata to describe the documents. This is important mainly for indexing and retrieval purposes. However, the keywords chosen for the metadata elements are inconsistent because the document producers/owners have little or no knowledge about indexing. As a result, it makes the retrieval process difficult. One possible solution is to incorporate social tagging tool into digital repositories/digital library to empower users to actively participate and contribute to its community by allowing them to freely attach their personal tags to the digital resources.
The research presented in this paper investigates the use of social tagging in a scholarly digital library environment named Theses@UMalaya, which serves as an institutional repository providing digital collection of thesis and dissertation belonging to or related with University of Malaya in Malaysia. Theses@UMalaya was developed using Dspace, a free open source software developed by Massachusetts Institute of Technology and Hewlett-Packard Laboratories in 2002. For the purpose of this study, social tagging facility was added to Theses@UMalaya and made available to users. This study is exploratory in nature with the main purpose of examining how users participate in social tagging activities in order to learn about their motivations, behaviour and practices. A better understanding of users’ knowledge, habits and interactions with the social tagging application can help to improve the design, development and eventually the usage of digital library.
This paper is organized as follows: the next attempts to shed light on the fundamental concepts of social tagging and related studies; this is followed by a brief discussion on the research objectives and methods, followed by a presentation of the results, a discussion of the findings, and finally, conclusions from the research and some proposals for future work.
Social tagging in libraries
Social tagging is a process of adding tags or keyword freely to online resources which is an important aspect of social bookmarking services that resulted in folksonomy. While taxonomy and ontology are classifications and naming conventions prepared by experts, folksonomies are result from individuals freely tagging resources available in the Internet. Social tagging, which is also known as collaborative tagging, social classification and social indexing is a process where users mark or annotate websites or digital objects they come across on the internet which they find useful. The main intention is to facilitate their access in the future by enabling them to search using the keywords they have tagged to the resource. By using social tagging, information can be categorized in ways that bring meaning to users. Users can “tag” or describe information using their own words as they see fit and meaningful to them. Although users tag an item with the intention of their own consumption, the result of the tagging produces collective intelligence as it is shared in Internet community (Anfinnsen, et al., 2011). Social tagging also allows individuals who have similar interest to connect with each other thus facilitating sharing of information. According to Marlow et al. (2006), in addition to the collection of information, the taggers develop social relationships among themselves which in itself is a useful discovery. The tags that are assigned to the online resources normally appear in a tag cloud, the high frequency of tag assigned is indicated by a bigger and darker font size.
With the emergence and popularity of Web 2.0 and social tagging applications, a number of libraries have integrated applications such as Delicious, LibraryThing, PennTag, and Connotea into their library environment (Allen and Winkler, 2006; Furner, 2007; TThomas, Caudle and Schmitz, 2009; Lawson, 2009; and Anfinnsen, Ghinea and Cesare, 2011). Librarians believed that social tagging applications which produce folksonomies could help library users to catalogue or tag the resources they use in their own way, and furthermore, share the information by inviting others to view, comment, rate and give feedback (Ram and Kataria, 2011). Mathes (2004) also mentioned that folksonomies can facilitate and improve controlled vocabularies in subject headings by adding free tags or keywords to describe resources that are more meaningful to them. Pikic and Mucnjak (2010) described the usefulness of social tagging since it can categorize and store information such as images, bibliographic records, and pdf files from library catalogue in anyways which suit them best. Kapucu, Hoeppner and Dunlop (2008) discussed about social tagging challenges and compensationit returned to library. Social tagging tools offer users with a new way to organize and share information using folksonomies by freely adding tags to it. However, library would in some way lose authority control as the tags are assigned using users’ natural language and not using control vocabulary in a normal cataloging scheme. Nevertheless this drawback is compensated in that library could learn about information seeking behaviour of the users by observing how they categorize the information. Refthlefsen (2007) echoed “now social bookmarking and tagging tools help librarians to bridge the gap between the library’s need to offer authoritative, well-organized information and their patrons’ Web experience.”
A number ofempirical studies have reported on experiences using social tagging tools in libraries. For example, University of Pennsylvania who implemented PennTag allows users to tag their library OPAC. PennTag enabled members of the university’s community to not only tag but also comment on resources in the library’s online catalog (Allen and Winkler, 2006). Other software similar to PennTag are Social Online Public Access Catalog (SOPAC), and LibraryThing. SOPAC is developed by Ann Arbor District Library (AADL) which allows library users to assign tags to individual library resources, or to write review or comment andto view the list of the most popular and recent tags (Furner, 2007). LibraryThing (www.librarything.com) on the other hand is a cataloguing and social networking site for book enthusiast where they can tag, rate and review books. In 2007, Wenzler (2007) reported an initiative taken by Danbury library that added LibraryThings widgets into their library catalogs. A few other studies later are conducted to compare LibraryThings with other subject heading classification scheme such as Lawson (2009) who analysed Amazon and LibraryThings tags, Thomas, Caudle and Schmitz (2009) who compared the tags in LibraryThing books and LC subject headings. Most recently Voorbij (2012) examined whether or not books drawn from LibraryThing carry tags.
Succinctly, libraries are taking advantage of social tagging tools and folksonomies into their OPAC to become collaborative and interactive. However, it is evident from the literature that social tagging has not yet become prevalent in digital libraries environment or institutional repositories as apposed to tagging application in conventional library environment. Thus, for this particular reason this study is conducted to fill the gap.
Research objectives and method
This study is exploratory in nature which starts with an investigation on the use of social tagging application in a digital library as a means to improve document organization and retrieval of scholarly materials. The specific objectives of the study are:
- To investigate the usage of social tagging application in educational setting
- To investigate how the social tagging process is conducted by users
- To examine how usable the social tagging application is to users via Software Usability Measurement Inventory (Software Usability Measurement Inventory)
- To investigate whether the provided social tagging application allows users to carry out the tagging process with less effort by examining the principles of least effort
- To examine if any relationship exist between Software Usability Measurement Inventory and principle of least effort constructs with regards to social tagging activities
This study was conducted in two phases;, the first phase is an exploratory survey to investigate participants’usage and attitudes towards social tagging application that essentially has addressed the first research objective. The survey consisted of 14 questionnaires which focuses on: examining social tagging usage and non-usage in academic setting; frequency of use; types of social tagging system they have used or heard before; the purpose of usage or intention to use; and reasons for non-usage.The survey ends with an open ended question asking participants to give comments on social tagging application or practices. The participants then were asked to include their contact if they would like to participate in the next phase. The survey was distributed to graduate students in a computer science faculty using printed and online survey form for the duration of one month from July to August 2012. A total of 37 responses were gathered out of 160 respondents giving a 23% response rate. Out of this, 33 participants agreed to participate in the next phase.
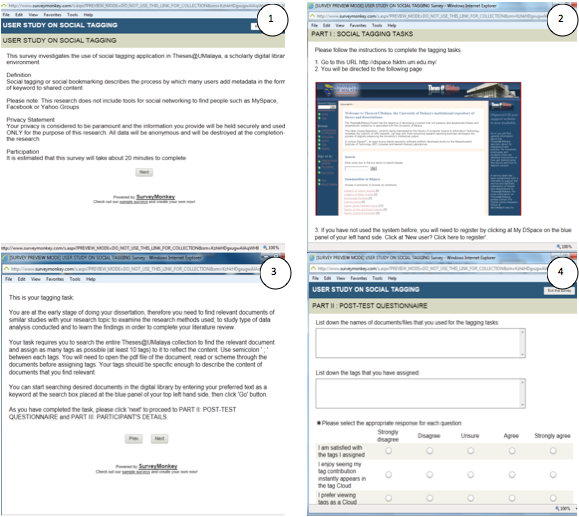
The second phase required participants to carry out a task-based user study on social tagging process. This is then followed by a post-task questionnaire and interview. The user study process is carried out at a computer lab in the computer science faculty where a short introduction to the social tagging application was given to the participants. The participants were given 15-20 minutes to familiarize themselves with the social tagging application that was embedded in a digital library of thesis (Theses@UMalaya, available at http://dspace.fsktm.um.edu.my/) after which they were asked to carry out a tagging task. Participants were given a scenario and tagging tasks to be completed as shown in Figure 1.
After completing the user study, participants were invited to complete an online post-task questionnaire to evaluate how usable and easy the social tagging application is to them. For the purpose of this evaluation, Software Usability Measurement Inventory (Software Usability Measurement Inventory) is adopted. The reason Software Usability Measurement Inventory is chosen as the underlying model is because it not only measures the quality of the tagging application from the users’ point of view (Kirakowski, 1993), but it also measures how user feels about the application (Bevan and Curson, 1997). In addition to Software Usability Measurement Inventory, the social tagging application was also evaluated via the Principle of Least Effort (principle of least effort). Literature has shown that human tend to choose the path of least resistance or effort when carrying out tasks, and therefore, the social tagging system was evaluated to assess if it exhibits this principle.
The post-task questionnaire consists of 17 questions adopted from Software Usability Measurement Inventory to measure the following 5 constructs: Affect, Learnability, Efficiency, Helpfulness, and Control of the social tagging application. The other 15 questions look at the 5 construct of principle of least effort; Convenience, Accessibility/Availability, Ease of Use, Saving of Time, Familiarity. A five point Likert scale (1=Strongly Disagree, 2=Disagree, 3=Neutral, 4=Agree, 5=Strongly Agree) is used to indicate participants’ agreement or disagreement of both Software Usability Measurement Inventory and principle of least effort constructs. Table 1 and Table 2 list the definition of each construct used in the questionnaire and the corresponding question numbers for Software Usability Measurement Inventory and principle of least effort respectively.
| Construct | Definition | Questions |
|---|---|---|
| Affect | The participant’s feelings about using the system (Oulanov and Pajarillo, 2001) | 1 to 4 |
| Efficiency | The degree to which the system is able to achieve its goals and tasks (Oulanov and Pajarillo, 2001) | 5 to 8 |
| Helpfulness | The feeling by the user that the program can assist in resolving system problems or difficulties (Oulanov and Pajarillo, 2001) | 9 to 10 |
| Control | The feeling by the user that he is in control of the software, as opposed to being controlled (Claridge et al., 1998) | 11 to 13 |
| Learnability | The degree to which the user can learn and use the system (Oulanov and Pajarillo, 2001) | 14 to 16 |
| Construct | Definition | Questions |
|---|---|---|
| Convenience | Able to proceed with information system with little effort (Connaway et al., 2011) | 17 to 20 |
| Accessibility / Availability | Information is at hand when needed. Aparticular source available at a particular time (Fidel and Green, 2004) | 21 to 24 |
| Ease of Use | Can be used without having to overcome a steep learning curve. Friendly and easy to use interface (Bronstein, 2010) | 25 to 27 |
| Saving time | Able to perform a task in a shorter time (Fidel and Green, 2004) | 28 to 29 |
| Familiarity | User have previous knowledge or experience with the items (Pu and Chen, 2010) | 30 to 31 |
A total of thirty-three participants participated in the task-based user study, and eighteen of them volunteered to take part in the following interview sessions. The interview session was carried out to gather in-depth understanding on how social tagging process is conducted by participants, and lasted for about fifteen minutes each. The second phase of this study has essentially addressed the second, third and fourth research objectives.
Responses to the survey and post-task questionnaires were analysed quantitatively using SPSS and were supported by participants’ responses to open ended questions which were coded as C1-C37 and T1-T33 respectively. Responses from the interview on the other hand were analysed to bring together the emerging themes and the responses were coded as N1-N18.
Results
The usage of social tagging application in educational settings
The survey was conducted for the duration of one month in July 2012. A total of 37 responses were gathered with 68% (25) of female and the remaining 32% (12) were male. Out of the total responses, a majority of the participants have not used social tagging with 57% (21) and only 43% (16) of them have used it before.
Participants who have used social tagging or bookmarking software before (N=16) indicated that they do not remember how frequent they use it, often indicated as rarely, and depends on the needs(24%).When asked about which social tagging or bookmarking software they have used, the participants indicated that they have used CiteULike most (27.0%), followed by Del.icio.us (21.6%).
Have Not Used Social Tagging/Bookmarking Before (N=16)
The survey demonstrated that participants used social tagging application for different purposes as shown in Table 3. The highest response indicated by participants in using the social tagging software is to share information with others (20%). However, the most responses (35%) indicated that other purposes are also evident and one such example is using it in Facebook. The survey also revealed that participants preferred to use personal tags as the 1st rank, followed by content-based tags, and tags to indicate ownership. Table 4 shows how the participants become interested in using social tagging. The participants indicated that they come to know about social tagging application through reading (18%), self-taught (16%), and from colleagues (16%). The highest percentage (52%) however was indicated by “do not remember”.
| Purpose of using social tagging application | Responses (n) | Responses(%) |
|---|---|---|
| To share information with others | 12 | 20% |
| Describe the resources to add value | 6 | 10% |
| Future retrieval | 6 | 10% |
| Task organization | 5 | 8% |
| Document organization | 4 | 7% |
| Refine the resources category | 3 | 5% |
| Technological ease | 3 | 5% |
| Other | 21 | 35% |
| Total Responses | 60 | 10% |
| Note: Participants could select more than one option | ||
| How did you first become interested in using social tagging? | Responses (n) | Responses (%) |
|---|---|---|
| Colleagues | 6 | 14% |
| Self-taught | 7 | 16% |
| Reading (books, journals, online etc.) | 8 | 18% |
| Other (do not remember) | 23 | 52% |
| Total | 44 | 100% |
| Note: Participants could select more than one option | ||
Have not used social tagging or bookmarking before (N=21)
Participants who have not used social tagging or bookmarking software before (N=21) indicated that the main reason of not using it was because they were not aware of their availability and there was no need to use them as demonstrated by 10% respectively as shown in Table 5. Table 6 on the other hand demonstrates for what purpose the participants might use social tagging in the future. The highest reason was for sharing information (12%) followed by for future retrieval (10%).
| Reason for Not Using Social Tagging | Responses (n) | Responses (%) |
|---|---|---|
| Not aware of their availability | 10 | 24% |
| There is no need | 10 | 24% |
| Takes time to get familiar with the technology | 6 | 14% |
| Others | 16 | 38% |
| Total | 42 | 100% |
| Note: Participants could select more than one option | ||
| Intention to use social tagging in the future | Responses (n) | Responses (%) |
|---|---|---|
| To share information with others | 12 | 19% |
| Future retrieval | 10 | 16% |
| Document organization | 7 | 11% |
| Task organization | 5 | 8% |
| Describe the resources to add value | 4 | 6% |
| Refine the resources category | 4 | 6% |
| Technological ease | 4 | 6% |
| Other | 16 | 26% |
| Total Responses | 62 | 100% |
| Note: Participants could select more than one option | ||
Table 7 lists participants’ comments on the social tagging practices in an open ended question. Most of the comments were indicated by not aware of social tagging application (5 responses) although the participants opined it is useful to them as demonstrated by 4 responses.
| Participants’ comments on social tagging application in educational setting | Participants |
|---|---|
| Not aware of social tagging application | C12, C13, C14, C25, C36 |
| Useful | C7, C22, C36, C37 |
| Save time | C37, C18 |
| Facilitate resource sharing | C6, C7 |
| Easy to use | C22, C37 |
| To get more information about social tagging application | C10, C14, C36 |
Investigation on how the social tagging process was conducted by users
Interview sessions were carried out to gather in-depth understanding how social tagging process is conducted by participants. From a total of 18 participants interviewed, 15 (83%) of them have never done social tagging (or social bookmarking) in educational setting before although they have indicated of doing that in other social media websites such as on Facebook and Flickr (N2-N8, N11-N18). This is evident from some of the remarks: “I usually do tagging in Facebook only” (N3); “I use Facebook to tag my friends” (N2). The reason of not using tagging in educacational setting was mainly because they were not aware of such applications as indicated by 14 (78%) participants (N1, N2,N4, N6-N8, N10-N13, N15-N18). Participants also indicated that it took time for them to learn new technology.
When asked on how they carry out the tagging process, the participants generally use keyword they think most closely related to describe the documents they read to become the tag as indicated by 10 (55%) participants (N2, N3, N6, N8-N10, N12,N13, N15, N18). However one participant mentioned to use using numbers to tag documents (N10) and use type of documents e.g. journal (N4) as a tag. According to the participants, the chosen words for the tagging are mainly from the documents content (6 participants, 33%) ,title (5 participants, 28%), or abstract (3 participants, 17%). Conversely it was interesting to note that one of the participants actually chose word that is not in the title and not among the document keyword as the tag “…. as I was reading the abstract, the research was about exploring users expectations, and ‘user expectation’ was not in the title and was not among the assigned keywords. That’s why I use it” (N4).
Seven participants (39%) indicated that the social tagging application was easy to use (N2, N3, N6, N9, N10, N11, N12). In addition to that 9 participants (50%) of them opined that the application was useful for future retrieval, sharing information and quick access (N1, N5, N8, N10, N11, N12, N17). Some of the responses pointed out that:
It's good in helping us to categorise some documents (N8)
I can read other relevant documents in the database by the same tags” (N9)
I believe it would be helpful if I’m using it from the beginning. If I’m reading it, all the theses, and then assign the tags, it will help me to find a particular thesis, for example I remember that I was reading something about this in the thesis, and then I forgot. If I see tags I can easily find it (N4)
It's quite easy to use tagging because it helps to speed up searching by looking at relevant documents to us. Not only to us but also documents used by others and what are the most frequently used too. So generally it helps a lot.” (N18)
Nevertheless, some participants pointed out that it was difficult to choose the right tag as indicated by N4, N6,and N7 who said “…. difficult to choose the right tags so that they are relevant and useful to you for future retrieval, however, you spend much time on choosing the right word alone (N7)”. N17 added difficulty to choose one single word as a tag as he/she said “It was slightly difficult to choose one word to describe one bib text”. Other than that participants were concerned that the tag would not be useful enough if it is similar to the document title or the assigned keyword for the document (N4), and the tags assigned might not be correct (N9).
After using the social tagging system, some of the participants suggested a few recommendations to improve the application such as to be able to organize the documents in folders (N1, N8) and be able to edit the tags (N9),They would like the application to give recommendation keyword as the tags (keyword that have been used previously) (N9, N16), auto-complete the spelling as they type-in the tags (N9), and to present the tags in hierarchy order (N9).
Examining the usability of the social tagging application
Usability of the social tagging application was evaluated based on 5 Software Usability Measurement Inventory construct. Table 11 lists the frequency percentage for each questionnaire item including both the positive and negative statements of the 5 construct. The negative questionnaires item are used to serve as a bias control for Software Usability Measurement Inventory constructs.The negative questionnaire or the reversal items are marked with “(**)” next to the question. For the reversal item questions, the response value is reversed before it is included into the table to calculate the means of the relevant Software Usability Measurement Inventory construct. For example if the participant gave a 1, that score is reversed to be 5; if the given score is a 2, it is reversed to 4; 3 = 3; 4 = 2; and, 5 = 1.The final score for each construct is the sum of the ratings for all the items for that particular construct.
As shown in Table 8, all of the Software Usability Measurement Inventory items statements result in a value above 3 point of Likert scale, and the highest frequency of each item were generally on the 4=Agree scale except for item number 4 “I don’t understand why I should use my time on adding tags (**)” where there were equal percentage (21.1%) for 2=Disagree, 3=Undecided and 4=Agree. The mean value however indicated towards a positive response which is M= 3.5.The usability of the social tagging application is evident from Software Usability Measurement Inventory overall mean value for each of the constructs where the highest mean value was for Efficiency (M=4.0), followed by Control (M=3.9), Affect (M=3.8), Helpfulness (M=3.8),and Learnability (M=3.7).
| Affect | Strongly disagree | Disagree | Undecided | Agree | Strongly agree | Mean | |
|---|---|---|---|---|---|---|---|
| 1 | I am satisfied with the tags I assigned | 0% (0) | 3.03% (1) | 18.2%(6) | 51.5% (17) | 27.3% (9) | 4.0 |
| 2 | I enjoy seeing my tag contribution instantly appear in the tag Cloud | 0% (0) | 3.03% (1) | 18.2%(6) | 54.6% (18) | 24.2%(8) | 4.0 |
| 3 | I prefer viewing tags as a cloud | 0% (0) | 0% (0) | 39.4% (13) | 42.4%(14) | 18.2%(6) | 3.8 |
| 4 | I don’t understand why I should use my time on adding tags (**) | 0% (0) | 21.2%(7) | 21.2%(7) | 21.2%(7) | 18.2%(6) | 3.5 |
| Average for affect | 3.8 | ||||||
| Efficiency | Strongly disagree | Disagree | Undecided | Agree | Strongly agree | Mean | |
| 5 | Tags would help me to find material easier in the future | 0% (0) | 3.03%(1) | 3.03%(1) | 60.6%(20) | 33.3%(11) | 4.2 |
| 6 | Tags is a good way to keep track of my literature | 0% (0) | 3.03%(1) | 6.06%(2) | 63.6%(21) | 27.3% (9) | 4.2 |
| 7 | The tagging application improves user experience with the system | 0% (0) | 6.06%(2) | 18.2%(6) | 54.6% (18) | 21.2%(7) | 3.9 |
| 8 | The tagging process can be performed in a straightforward manner using this system | 3.03%(1) | 3.03%(1) | 24.2%(8) | 48.5%(16) | 21.2%(7) | 3.8 |
| Average for efficiency | 4.0 | ||||||
| Helpfulness | Strongly disagree | Disagree | Undecided | Agree | Strongly agree | Mean | |
| 9 | The word in the tag Cloud is helpful in assisting me to choose a specific tag to describe a document | 6.06%(2) | 0% (0) | 15.2%(5) | 57.6%(19) | 21.2%(7) | 3.9 |
| 10 | The organization of the tag Cloud seem quite logical | 6.06% (2) | 3.03% (1) | 15.2%(5) | 63.6% (21) | 12.1% (4) | 3.7 |
| Average for helpfulness | 3.8 | ||||||
| Control | Strongly disagree | Disagree | Undecided | Agree | Strongly agree | Mean | |
| 11 | I am certain that the tags I assigned are correct | 0% (0) | 3.03% (1) | 36.4%(12) | 42.4%(14) | 18.2%(6) | 3.8 |
| 12 | I have concern about users adding tags that are not relevant | 0% (0) | 0% (0) | 21.2%(7) | 57.6%(19) | 21.2%(7) | 4.0 |
| 13 | I feel more confident when knowing which user (students or staff) has added the tags when I browse | 0% (0) | 3.03% (1) | 24.2%(8) | 48.5%(16) | 24.2%(8) | 3.9 |
| Average for control | 3.9 | ||||||
| Learnability | Strongly disagree | Disagree | Undecided | Agree | Strongly agree | Mean | |
| 14 | It takes too long to learn on how to assign tags to the documents(**) | 0% (0) | 21.2%(7) | 18.2%(6) | 48.5%(16) | 12.1%(4) | 3.5 |
| 15 | I can easily remember the step to assign tags to the documents | 3.03% (1) | 3.03% (1) | 3.03% (1) | 60.6%(20) | 30.3%(10) | 4.1 |
| 16 | I have no idea how to use the tag Cloud to find relevant document in the system (instead of using browse and search facilities)(**) | 3.03% (1) | 27.3%(9) | 18.2%(6) | 33.3%(11) | 18.2%(6) | 3.4 |
| Average for learnability | 3.7 | ||||||
| (**) Denotes a reversed question | |||||||
Examining if users are able to use the social tagging system with less effort
The social tagging application was also examined to find out whether it provides the users with the ability to carry out the tagging process with less effort. This is done based on 5 constructs of principle of least effort as shown in Table 9. The negative questionnaires statements or reversal items were treated the same as stated above and the response value is reversed before it is included into the table. Table 9 demonstrates that all of the principle of least effort items statements result in average value above 3 point of Likert scale, and the highest frequency of each item were generally on the 4=Agree scale except for two reversal items:
Item no. 17. “I find it difficult to describe documents using only a single word (**)” with the highest percentage of 36.4% for 2=Disagree (after the item was reversed) which means that participants actually agree with this statement.
Item no. 29. “It takes more time to decide a suitable tag to describe the content of a document (**)”with the highest percentage of 39.4% for 2=Disagree (after the item was reversed) which means that participants actually agree with this statement.
The mean value for both the items mentioned above demonstrated towards a negative response (below 3 point Likert Scale) with the average of M=2.9 and M=2.6 respective. This indicates that the participants were not positive towards these two particular statements.
However, the social tagging application has generally exhibit the use of principle of least effort and it is evident from the overall mean value for each of the constructs where the highest mean value was for Accessibility/Availability (M=3.8), followed by Ease of Use (M=3.7), Familiarity (M=3.6), Convenience (M=3.3),and Saving of Time (M=3.2).
| Convenience | Strongly disagree | Disagree | Undecided | Agree | Strongly agree | Mean | |
|---|---|---|---|---|---|---|---|
| 17 | I find it difficult to describe documents using only a single word (**) | 9.1%(3) | 36.4%(12) | 12.1%(4) | 33.3%(11) | 9.1%(3) | 2.9 |
| 18 | I can effortlessly add tags to the documents | 3.03%(1) | 12.1%(4) | 30.3%(10) | 48.5%(16) | 6.1% (9) | 3.4 |
| 19 | The tags provides me with additional information about the content of the collection | 3.03% (1) | 12.1%(4) | 18.2%(6) | 45.5% (15) | 21.2%(7) | 3.7 |
| 20 | It is easy to decide what tags to use | 3.03%(1) | 30.3%(10) | 15.2%(5) | 45.5%(15) | 6.1%(2) | 3.2 |
| Average for convenience | 3.3 | ||||||
| Accessibility or availability | Strongly disagree | Disagree | Undecided | Agree | Strongly agree | Mean | |
| 21 | When referring to the tags cloud , I can find information that I need when I need it | 0% (0) | 6.1% (2) | 27.3%(9) | 54.5%(18) | 12.1%(4) | 3.7 |
| 22 | I can share information with others by adding tags to the documents | 0% (0) | 6.1% (2) | 27.3%(9) | 54.5%(18) | 12.1%(4) | 3.7 |
| 23 | The organization of the tag cloud seem quite logical | 0% (0) | 0% (0) | 21.2%(7) | 63.6%(21) | 15.2% (5) | 3.9 |
| Average for accessibility or availability | 3.8 | ||||||
| Ease of use | Strongly disagree | Disagree | Undecided | Agree | Strongly agree | Mean | |
| 24 | It easy to navigate the system using the tags cloud to find what is needed | 0% (0) | 6.1%(2) | 33.3%(11) | 48.5%(16) | 12.2%(4) | 3.6 |
| 25 | I have to look for assistance most of the times when I use this tagging system (**) | 3.03% (1) | 9.1%(3) | 15.2%(5) | 54.4%(18) | 18.2%(6) | 3.7 |
| 26 | It is easier for me to re-use existing tags to describe a document | 3.03%(1) | 3.03%(1) | 15.2%(5) | 66.7%(22) | 12.1%(4) | 3.8 |
| Average for ease of use | 3.6 | ||||||
| Saving time | Strongly disagree | Disagree | Undecided | Agree | Strongly agree | Mean | |
| 27 | It takes more time to decide a suitable tag to describe the content of a document (**) | 0% (0) | 6.1%(2) | 30.3%(10) | 48.5%(16) | 15.2%(5) | 3.7 |
| 28 | It takes more time to decide a suitable tag to describe the content of a document (**) | 18.2% (6) | 39.4%(13) | 12.1%(4) | 24.2%(8) | 6.1%(2) | 2.6 |
| Average for saving time | 3.2 | ||||||
| Familiarity | Strongly disagree | Disagree | Undecided | Agree | Strongly agree | Mean | |
| 29 | I find the system is easy to understand because adheres to designs and concepts which are already familiar to me | 0% (0) | 9.1%(3) | 24.2%(8) | 54.5%(18) | 12.1%(4) | 3.7 |
| 30 | I prefer to stick to the facilities that I know best | 0% (0) | 15.2%(5) | 27.3%(9) | 45.5%(15) | 12.1%(4) | 3.6 |
| Average for familiarity | 3.6 | ||||||
| (**) Denotes a reversed question | |||||||
Examining if there is any relationship between Software Usability Measurement Inventory and principle of least effort constructs when users carry out the social tagging activities
In an attempt to find out if there is any relationship between the two constructs (Software Usability Measurement Inventory and principle of least effort) on the social tagging practices, a statistical analysis was carried out using Pearson correlation. Table 10 presents a matrix to show the correlation between the pairs of Software Usability Measurement Inventory and principle of least effort construct. The significant correlations are highlighted.
| Five principle of least effort constructs | Five Software Usability Measurement Inventory constructs | ||||
|---|---|---|---|---|---|
| Affect | Efficiency | Helpfulness | Control | Learnability | |
| Convenience | 0.582** | 0.465** | 0.333 | 0.293 | 0.333 |
| Accessibility or availability | 0.418* | 0.645** | 0.310 | 0.361* | 0.310 |
| Ease of use | 0.295 | 0.598** | 0.558** | 0.183 | 0.558** |
| Saving time | 0.457** | 0.293 | 0.125 | 0.445** | 0.125 |
| Familiarity | 0.445** | 0.387* | 0.513** | 0.487** | 0.513** |
| ** - correlation is significant at the 0.01 level (two-tailed) * - correlation is significant at the 0.05 level (two-tailed) | |||||
From the responses provided by the users who took part in the evaluation process, there is evidence to show a significant correlation between users’ perception of Affect and the five principle of least effort constructs (convenience, accessibility or availability, saving time, ease of use and familiarity). Efficiency was demonstrated to have a significant correlation with convenience, accessibility or availability and ease of use. While control has significant correlation with saving time and familiarity. Both helpfulness and learnability on the other hand have significant correlation between ease of use, and familiarity.
Discussion
This main purpose of this study is to investigate how users participate in social tagging activities in educational setting particularly in a scholarly digital environment in order to learn about their motivations, behaviour and practices using survey, task-based user study and interview. Thus, the following research objectives were developed to:
- investigate the usage of social tagging application in educational setting
- investigate how the social tagging process is conducted by users
- examine how usable is the social tagging application is to users via Software Usability Measurement Inventory (Software Usability Measurement Inventory)
- investigate whether the provided social tagging application allows users to carry out the tagging process with less effort by examining the Principles of Least Effort (principle of least effort)
- examine if there is any relationship exist between Software Usability Measurement Inventory and principle of least effort constructs with regards to social tagging activities
The first research objective was addressed using a survey questionnaire to investigate the usage of social tagging application. The survey demonstrated that out of a total of 37 responses, a majority of the participants (57%) have not used social tagging and only 43% of them have used it before. Those who have used social tagging before reported that they used CiteUlike most of the time followed by Del.icio.us. The indicated main purpose of using social tagging is for sharing information as shown by 20% of the responses. For participants that have not used social tagging before intended to use it in future for the same purpose which is for sharing information (19%). In addition, these participants also indicated the main reasons of not using the social tagging were because they were not aware of the application (10%) and feels that there was no need to use it (10%).
The task-based user study has essentially addressed the second, third, fourth and fifth research objectives. The social tagging application that was embedded in Thesis@Um digital library enabled users to gain first-hand experience of tagging in a scholarly digital library. The findings revealed that when carrying out the tagging process, the participants generally use keyword that they think most closely related to describe the documents they read to become the tag as indicated by 55% participants although some participants has mentioned the use of numbers to tag documents and the use of type of documents e.g. journal as a tag. According to the participants, the chosen words for the tagging are mainly from the documents’ content, title, and abstract.
In examining how usable the social tagging application is to users, a 5 constructs of Software Usability Measurement Inventory (Affect, Learnability, Efficiency, Helpfulness, and Control) were used. The other 5 constructs of principle of least effort (Convenience, Accessibility/Availability, saving time, Ease of Use and Familiarity) were used to investigate whether the social tagging application provides the users with the ability to carry out the tagging process with less effort. The findings in general revealed that participants found that the social tagging application was relatively more usable rather than providing the users with the ability to carry out the tagging process with less effort. This is evident when the mean between both Software Usability Measurement Inventory and principle of least effort constructs were compared as shown in Table 11. The 5 constructs of Software Usability Measurement Inventory demonstratedmean values that close to 4=Agree scale while only 3 constructs of principle of least effort (Accessibility/Availability, Ease of Use and Familiarity) reach the same scale.
| Software Usability Measurement Inventory | Efficiency | Control | Affect | Helpfulness | Learnability |
|---|---|---|---|---|---|
| Mean value | 4.0 | 3.9 | 3.8 | 3.8 | 3.7 |
| Principle of least effort | Accessibility or availability | Ease of use | Familiarity | Convenience | Saving of time |
| Mean value | 3.8 | 3.7 | 3.6 | 3.3 | 3.2 |
In addition, it is interesting to examine whether participants prior usage of social tagging application might have influenced their responses towards Software Usability Measurement Inventory and principle of least effort constructs. The t-test analysis was conducted to confirm that there is no significant correlation between the participants’ prior experience of using social tagging application with Software Usability Measurement Inventory or principle of least effort constructs.
The study also reported a significant correlation between several Software Usability Measurement Inventory and the principle of least effort constructs as shown in Table 10. Based on the correlation results, it is can be summarised that:
- Participants who are able to proceed with social tagging process in a convenient way, who find the tag available and accessible to them, and find that tags help them shorten their search, were satisfied and pleased in using the application.
- Participants who find the social tagging application efficient also find it convenience to use, and they agree that the tags are available and accessible to them, and easy to use.
- Participants who perceive the social tagging application as helpful and learnable also find the application easy to use, and has familiar features.
- Participants who feel in control (e.g. certain that the assigned tags are correct) with the social tagging system also feels that it has familiar features that can help them shorten their search (using the tags).
- Participants who feel that the social tagging application could enable the tagging process to be performed using less effort are inclined to perceive the application as being usable mainly based on affect (e.g. satisfaction with the tags assigned, pleased to see tags contribution in the clouds), efficiency (e.g. tags could aid future retrieval), helpfulness (e.g. the tag cloud is helpful to assist in choosing other tags, the logical organization of cloud) and learnability (e.g. being able to easily remember the steps when carrying out the tagging process).
Conclusion and future research
This study is motivated by the lack of literature reported on the use of social tagging tool in scholarly digital library as an institutional repository.It is exploratory in nature with the main purpose of examining how users participate in social tagging activities in order to learn about their motivations, behaviour and practices. In addition, this study examines the usability of the social tagging tool and to observe whether it provides users with the ability to carry out the tagging process with less effort. This is based on the premises that social tagging tool should be easy to use as the tagging process itself relies on user participations that is particularly important in self-archiving intuitional repository. For both social tagging and self-archiving tools, without user participations, the system most likely would fail to thrive. To conclude, a better understanding of social tagging usability and how users interact with the tool will help to improve development of digital library as institutional repository. This study however was limited by a small sample size and therefore the generalization of the findings should be treated with caution. Future research could be conducted to examine tags growth and reuse that might render in design implications to enhance the social tagging application.
Acknowledgements
This research was partially funded by the University of Malaya Research Grant (No: RG072-11ICT) under the project title “A model of personalized and collaborative scholarly digital library environment”.
About the authors
Dr. Noorhidawati Abdullah is currently a Senior Lecturer at Department of Library & Information Science in the Faculty of Computer Science & Information Technology, University of Malaya. She graduated with BIT (Science and Management System) in 2000 and MIT (Management of Information System) in 2003 both from National University of Malaysia. Dr. Noorhidawati obtained her PhD in 2008 from University of Strathclyde, Glasgow. Her research interests include digital library, information management, e-library, information seeking behaviour and social media. She can be contacted at noorhidawati@um.edu.my
Dr. Fariza Hanum Nasaruddin has worked in the industry as systems analyst for ten years before joining the academia in 1997. Dr. Fariza graduated with Bachelors of Science (Computer Science) and Masters of Science (MIS) from Northern Illniois University, USA, and later obtained her PhD from University of Malaya where she is currently serving at the Department of Information Systems. She became involved in multi disciplined research but her main focus are in databases, information systems, and e-learning.
Niusha Zohoorian-Fooladi is PhD student at the department of library & information science at the faculty of computer science and information technology, University of Malaya, Kuala Lumpur, Malaysia. She has diploma in information technology from University of Applied Science and Technology and graduated with BSc in library and information science from Allameh Tabtabaee University, Tehran, Iran, 2002. She obtained her MLIS degree in 2008 from Islamic Azad University and started her PhD in 2010. Her research interests include social media, Library 2.0; e-library and informetrics.