Network analysis of a virtual community of learning of economics educators
Elsa Fontainha,
ISEG Department of Economics, Universidade de Lisboa, Portugal
Jorge Tiago Martins and Ana Cristina Vasconcelos
Information School, The University of Sheffield, United Kingdom
Introduction
Communities of learning are defined as groups of individuals 'engaging in collaborative learning and reflective practice involved in transformative learning' (Paloff and Pratt, 2003:17). Online or virtual communities of learning, in particular, have received significant attention in the Information Science literature (e.g., Harlan et al., 2014; Battistella and Nonino, 2012; Miguel et al., 2012; Murillo, 2011 and Murillo 2008; Gannon-Leary and Fontainha, 2007; Ellis et al., 2004; Stacey et al., 2004).
The advantages of engaging in online collaborative learning have been thoroughly explored in the literature, in particular the ability to engage participants in learning processes beyond the constraints of time and space (Volet et al., 2009), and the richness of the discussion and interaction that leads to collaborative knowledge creation (Hakkarainen et al., 2004). The depth of cognitive communication and knowledge creation attained is variable, but online collaborative learning is acknowledged for giving participants an opportunity to reflect on what is being discussed (de Laat et al., 2006), whether this occurs at the more surface levels of emotional support (Admiraal et al., 1998) or at the level of advanced cognitive discussions (Järvelä and Häkkinen, 2002).
In an attempt to expand the scope of existent research in communities of learning - where significant effort has already been put into understanding critical success factors (Gannon-Leary and Fontainha, 2007), characteristics of online communities (Stacey et al., 2004) and design principles to create interactive online learning environments (Roblyer and Wiencke, 2003) - this paper aims to focus on the patterns of communication within virtual communities of learning and how they relate to community dynamics. In particular, we want to analyse a virtual community of learning related to the teaching of Economics in the context of higher education institutions. The impact of communication technologies /IT on Economics education has been the subject of study for some time (Grimes and Ray, 1993; Agarwal, 1998; Becker, 1997; Goffe and Sosin 2005). There are specific surveys focusing on the scholarship of teaching but not sufficient knowledge on the patterns of communication that can be observed within a community of learning entirely devoted to the discussion of Economics education.
Accordingly, the aim of this paper is to examine in detail the case of a virtual community of Economics educators (CoL01) using the digital archive of exchanged messages, and focusing on: community of learning's characteristics and dynamics, type of knowledge shared, community of learning's density, and centrality of participants.
The remainder of the paper is structured as follows. The next section provides a review of collaborative learning in communities of learning. The section on methodology provides an explanation of the quantitative methods employed to describe and interpret the characteristics and dynamics of communities of learning', namely statistical analysis and network analysis. Subsequently, the findings on the emergent patterns of communication within the main community of learning that was studied are presented and discussed against similar communities of learning within the same disciplinary domain. The paper closes with a summary of findings and with a reflection on the usefulness of digital discussion archives as a data source for the identification and understanding of the learning and teaching processes, and the creation and evolution of a community of learning.
2. Collaborative learning in communities of learning
According to Lave and Wenger (1991:29), who researched learning processes in the context of communities of practice, community based learning involves 'the process of becoming a full participant in a socio cultural practice'. In other words, newcomers and apprentices learn through shared practice with more experienced members of the community. Consequently, the shared and collective expertise of the participants is enhanced.
In this sense, communities of learning should foster a sense of connectedness and shared passion, and a deepening of knowledge to be derived from ongoing interaction (Preece and Maloney-Krichmar, 2005). The patterns of knowledge development can be continuous, cyclical and fluid. A parallel can be drawn between apprentices learning in social and situated contexts and newcomers to a community of learning, forging a role and attempting to establish an identity through membership.
Professional virtual communities, in particular, engage participants in 'social and distributive professional development' (Chalmers and Keown, 2006:150), which occurs when individuals open up personal ideas to scrutiny because the presiding spirit is that of collegiality. In terms of information behaviour, this requires time and sustained interaction to support the development of a shared repertoire of resources: stories, ways of addressing problems, examples of best practice (Hildreth et al., 2001). The benefits extracted from meaningful participation are multiple and include the creation of synergies; the extension of personal competences; the development of identity; assimilation of socio-cultural practices; and the deepening of innovative practice (Gannon-Leary and Fontainha, 2007).
However, participation in such environments is not without constraints. Many online communities are short lived and their boundaries are fluid and dynamic (Davenport and Hall, 2002; Ellis et al., 2004).
A wide range of issues must be considered in order to sustain communities of learning, namely: usability of technology; trust in, and acceptance of, ICTs in communication; sense of belonging among members; paying attention to cross-national and cross-cultural dimensions of the CoL (Gallagher and Savage, 2013); shared understandings; a common sense of purpose (Ellis et al., 2004); use of netiquette and user-friendly language; and longevity (Gannon-Leary and Fontainha, 2007). In an earlier investigation, McDermott (2001) emphasises the importance of focusing on themes and core values that are of vital interest to the community members, the encouragement of active participation, and the involvement of key thought leaders. Amin and Roberts (2006) add the existence of open dialogue (including the co-existence of alternative points of view); the possibility of adopting varying levels of participation; a combination of public and private community spaces; and the centrality of real-life and current problems.
A particularly controversial dimension refers to the salience of moderators and their role in keeping the fluidity, quality and naturalness of the interaction. Gibson and Manuel (2003) acknowledge the inherent difficulty in maintaining high levels of energy and engaged participation. Stuckey and Smith (2004) argue that the need for leadership embodied in the role of moderator, facilitator or list owner is a key to a successful community. However, in a study involving a professional online network, Fahey et al. (2007) concluded that the introduction of greater formality, namely through moderator led formal incentives, can be detrimental to the dynamics of information exchange in the network and hinder genuine participation, based on voluntary reciprocity. This study addresses this issue by looking at how relationships, density, and centrality of participants in communities of learning relate to its evolution.
3. Context and methodology
Empirical studies of digital communities of communities of learning are usually based on a mixed methodology (qualitative and quantitative) and the most commonly used information sources are interviews, surveys, archives and participant observation.
The study reported in this paper is based on data extracted from the digital archives of online communication discussion lists and emailed listservs of CoL-01, a virtual community of learning concerned with Economics Education (years 1993-2008). CoL-01 was founded in 1993 and is still active. At the time data collection stopped (6 November 2008), there were a total of 777 participants in CoL-01, and 10,994 messages had been posted.
CoL-01 focuses on the issue of teaching Economics, rather than researching Economics. This community began and remains as a listserv mailing list. It presents itself in the following terms:
"[…] This is a place to discuss ideas related to the teaching of economics. We particularly concentrate on undergraduate university-level teaching, but do occasionally foray into graduate or secondary-school teaching. This is also a place to make contacts and form collaborative teams to work on projects related to the scholarship of teaching and to multi-campus collaborative efforts. […]" [CoL-01 welcome webpage].
Three additional online communities of learning were selected to establish comparisons and show the relevance of CoL01. They are also informal communities for sharing information and knowledge: CoL-02 (Economics, business, and related subjects) and CoL-03 (International Economics and Business Education) are both hosted by the United Kingdom's National Academic Mailing List Service - JISCmail; CoL-04 (Research in Economics newsgroup) used a moderated UseNet discussion list and a Yahoo! Group at a later stage of its existence. Further details on all communities of learning can be found on Table 1 (section 3.1).
The methodological approaches employed in the analysis of data are: 1) descriptive statistical analysis to describe and interpret communities of learning' characteristics and dynamics and 2) network analysis.
3.1 - Databases: digital archives of online communication among Economics educators
The information available on CoL-01 is more complete than for the other communities of learning, since it has been in existence since 26 March 1993. This is also the reason why CoL-01 is explored in more depth in this paper. During the period under analysis, the community exchanged 10,994 messages from which 9,365 comprised replies or replies to replies. Seven hundred and seventy seven participants were involved in the discussions inside CoL-01. The what and the how of fifteen years of rich debate is the subject of research in the next section of this paper. Created in March 1993, CoL-01 started and remains as a listserv.
3.2. Study of relational data: network concepts and analysis measures
Before the presentation of the network measures and indexes some fundamental concepts must be introduced. Here the word graphs or network are equivalent.
| Characteristic | CoL01: Economic education | CoL02: Economic education | CoL03: Economic education | CoL04: Economic research |
|---|---|---|---|---|
| Life in years (months) | 1993-present 15.8 (190) | 1996-present 12.4 (149) | 1998-present 10.2 (123) | 1993-present 15.6 (187) |
| Years under analysis (months) | 1993-2008 15.6 (188) | 1996-2008 12.2 (147) | 1998-2008 10.1 (121) | 1993-2008 15.4 (185) |
| First message (archive) | 26 March 1993 | 6 August 1996 | 10 October 1998 | 22 June 1993 |
| Last message included in study | 6 November 2008 | 23 October 2008 | 8 November 2008 | 2 November 2008 |
| Total messages* | 10,994 | 5,472 | 132 | 8,910** |
| Posts: total subjects | 3,981 | 2,372 | na | na |
| Posts: answers | 9,365 | 3,102 | na | na |
| Messages since 1 January 2008 | 308 | 54 | 4 | 38 |
| Total number of participants | 777 | na | na | 339† |
| Country of origin | US | UK | UK | US |
| IT used | Listserv | Hosted educational site | Hosted educational site | Hosted Google groups |
| * For CoL-01 the number of messages (posts and answers) and the number of participants (posting and/or answering) are the validated numbers, not the original in the archives. ** A search using the word teaching results in 548 messages † Information from Google groups. The number of registered participants was not available for any of the communities. | ||||
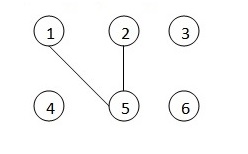
Figures 1 and 2 below represent two networks. Figure 1 represents a directed graph and Figure 2 an undirected graph. Each vertex is represented by circles and edges are represented by arrows (only in Figure 1). It can be hypothetically based on community of learning information about exchange messages between members of a community of learning (e.g., Teacher_4 participates in the same discussion answering Teacher_5). Figure 2 represents an undirected graph (for example three members of the same community of learning participate in the same debate and the role of each [post or reply] is not considered, because arrows are not included).
Standard layout for a figure
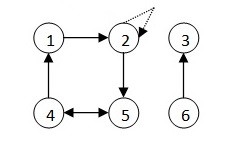
A directed graph like Figure 1 is strongly connected if every two vertices are reachable from each other. The graph in the Figure 1 has one strongly connected component: {1, 2, 4, 5}. All pairs of vertices in {1, 2, 4, 5} are mutually reachable.
The concepts presented and illustrated with a very simple network with 6 nodes (participants) can be applied to larger and more complex networks.
Networks measures and indicators
Multiple relational or network measures and indicators can be computed using relational data:
- Examples of measures which describe the network structure are: size, inclusiveness, component, connectivity, reachability, connectedness, density, centralization, symmetry and transitivity.
- Examples of measures related with one actor (ego-measures), usually associated with the role she performs in the network are: in-degree, out-degree, betweenness, centrality, prestige, star, liaison, bridge, gatekeeper, isolated.
In network analysis, some characteristics are only computed for nodes, networks or a subset of nodes. Other characteristics, like degree, can be computed both for nodes and networks. For a brief presentation see Monge and Contractor (2003).
Some of the network measures are: betweenness, centrality, cliques, cohesiveness, degree, density, power and reciprocity.
There are several ways to compute betweenness. The betweenness of the node i can be given by:
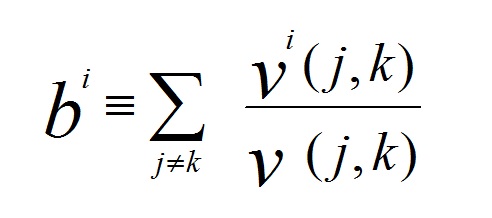
where j and k are different nodes. The total of the shortest paths joining any two nodes is represented by v (j, k), and is equal to v (k, j). The vi (j,k) represents the number of paths which link j and k but also go to another node i (i, j and k being different). The betweenness measures how a node sits between others. The maximum value for betweenness would be achieved where ego is the centre of a star network (Hanneman and Riddle, 2005).
Centrality can be defined at individual (ego) or network level. At the individual level shows the extent to which the network is organised around key nodes (Hanneman and Riddle, 2005). The degree of centrality of a node depends on the number of ties out-degree the node relates with others.
Cohesiveness is a network structure characteristic that is usually applied to a subset of nodes. The cohesiveness of a network is important because the more each node (i.e. participant) is linked to the others, the more it is influenced by group performance. Mutuality and frequency of ties among network members also affect cohesion positively.
The degree of a node is the number of connections that each node has. That number is normalised (normalised degree) using the number of connections that each individual/node can have (n-1). The number of vertices is n. For example T570 had in 2007 fifteen connections (degree) and the normalised degree is 15/(77-1)=19.7 (see Table 7).
The density of a graph (d) or network is computed as:
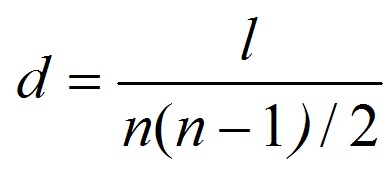
Density is the number of graph lines as a proportion of the maximum number of lines possible, and it ranges between one and zero. For example, the density of the network is 4.6% in 2007 (Table 7). That value was obtained from 135/[(77x76)/2]. Less than 5% of the possible ties are present.
Power is a modification of the degree of centrality. There are several algorithms to compute it (e.g., Bonachi). The main idea is that nodes with the same degree can have different power because the power depends of the connections in the neighbourhood.
Reciprocity, one of the indices of mutuality, is only defined for dyads. A dyad is a pair of nodes and all ties between them.
Results
4.1. Community of learning behaviour profile across time
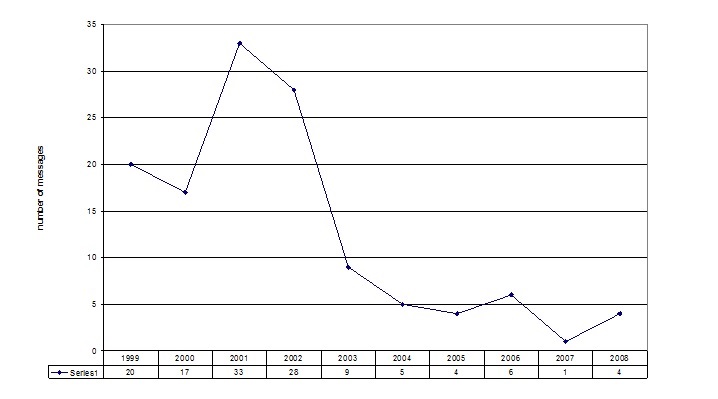
The four communities described in Table 1 have different characteristics, different sizes measured by number of participants and different levels of activity measured by the numbers of messages. However, across time, they exhibit similar profile of behaviour. Figures 3-5 illustrate this similarity in behaviour: a rapid growth followed but a relative stability and in some cases a decrease of activity in the last few years of activity, in CoL-01, CoL-02, and CoL-04. These are the largest communities, but CoL-03 also reveals a similar trend (Figure 6). New social computing technology and practices, such as blogging, may partially account for this decrease of activity (Gannon-Leary, Fontainha and Bent 2011).
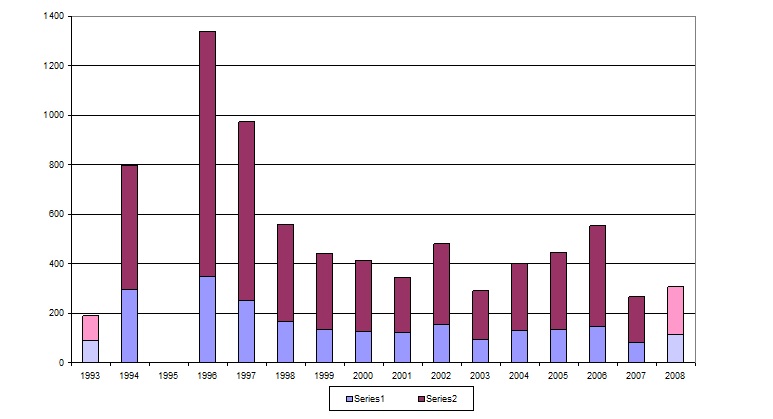
Figure 3: CoL-01 Activity (1993-2008) Number of messages (posts and replies) (total 10,994 messages)
Legend: Series 1=n posts; Series 2=n replies/answers. Two years are incomplete: 1993 (26 March-31 December) and 2008 (1 January-6 November). The values for 1995 exist but for reasons of scale are not represented. [Source: Authors' database built from CoL-01 digital public archive]
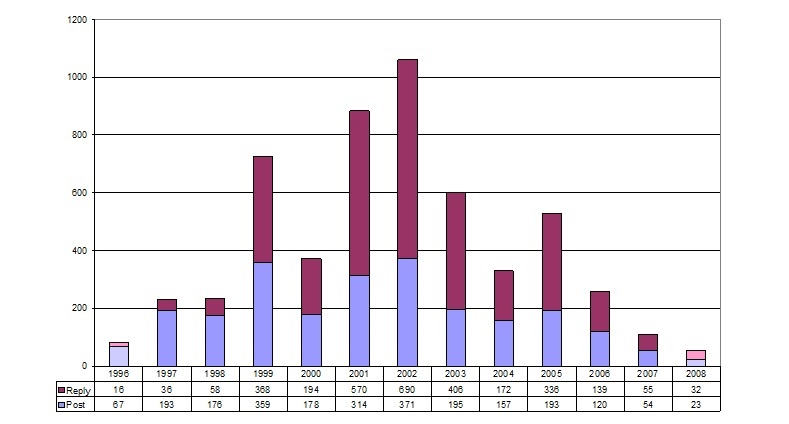
Figure 4: CoL-02 Activity (1996 - 2008) Number of messages (posts and replies) (total 5,472 messages) Number of messages (posts and replies) (total 10,994 messages) [Source: Authors' database built from CoL-02 digital public archive. Two years are incomplete: 1996 (6 August-31 December) and 2008 (1 January- 23 October).]
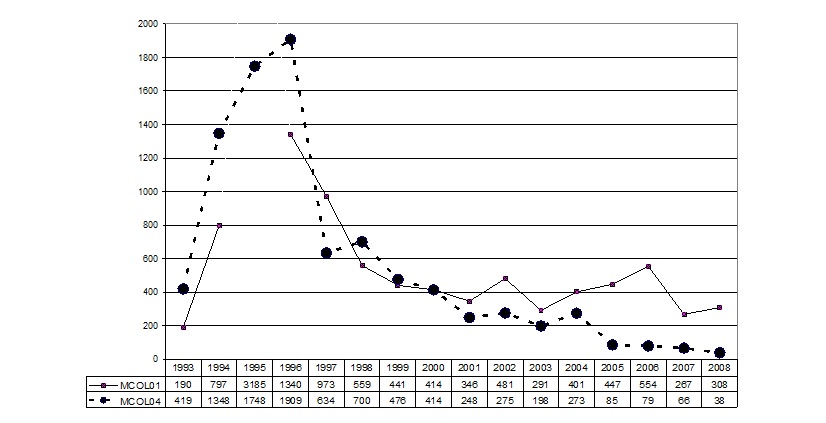
Figure 5: CoL-01 (Economics Teach) and CoL-04 (Economics Research) Activity (1993-2008) Number of messages (posts and replies) [Source: Authors' database built from CoL-01 and CoL-04 publicly available digital archives.]
The four communities also show periods of higher activity in general, even some time after the birth of the community. This kind of behaviour also exists in other innovative processes. Figure 5 compares the dynamics of two communities, one of which is Economics teaching-oriented (CoL-01) and other of which is Economics research-oriented (CoL-04). Both created in the United States, they exhibit similar behaviour over the years. These evolutions partially fit the five stages of development thought that CoPs undergo, according to Wenger (1998): potential, cohesion, active, dispersed and memorable.
Table 2 includes some descriptive measures that can be used to study the activity of the communities. The number of participants, postings, posting per participant are statistics used, for example, by Green and DeLoach (2003) for the study of electronic discussions among students.
| Variables and indicators of community of learning activity | Description |
|---|---|
| Messages | |
| Messages | Total of messages/emails exchanged. Is the sum of Original posts and Replies received |
| Posts | Original message/email posted on listserv (the starting point of each of the discussions) |
| Replies | Answers/replies to original posts. Also includes replies to replies |
| Replies per post (average) | Mean of answers received by an original message (post) |
| Posts without reply | Original messages (posts) which did not receive any answer as a percentage of total posts |
| Posts with more than three replies/total posts | Original messages (posts) which received more than 3 replies as a percentage of total posts |
| Posts with more than ten replies/total posts | Original Messages (posts) which received more than 10 replies as a percentage of total posts |
| Replies per Total Posts (average) | Mean of replies/answer per Original message (post) |
| Replies per post with answer (average) | Mean of replies/answer per original message with answer (post) [note: the posts which received no answer are not included in this computation] |
| Participants | |
| Participants | All persons who post or reply valid messages (spam and technical messages where) [note: the number of formal members is ignored] |
| Participants at moment t | Participants who had participate with messages (posts or answers) until moment t |
| New participants at moment t | Participants who participate for the first time in moment t |
| Posts per participant (average) | Posts per participant [participants are computed at the moment of the post] |
| Replies per participant (average) | Replies per participant [participants are computed at the moment of the post] |
| Participant time of permanence | Time between the first activity of the participant ( ost or reply) and the last activity of the participant |
| Interruptions (years) Y/N | Existence (Y/N) of breaks in the participation |
| Interruptions (years) duration | Duration of breaks in the participation year is the reference time unit |
| N interruptions/n permanence | Number of breaks in the participation year is the reference time unit. |
Regular participation by a large group of teachers is posited to be the key for understanding the longevity of these communities. For instance, whilst CoL-01 membership in the lifetime of the community has been 777 economics teachers, 43 of these have represented about 55% of the total activity of the CoL over that period. On average, 47% of the total posts, 57% of the total answers and 54% of the total messages are associated with this group of 43 more active participants. Table 3 shows the results for a small group of top participants (9 teachers).
During the last decade under analysis, the activity of CoL-01 shows a relative stability measured by the number of participants per year (with a maximum in 1998 of 135 participants). Between 2003 and 2006 there was a regular increase of the number of messages per participant, the number of answers per participant and the number of answers each post received. This last indicator is the one which presents a more stable evolution across the decade: it varies between 1.9 and 2.8 (see Figure7).
| Top Participants (#9) | 2006 | 2007 | 2008 | Messages 1993-2008 | |||||
|---|---|---|---|---|---|---|---|---|---|
| R | P | R | P | R | P | Post P | Rep R | Tot | |
| T432 | 24 | 2 | 26 | 2 | 13 | 1 | 57 | 450 | 507 |
| T769 | 32 | 1 | 30 | 0 | 8 | 1 | 14 | 277 | 291 |
| T690 | 11 | 9 | 17 | 8 | 9 | 17 | 119 | 170 | 289 |
| T518 | 0 | 0 | 0 | 0 | 0 | 0 | 26 | 208 | 234 |
| T520 | 13 | 3 | 14 | 0 | 5 | 2 | 61 | 168 | 229 |
| T723 | 1 | 1 | 3 | 0 | 1 | 0 | 76 | 142 | 218 |
| T684 | 2 | 0 | 6 | 0 | 1 | 0 | 17 | 179 | 196 |
| T570 | 9 | 4 | 20 | 3 | 17 | 8 | 48 | 141 | 189 |
| T678 | 0 | 3 | 8 | 0 | 14 | 1 | 16 | 160 | 176 |
| 92 | 23 | 124 | 13 | 68 | 30 | 434 | 1895 | 2329 | |
| TOT | 311 | 145 | 409 | 80 | 187 | 113 | 3178 | 7816 | 10994 |
| % #9 in Total | 29.6 | 15.9 | 30.3 | 16.3 | 36.4 | 26.5 | 13.7 | 24.2 | 21.2 |
The activity of the 9 top participants (Table 3) and the indicators of permanence and participation presented in Table 4 reinforce the previous conclusion. There is no clear leader in CoL-01, rather a nucleus of regular participants. The variables computed per year of entrance are: total time of permanence (in years and months), last year of participation, number of interruptions and duration of the interruption.
| Members without interruptions (year) in total period participation | 80% |
| Members with one year of participation | 48% |
| Members with more than 11 years of participation | 3% |
| Members who stay more than 9 years | 10% |
| Members who stay more than 16% (all Col-01 life) | 1% |
Most of the participants in CoL-01 are from higher education institutions in the United States (70%). In total teachers from 35 countries participate in this CoL-01. About 70% of the participants are affiliated with US universities.
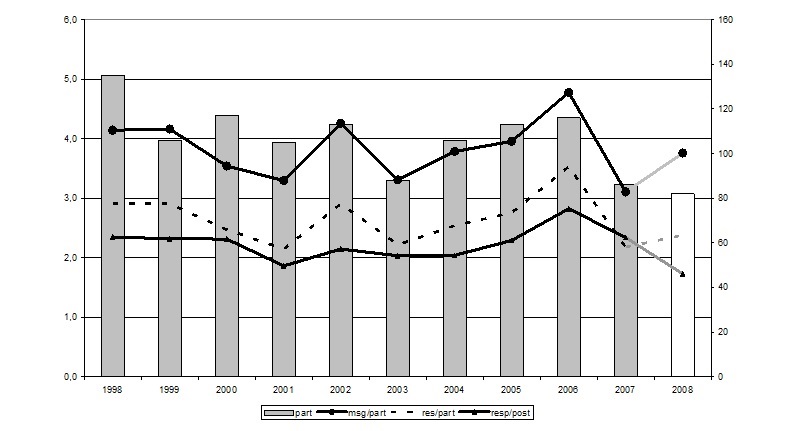
[Source: Authors' database built from CoL-01 publicly available digital archives. Number of participants is represented as bars and the values are in the right axis.]
4.2. Knowledge and information sharing behaviour
There are multiple classifications for the knowledge and information exchanged among CoL participants. Ryymin et al. (2008) propose five categories for a teaching community: technical questions regarding ICT, pedagogical questions regarding ICT, collaboration of web based learning, new knowledge or ideas of web based learning, informal interaction. Hara and Hew (2007) propose ten communication categories.
The following eight communication categories are adapted from the ten categories used by Hara and Hew (2007):
- Knowledge sharing (economic theory) [KSECO] - asking for opinion about a specific economic theory or method, or interpretation of an economic fact. Not teaching focused.
- Knowledge sharing (teaching content issues) [KSTCH] - questions or experience sharing about the teaching of a particular topic in economics or teaching in a particular context.
- Knowledge sharing (teaching methods issues) [KSMET] - questions or experience sharing about methods adopted for teaching. How to teach a specific topic (e.g., international trade) or a specific technology of teaching (e.g., using power point presentations). Also includes student assessment issues.
- Solicitation of information [INF] - helping to locate an article or document. Usually these messages have only two or three participants.
- Professional knowledge [KSPRO] - profession (teacher, researcher) related knowledge.
- Appreciation, compliment and encouragment [COMP] - sending thanks to a particular member or all members of the community
- Administrative [ADM] - related to the management of the listserv or community.
- Calls for papers and job posting [CLL] - call for papers (meetings, journal issues) and job vacancies.
The most active topics of discussion for the period 1993-2008 for CoL-01 were selected and then grouped according to these typologies (Table 5).
| Year | Subject or content | Classification comm class (*) |
|---|---|---|
| 1993 | Pre-principle course [for non business majors] | KSTCH |
| 1994 | Economic majors [successful undergraduate eco majors | KSTCH |
| 1995 | Reasoning [teach the students a way of thinking] | KSTCH |
| 1996 | Price discrimination [inclusion in Principles?] | KSTCH |
| 1997 | Wants/needs [economics basic concepts] | KSTCH |
| 1998 | Research methods [student research papers] | KSMET |
| 1999 | Popular media vs. reality [economics and election in news] | - |
| 2000 | Schools of thought [any ranking?] | KSECO |
| 2001 | Cheating and privacy rights [policies against cheating] | KSMET |
| 2002 | Future of [CoL-01] [continuation or end?] | ADM |
| 2003 | Weight of final [final examination weight] | KSMET |
| 2004 | Bookstore bidding [textbook market and students behavior] | KSTCH |
| 2005 | Tax emancipation day [public and private; fiscal policy] | KSECO |
| 2006 | Class observations [of colleagues; evaluation days] | KSPRO |
| 2007 | Classroom behaviour question [with stress on problems | KSTCH |
| 2008 | Krugman/more Krugman [about Nobel Prize and theory] | KSECO |
A similar analysis carried out with CoL2 revealed that for both communities - those hosted in an US university and in an educational website in the in UK - the topics which recur most frequently are similar. Knowledge sharing represents the largest percentage and in particular Knowledge sharing related to teaching methods and teaching content are important (see Table 6). The discussions about student behaviour are more frequent in CoL-01 as well as theoretical aspects. Administrative, Appreciation and Calls are less important.
| CoL-01 | CoL-02 | |
|---|---|---|
| Teaching categories | ||
| Teaching (how to teach.) 23% | Teaching (how to teach.) 31 % | |
| Theoretical aspects (e.g., AS/AD) 23% | Courses, syllabus 23 % | |
| Students (e.g., behavior) 15% | Web resources inform 23% | |
| Courses, Syllabus 8% | ||
| Communication categories | ||
| Teaching content issues (31%) | Teaching content issues (38%) | |
| Teaching methods issues (23%) | Teaching methods issues (38%) | |
| Economic theory (23%) | Economic theory (8%) | |
4.3. Network analysis of CoL01
The previous section described the CoLs with statistical data and indicators focused on the attributes or characteristics of the entities, for example mean of messages per participant/year. Attribute data analysis differs from relational or network data analysis because the latter focuses on the relation or flux among entities (in this case participants of a CoL) and computes measures which evaluate the density or cohesion of the network, the reciprocity between the network entities or the centrality of the agents inside the network. Both attribute and relational analysis are complementary. Relational information can be represented by graphs as well as by the associated adjacency matrices.
The study of electronic discussions related to economics education or education in general considering formal discussion (e.g., as a process of learning in class as proposed by Greenlaw and DeLoach (2003)) or informal discussion (e.g., Hara and Hew (2007), 246-247) is relatively recent. The methodologies of analysis adopted are, among others, content analysis and social network analysis. The usefulness of this last methodology was particularly pointed out by Garton et al. (1997) who review the potential for studying social networking. The following are examples of questions that social network analysis helps finding answers to, according to Garton et al. (1997): (i) Who answers to whom? (this refers to the composition of ties); (ii) What do they talk about?; (iii) 'How do ties and relations maintained by computer mediated communication change over time?'; (iv) 'How do interpersonal relations such as friendship, work role and organizational position affect the communication?'. In this study, (ii) was analysed in the previous section only in a descriptive way and (iv) was not included.
In fact, network analysis has already proved useful for the study of communities of learning. For example in Haythornthwaite (2005) and in De Laat et al. (2007).
There is software available for performing network analysis, for example UCINET, Pajek and associated material as identified in Hanneman and Riddle (2005) and Nooy et al. (2005). Through the adoption of network analysis and the systematic exploration of data from CoL-01 related to links among participants (e.g., answer to a post) several network indexes were computed. What follows next is a representation of the networks as graphs or matrices. Some relational or network measures are presented in Table 7.
The adjacency matrices were built based on the information available in the public archives. The adjacency matrix is a squared matrix with all CoL participants in line and also in column. Each cell in the matrix represents one type of relation between a pair of participants (for example T777 answer to T776). The links or ties considered between the participants of the CoL-01 community are "answer to whom" (this is an oriented tie, which enable to built a directed graph). From the adjacency matrix and using the network software UCINET (Borgatti and Freeman 2002) the graphs of the networks were obtained. For 2007 the adjency matrix is 77x77 and for 2008 is 68x68. The matrices are obviously asymmetric. Figures 8 and 9 are the visual representation of the interaction (adopting answer to whom as the link) among CoL-01 members. Each node (point) represents a participant of the community with a code Tnnn (all the participants are coded from T001 until T777). The represented participants are only the effective participants in both years. The graphs do not represent all the activity because they only include who posted at least a message (which receives at least one answer) and who answer at least once. This means that participants who posted messages which did not receive any answer are not considered here. The same occurs with isolated members, which are members without any connection.
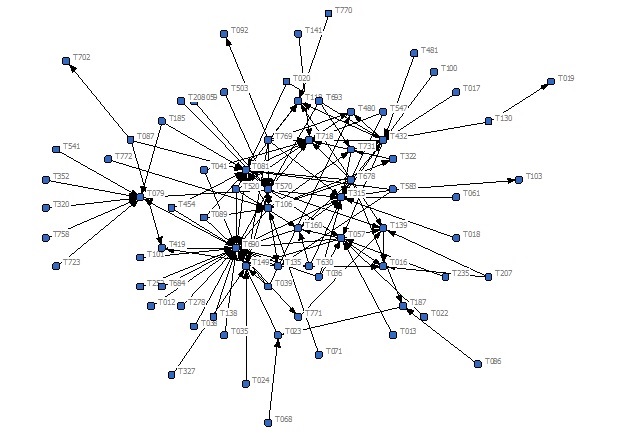
Figure 8: Network of CoL-01 2007 68 Nodes (teachers) 137 Ties or links ("answer to whom")
| 2007 | 2008 | |||
|---|---|---|---|---|
| Network | Special nodes or egos(*) | Network | Special nodes or egos(*) | |
| Network size (N of nodes) | 77 | 68 | ||
| N of ties | 135 | 137 | ||
| Possible ordered pairs | 5852 | 4556 | ||
| Network centralization | 31.8% | 33.9% | ||
| Network Density | 4.6% | 6.0% | ||
| Actual ties/Nx(N-1)/2 N=number of nodes |
||||
| Heterogeneity | 3.3% | 3.2% | ||
| Normalized | 2.1% | 1.7% | ||
| Degree | T690 (27) | T690 (26) | ||
| T570 (15) | T570, T139 (16) | |||
| T315, T081, T432 (13) | T432 (11) | |||
| Out-degree | T570(10) | T432, T678,T769(10) | ||
| Degree | T690 (27) | T690 (26) | ||
| T678(9) | T570(7) | |||
| T769 (7) | T087 (6) | |||
| Power (Bonachi) | T678(9;37.7) | T678,T769 (10; 29.3) | ||
| T769(7;29.4) | T570 (7; 20.5) | |||
| T570(5;20.9) | T0878 (6; 17.6) |
| Measures | T690 | T570 | T081 | T776 | T480 | T139 | ||||||
|---|---|---|---|---|---|---|---|---|---|---|---|---|
| 2007 | 2008 | 2007 | 2008 | 2007 | 2008 | - | 2008 | 2007 | 2008 | 2007 | 2008 | |
| Size of ego network. | 27 | 26 | 15 | 16 | 13 | 3 | - | 1 | 4 | 4 | 6 | 16 |
| Number of directed ties. | 23 | 19 | 14 | 15 | 13 | 1 | - | 0 | 2 | 1 | 3 | 12 |
| Pairs - number of ordered pairs. | 702 | 650 | 210 | 240 | 156 | 6 | - | 0 | 12 | 12 | 30 | 240 |
| Density - ties divided by pairs. | 3.3 | 2.9 | 6.7 | 6.3 | 8.3 | 16.7 | - | 0 | 16.7 | 8.3 | 10.0 | 5 |
| Out-degree | 5 | 7 | 10 | 7 | 2 | 3 | - | 1 | 1 | 0 | 1 | 1 |
| Power (Bonachi) Normal |
2.5 10.5 |
3.5 10.3 |
5 21.0 |
7 20.5 |
2 8.4 |
3 8.8 |
- | 1 2.9 |
.5 2.1 |
0 0 |
.5 2.1 |
1 2.9 |
| Degree NrmDegree Share |
27 35.5 .101 |
26 38.8 0.096 |
15 19.7 0.56 |
16 23.0 0.059 |
13 17.1 .049 |
3 4.5 0.01 |
- | 1 1.5 0.004 |
4 5.3 0.015 |
4 6.0 0.015 |
6 7.9 .022 |
16 23.9 0.059 |
| Reciprocity | 0.0 | 0.077 | 0.067 | 0.063 | 0.0 | 0.0 | - | 0.0 | 0.0 | 0.0 | 0.0 | 0.0 |
| Ego betweenness | 98 | 163 | 52 | 67 | 17.5 | 0.0 | - | - | 1 | 0 | 3 | 14.0 |
| Normalized ego betweenness. | 14.0 | 25.2 | 24.8 | 27.9 | 11.2 | 0.0 | - | 8.3 | 0 | 10 | 5.8 | 16 |
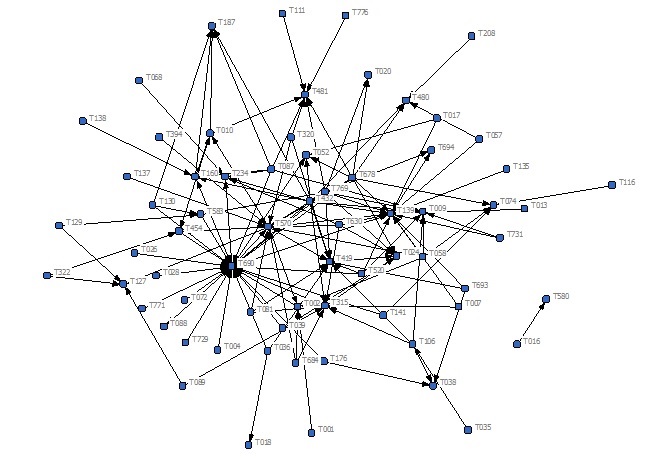
From Figures 8 and 9 it is evident that both T690 and T570 have important positions in the web, because they receive several answers. Note that they belong to the group presented in Table 3. However, the role of participants changes: for example T081 who mainly answered questions during year 2007, received several answers during 2008. The study of CoL-01's activity between 1993-2008 shows that it includes dynamic aspects and changes in the roles of members across time (study not shown in this paper due to space limitations, but available upon request from the authors).
In both years, there are active participants and other participants who take a more peripheral role. From 2007 to 2008 two teachers remained a central node (also named as 'star'). However, the CoL presents changes. For example teacher T081 changes their role from answer receiver in 2007 to answer sender in 2008. Accordingly, the size of that ego decreases.
The graphic representation of the network is visually attractive, but very insufficient for measuring the network characteristics. Note that in the graph the representation is random and the size of the lines has no significance. In order to mitigate this, Table 7 shows relevant network indicators. The network is not very dense because only a small percentage of the potential links are actually represented. However, it must be pointed out that there is no ideal level of density.
To demonstrate the possibilities of very finely grained analysis, Table 8 presents ego network measures, referred to specific nodes or members. In that case, six participants were selected and two of them have a relevant participation in CoL-01. Teachers T690 and T570 have key roles in both years. The degree of centrality (normalised) has a small increase in the T690 and T570 cases and a large increase in the T139 case (from 7.9 to 23.9). This increase in the network centralisation means that the communication is dominated by core central participants (it changed from 32% to 24% between 2007 and 2008).
Conclusions
This paper offers a number of conclusions that emerge from the statistical and network analysis applied to virtual communities of learning concerning Economics, in particular CoL-01, which has been active for more than twenty years. First, the activity measured in communities of learning using several indicators stabilised or decreased over the last few years. It has also presented similar life cycle patterns. However, the behaviour of the participants remained stable (i.e. ratio of answers per topic of discussion or post). Other emergent trends brought to light include shifting in membership and a weak renewal of participants.
Secondly, and not in line with arguments in the literature favouring the role of single moderation and leadership within communities of learning, CoL-01 provided evidence of decentralised leadership in the debating of issues. In fact, CoL-01 exhibits a strong, consistent nucleus of 50 participants (out of 777 total participants), who keep more active during the whole period under analysis. Future research should try to illuminate the characteristics and traits of these participants, as this can potentially help organisers and conveners of communities of learning maximise the benefits extracted from discussion and increase the quality of learning.
A third result emerging from content analysis refers to the type of knowledge most predominantly shared, which consists mainly of knowledge directly related to teaching and student practices and learning, and in less degree of institutional aspects or professional information (journals, meetings, etc.).
Concerning network density, the density of interrelations inside CoL-01 increases across time and seems unaffected by geographical or cultural distances. The network appears to reinforce itself. However, the roles of leadership and betweenness among members change when there are changes in the discussion topic. This distributed brokering role may explain the longevity and dynamics of this community of learning.
Finally, the research presented in this paper illustrates the usefulness of large, publicly available digital archives and proposes novel measures to analyse the activities and dynamics of communities of learning, such as total posts, share of posts with reply, years of permanence of member in the community and new members per year. Furthermore, the community's structure is studied based on relational indicators and measures obtained from network analysis, such as reciprocity, ego betweenness or power.