The focus factor: a dynamic measure of journal specialisation
Jeppe Nicolaisen
University of Copenhagen, Birketinget 6, DK-2300 Copenhagen S., Denmark
Tove Faber Frandsen
Odense University Hospital, Søndre Boulevard 29, DK-5000 Odense, Denmark
Introduction
The Philosophical Transactions of the Royal Society of London is commonly referred to as the first scientific journal. It was published for the first time in 1665, three months later than the French Journal des Scavans. Both journals published scientific information, but Journal des Scavans focused more on reviewing books than on communicating new research in article form (Meadows, 1974). These two journals, and the journals that subsequently followed, originated as the public record of the activities and interests of learned societies. Journals unrelated to scientific societies began to emerge during the eighteenth and nineteenth centuries (Meadows, 1974). As a response to the rapid increase in new research results during the nineteenth century, scientists began to specialise in sub-disciplines. Scientists were no longer able to follow the development in their own discipline as a whole, but focused instead on smaller disciplinary fractions. This development also led to the increasing specialisation of many scientific journals (Meadows, 1974).
Thus, for a long time the scientific journal has been the most important media for communicating new ideas and knowledge in science, in most of the social sciences, and to a lesser, but growing, extent in the arts and humanities. Perhaps because of this status as the most important media for scientific communication, the scientific journal as a research communication media has caught interest from a number of fields (e.g., history of science, sociology of science, linguistics, library and information science, and others). Yet, the field that has studied the scientific journal the most is undoubtedly bibliometrics. One study immediately springs to mind: Derek J. de Solla Price’s seminal discovery of the exponential growth of science that was based on studies of the oldest scientific journal (Philosophical Transactions) and other journals (Price, 1963). Countless other bibliometric studies focusing on the scientific journal have followed (too many to mention here). Some of these studies have sought to establish adequate citation-based measures for various aspects of the scientific journal. Among the most prominent of these are Burton and Kebler’s (1960) study, in which they developed a measure of the obsolescence of scientific literature (the half-life), later used for measuring the obsolescence of scientific journals (e.g., The Journal Citation Reports); and Garfield and Sher’s (1963) study, in which they developed the journal impact factor. Many alternative measures of journal obsolescence and journal impact have been developed since the 1960s, but a vital aspect of the scientific journal has thus far been largely overlooked or ignored by this line of bibliometric indicator research: journal specialisation. It is actually a bit curious since bibliometricians have long known about the important factor of specialisation for the outcome of bibliometric studies. Almost forty years ago, Henry Small pointed to the principal finding of experiments conducted one to two years before by leading bibliometricians including, amongst others, Eugene Garfield, Belver C. Griffith and himself, and concluded that the primary structural unit in science is the scientific specialty (Small, 1976, p. 67). A common critique of the journal impact factor is that the impact factor of a journal is partly determined by its level of specialisation (e.g., Seglen, 1997). Thus, to improve our interpretation of bibliometric journal indicators (e.g., the journal impact factor), we need a simple yet effective measure of journal specialisation. One that could be readily incorporated into products like, for example, The Journal Citation Reports.
Nicolaisen and Frandsen (2013) developed a simple yet effective measure for measuring the specialisation of scientific journals. They presented the idea for this new citation-based measure at the CoLIS8-conference in Copenhagen in 2013 (Nicolaisen and Frandsen, 2013) and as a brief communication published in the Journal of the Association for Information Science and Technology (Nicolaisen and Frandsen, 2015). Having tested the measure on a larger sample, we present a more detailed investigation of the new measure. Specialisation equals narrowing one’s focus and we have therefore chosen to name the new citation-based journal measure the focus factor.
The next section provides a detailed description of the focus factor including the basic theoretical assumptions it rests upon, related measures and how it is calculated. In subsequent sections we then demonstrate the application of the new indicator on a selection of scientific journals and test its validity as a measure of journal specialisation.
Related literature and measures
The new citation-based measure that we are about to present is a measure of journal specialisation. It is based on the common definition of scientific specialities and specialisation that may be found in many texts on the sociology of science and science studies (including bibliometrics). Before we present the focus factor in more detail, we will briefly outline this common understanding and definition, and briefly touch upon related bibliometric measures.
Specialities and specialisation
In his book Communicating research, Meadows (1998) discusses, among other things, the rapid growth of scientific research and how the research community has developed a mechanism for coping with the excessive information output. This mechanism is, according to Meadows (1998, p. 20), specialisation. To understand exactly what he means by specialisation, one has to examine his argument somewhat further. Meadows (1998, p. 19) asks the reader to listen to Faraday’s complaint from 1826:
It is certainly impossible for any person who wishes to devote a portion of his time to chemical experiment, to read all the books and papers that are published in connection with his pursuit; their number is immense, and the labour of winnowing out the few experimental and theoretical truths which in many of them are embarrassed by a very large proportion of uninteresting matter, of imagination, and error, is such, that most persons who try the experiments are quickly induced to make a selection in their reading, and thus inadvertently, at times, pass by what is really good.
Today there is much more information to cope with than in the days of Faraday. Therefore, one could consequently be led to believe that the problem which Faraday described is much worse in our time. However, according to Meadows (1998), it is not. The reason is that modern chemists no longer try to command what Meadows (1998, p. 20) terms the same broad sweep of their subject as chemists did in Faraday’s time. Modern chemists concentrate instead on much more restricted topics (Meadows, 1998, p. 20). Researchers have become much more specialised (Meadows, 1998, p. 20). As research has expanded, researchers have confined their attention to selected parts of it (Meadows, 1998, p. 20). Members of a discipline are therefore typically interested in only part of the field (Meadows, 1998, p. 21).
This definition of specialities resembles the idea of a social division of labour in society. In all known societies the production of goods and services is divided into different work tasks, in such a way that none of the members of a society conduct all tasks. On the contrary, the types of work tasks which an individual may conduct are often regulated by rules and individuals are often obliged to conduct certain tasks. Adam Smith (1723-1790) was the first to formulate how the social division of labour leads to increased productivity. In his book, On the wealth of nations, published in 1776, he even maintains that division of labour is the most important cause of economic growth. A famous example from the book illustrates his point. The example concerns a pin factory. According to Smith, a pin factory that adopts a division of labour may produce tens of thousands of pins a day, whereas a pin factory in which each worker attempt to produce pins from start to finish, by performing all the tasks associated with pin production will produce very few pins. What Meadows (1998) seems to have in mind when describing the strategy adopted by modern chemists is thus the strategy of a successful pin factory. Like the workers of a successful pin factory, modern chemists have divided their work tasks between them and are consequently working on different, but related, tasks. Today, there are several specialities in chemistry, including organic chemistry, inorganic chemistry, chemical engineering and many more. The same holds true for all other scientific fields. Sociologists, for instance, usually work within one of the specialities described in Smelser’s (1988) Handbook of sociology. These include, among others, the sociology of education, the sociology of religion, the sociology of science, medical sociology, mass media sociology, sociology of age and sociology of gender and sex.
Meadows (1998, p. 44) mentions that disciplines and specialities also can be produced by fusion. The combination of part of biology with part of chemistry to produce biochemistry is just one example.
Consequently, what characterises a speciality is the phenomenon or phenomena which members of the speciality study. Organic and inorganic chemistry, for instance, are different specialities because the researchers in these specialities study different phenomena. Organic chemists study materials that are carbon based, such as oil or coal, while inorganic chemists work with materials that contain no carbon or carbon-based synthetics. Sociologists of science study scientific societies while sociologists of religion study religious societies. Though most of the members of these two groups have been trained in the discipline of sociology, they belong to different sociological specialities because they study different sociological phenomena.
As noted above, Meadows’ definition of specialities corresponds to the definition usually employed in science studies. Crane and Small (1992, p. 198), for instance, explain the concept of specialities by arguing that:
clusters of related research areas constitute specialties whose members are linked by a common interest in a particular type of phenomenon or method (such as crime, the family, population, etc.). Disciplines, in turn, are composed of clusters of specialties
Small and Griffith (1974, p. 17) maintain that 'science is a mosaic of specialties, and not a unified whole', and note that specialities are the building blocks of science. Gieryn (1978), Whitley (1974) and Zuckerman (1978) claim that a problem area is made up of a number of related though discrete problems, that a cluster of related problem areas comprise a speciality, and that a scientific discipline covers a set of related specialities.
Measuring specialisation
Hagstrom (1970, p. 91-92) argues that 'it is reasonable to believe that scientists will communicate most often and intensively with others in their specialties, exchanging preprints with them, citing their work, and exchanging reprints'. Ziman (2000, p. 190) notes that 'scientific specialties often seem to be shut off from one another by walls of mutual ignorance'. These assumptions have been explored and confirmed empirically by bibliometricians.
Using simple citation analysis, Earle and Vickery (1969) investigated to what extent a variety of subject areas drew on the literature of their own area (subject self-citation) and other subject areas. They found considerable variations among the subject areas under study, which seem to fit with the assumptions regarding specialisation. Among their findings was that considerable dependence on other subject areas was found in the general science and general technology areas, whereas mathematics was found to depend little on literature from other subject areas.
Author self-citations have also been found to reflect specialisation tendencies. Often, author self-citations are frowned upon by critics of citation analysis (e.g., Seglen, 1992; MacRoberts and MacRoberts, 1989; 1996). The critics speculate or even claim (see Seglen, 1992, p. 636) that author self-citations are equal to self-advertising and, thus, that author self-citations should be eliminated from evaluative bibliometrics. Yet a study of fifty-one self-citing authors conducted by Bonzi and Snyder (1991) revealed essentially no differences between the reasons that authors cite their own work and the reasons they cite the work of others. The self-citations predominantly identified related work or earlier work that later works were built upon. Thus, author self-citations seem to indicate an author’s specialised focus on a narrow scientific problem. Early studies by Parker, Paisley and Garrett (1967) and Meadows and O’Conner (1971) also documented similar relations between specialisation and author self-citations.
Marshakova (1973) and Small’s (1973) co-citation technique provides a quantitative technique for grouping or clustering cited documents or cited authors. By measuring the strength of co-citation in a large enough sample of units (e.g., documents or authors) it is possible to detect clusters of units, which are highly co-cited. The information scientists, who became interested in this technique during the 1970s and onward, have repeatedly found that such clusters adequately represent scientific specialities (e.g., Small and Griffith, 1974; White and Griffith, 1981; White and McCain, 1998; Zhao and Strotmann, 2014).
Bibliographic coupling (Kessler, 1963) is a related method for clustering related entities. Documents (or other units of analysis) are said to be bibliographically coupled if they share bibliographic references. Bibliometricians began to take an interest in this technique during the 1990s, using it for identifying and mapping clusters of subject-related documents (e.g., Glänzel and Czerwon, 1996; Jarneving, 2007; Ahlgren and Jarneving, 2008). As shown by Nicolaisen and Frandsen (2012), bibliographic coupling has another promising potential as a measure of the level of consensus and specialisation in science. Using a modified form of bibliographic coupling (aggregated bibliographic coupling), they were able to measure the level of consensus in two different disciplines at a given time.
The focus factor
Specialisation is a process. The level of specialisation within a discipline probably increases or decreases over time. To measure this by bibliometric methods such as self-citations, co-citation analysis or bibliographic coupling, a time dimension needs to be included. The focus factor is created with this purpose in mind. Using the scientific journal as sample unit, it measures the level of specialisation by calculating overlaps in bibliographic references year by year. For example: a journal produces 1,536 references in year zero and 1,622 references in year one, 219 of which are found in the reference lists of the journal in both years. Thus, 219 out of 1,622 references in year one are similar to references found in the same journal the preceding year. This equals 13.5%, and is taken as an indicator of the level of specialisation in that particular journal in year one. The level of specialisation in year two is calculated by comparing the overlap in bibliographic references used by the same journal in year one and year two, and so on.
The method was tested by Nicolaisen and Frandsen (2013; 2015) on a selection of core journals in library and information science. The results showed that the focus factor distinguishes satisfactorily between general journals and speciality journals, and, moreover, effectively measures the level of specialisation among the selected journals.
Method
To examine the applicability of the focus factor on a wider variety of subjects and journals we have tested the measure on a selection of general science journals, general medical journals and specialised medical journals (see table 1). The general science journals include journals such as Science, Nature and PNAS (see, e.g., Fanelli, 2010), of which the two first mentioned are selected for the present study. The general medical journals selected for this study are among the most prestigious medical journals (see, e.g., Choi, Nakatomi and Wu, 2014) also known as the big five (e.g., Wager, 2005). The specialised medical journals are selected as examples from a wide range of specialist journals available on the basis of advice from two medical information specialists (MD and MSC).
| General science journals |
|---|
| Science |
| Nature |
| General medical journals |
| British Medical Journal |
| The Journal of the American Medical Association |
| Annals of Internal Medicine |
| Lancet |
| New England Journal of Medicine |
| Specialised medical journals |
| Ophthalmology |
| Archives of Ophthalmology |
| American Journal of Ophthalmology |
| British Journal of Ophthalmology |
| Experimental Eye Research |
| Investigative Ophthalmology |
| Journal of Clinical Oncology |
| JNCI: Journal of the National Cancer Institute |
In order to determine the share of re-citations, the references in a specific year of each of the included journals were compared to the references in the journal in the previous year. A re-citation is defined as a 100%match between a cited reference in one year to a cited reference the previous year. This means that spelling errors, typing errors, variations of spelling and similar irregularities are potential sources of bias, but as they are expected to be evenly distributed across the data set, bias is unlikely. Data registered is name of journal, publication year, cited references in the journal and the number of instances for every reference. Some of the references appear more than once and consequently the number of re-citations depends on the total number of instances and not just the number of unique references. Information on journal, publication year and cited references in the journal was collected using Web of Science. Information on the number of instances for every reference was gathered using software developed for this specific purpose. The share of re-citations in journal j in year y is calculated as follows:
Share of re-citations = number of re-citations (j,y) / total number of references (j,y)
The following is an example of how share of re-citations is calculated: in 2011 Nature contained 32,069 references of which 4,971 were re-citations, resulting in a share of re-citations of 4,971 / 32,069 = 0.155.
In total this study analysed 4,788,579 references in 15 journals from 1991 to 2012 and calculated the re-citation share. Only articles, notes, reviews and letters were included. Letters are included as recommended by Christensen et al. (1997).
Results
The journals included in the analyses are specialised to a varying degree. The share of re-citations varies from 0.05 to more than 0.2, i.e. about 20%of the references in any given year appeared in that specific journal the previous year. Figures 1 and 2 are illustrations of the development in levels of specialisation from 1991 to 2012. For specific counts, see appendix.
Figure 1 presents the results of the analyses of the general science journals and the general medical journals.
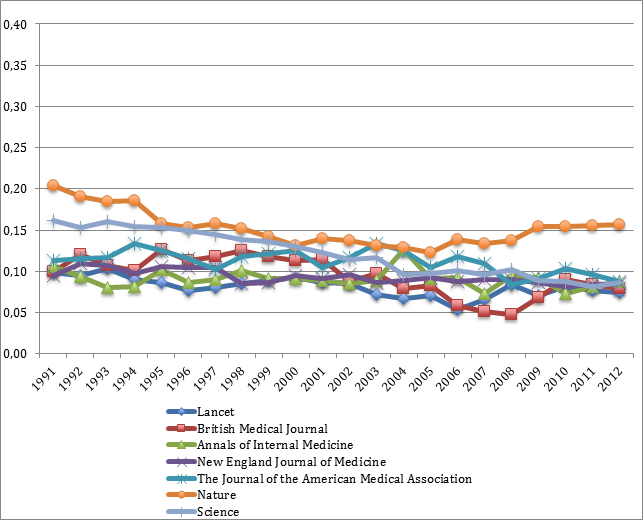
Figure 1: Level of specialisation (general science journals and general medical journals)
One journal stands out in this figure as it is characterised by a greater extent of specialisation, particularly in the last five to six years. Nature appears to be more highly specialised than the other journals depicted in figure 1. This tendency seems to decrease during the first decade of analysis, but increases during the last. The other general journal, Science, on the other hand also starts out highly specialised but moves towards less specialisation during the entire period.
Figure 2 provides an overview of the results of the analyses of the specialised medical journals. To be able to compare the results, the units on the horizontal axes of figures 1 and 2 are the same.
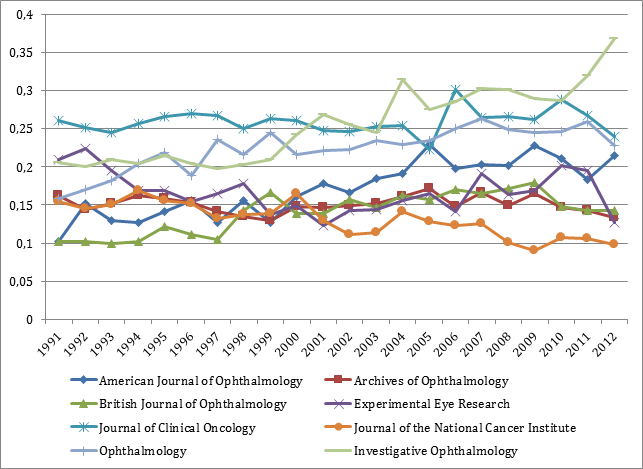
Figure 2: Level of specialisation (specialised medical journals)
The specialised medical journals show great variation with a share of re-citations ranging from 0.10 to 0.37. Some are specialised at a level resembling more general journals, whereas for other journals 30% of the references in some years appeared in that specific journal the previous year.
Nicolaisen and Frandsen (2013) analysed whether the levels of re-citations can be explained by obsolescence. They tested the hypothesis by examining the age distribution of the references in the journal, measured by the half-life or median citation age. A discrete analysis method was applied as publication years were treated as discrete units not a continuum of dates in terms of intervals. The correlation was positive, i.e. journals including a relatively large share of older references are characterised by a greater level of specialisation – all other things equal. Journals with relatively recent references have fewer re-citations simply because there are more references in those journals that could not have been cited the year before. The hypothesis is also tested on this data, yielding a similar result. Figure 3 provides an illustration of the correlation and, parallel to the previous analysis, the r-squared indicates that median citation age alone does not explain the different levels of re-citation. For specific counts, see appendix.
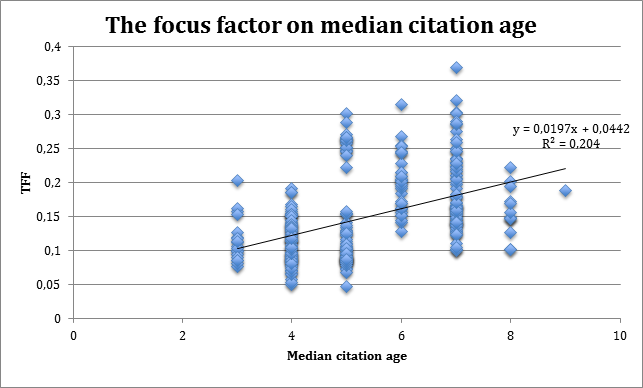
Figure 3: The median citation age and share of re-citations
Turning to another commonly used measure for specialisation that could potentially explain the differences in levels of re-citation, we will now analyse the correlation between share of re-citations and journal self-citations. Share of self-citations is measured for each journal in the entire time period and correlated with share of re-citations. Figure 4 depicts some correlation, although definitely not a very strong one. For specific counts, see appendix.
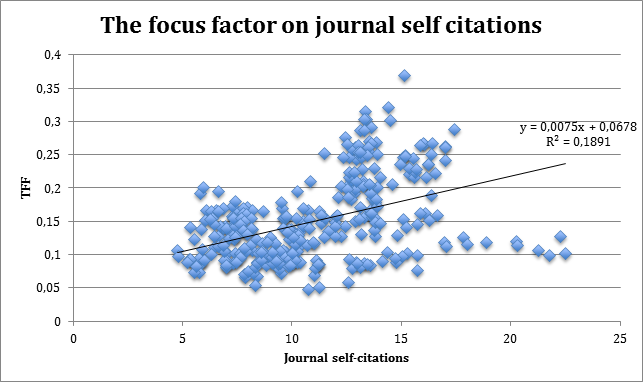
Figure 4: Journal self-citations and share of re-citations
The r-squared value of 0.19 confirms that journal self-citations and share of re-citations are not to be considered similar measures.
Finally, we examine whether the differences in levels of re-citation are caused by differences in number of references. Some might argue that larger journals have more references that may be re-cited. However, the measure is not absolute and consequently larger journals should not be exhibiting higher levels of re-citation. Share of self-citations is measured for each journal in the entire time period and correlated with the total number of references during that year.
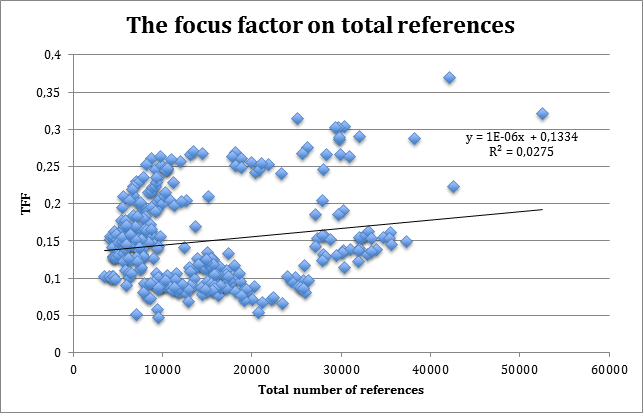
Figure 5: Number of references and share of re-citations
Figure 5 depicts very weak correlation between the number of references and share of re-citations. For specific counts, see appendix.
Discussion and conclusion
Scientific journals serve several purposes. Among the most important of these are credit, dissemination and archiving of research results. Although scientific journals may be said to share vital characteristics, the way they serve their purposes, the means by which they seek to serve them, and their success in serving them, are at best diverse. Thus, seeking to develop a single and unique measure of scientific journals is impossible. As noted by Rousseau (2002), the quality of a journal is a multifaceted notion necessitating a whole battery of indicators. The focus factor is a new contribution to this battery of indicators.
Measuring the level of specialisation is a novelty in bibliometric indicator research. We believe that the level of specialisation is an important aspect of scientific journals. Yet, like other indicators, the focus factor measures only one aspect of scientific journals and only becomes interesting when other aspects are taken into account as well. Moreover, like other indicators, a single meter reading cannot be taken as definite proof. The measure should be applied over time, resulting in several meter readings that should be compared with readings from other journal indicators. Only by this approach may we get an adequate picture of a scientific journal.
When measuring the overall level of specialisation in the two groups of journals, the focus factor is quite capable of distinguishing between general and specialised groups of journals. The general journals presented in figure 1 show figures in the range of 0.05 to around 0.2. The specialised journals presented in figure 2 show figures in the range of 0.1 to 0.35. Yet we find overlapping meter readings in the two groups of journals (between 0.1 and 0.2). Focusing specifically on Nature, we find what appears to be a somewhat more specialised journal. Yet, Nature is normally said to be a general science journal. Logically, either the focus factor is failing or the assessment of Nature as being a general science journal per se is wrong. We believe the latter is the case. When applying the focus factor to a selection of library and information science journals, Nicolaisen and Frandsen (2013) found a similar deviant: Journal of the Association for Information Science and Technology (JASIST). When measuring the level of specialisation using the focus factor, they found that JASIST generally had higher scores than most of the specialised journals in the field. JASIST is a journal that seeks to cover the field at large and would therefore normally be said to be a general journal. Looking a bit deeper into this apparent anomaly, Nicolaisen and Frandsen (2015) found that the high scores of JASIST were mainly caused by a large corpus of bibliometric papers published in JASIST. Thus, they found that it was not a failure of the focus factor, but instead that JASIST over time has shifted its focus more toward bibliometrics, thus becoming gradually more and more specialised. The same is probably the case with Nature. A deeper study will probably reveal a couple of favourite topics of the journal (e.g., cell biology, nuclear physics, astrophysics or even anthropology) leading to a corpus of specialised papers with higher degrees of re-citations. An important consequence of these findings is that the binary notion of general and specialised journals is probably too limiting. In reality, a much richer scale exists.
Previously, specialisation has been measured using other measures:
- Simple citation analysis (Earle and Vickery, 1969)
- Author self-citations (Parker, Paisley and Garrett, 1967; Meadows and O’Conner, 1971)
- Co-citation (e.g., Small and Griffith, 1974; White and Griffith, 1981; White and McCain, 1998; Zhao and Strotmann, 2014)
- Bibliographic coupling (e.g., Glänzel and Czerwon, 1996; Jarneving, 2007; Ahlgren and Jarneving, 2008; Nicolaisen and Frandsen, 2012)
To some extent, the focus factor may be seen as a further development of 1 and 4. Instead of focusing on subject areas and the extent to which they rely on own literature (as Earle and Vickery (1969) did), the focus factor focuses on scientific journals and the extent to which they rely on own literature (defined as literature used and cited the year before). Clearly, such a relation is equal to a bibliographic coupling. Thus, the finding that the focus factor is an adequate measure of scientific specialisation was expected. Likewise, measuring the level of specialisation by journal self-citation was also expected to perform well. However, although we are able to document some correlation between journal re-citation and share of journal self-citation, these measures should not be considered the same.
Finally, it is worth noticing that the scientific communication system is continually changing. New media of communication are constantly surfacing (e.g., mega-journals like PLOS ONE) and readers are provided with new tools for finding and keeping up to date with the developments in their fields of interest (e.g., RSS feeds, searching Google Scholar, etc.), making the context of the journal less visible (e.g., Lozano, Larivière and Gingras, 2012). Journal indicators like the focus factor are of course only relevant indicators as long as the scientific journal remains the preferred medium for scientific communication.
Acknowledgements
The authors would like to thank David Hammer and Anne Poulsen for their competent assistance with data collection, and the two anonymous referees for their valuable suggestions for improvements.
About the authors
Jeppe Nicolaisen is associate professor at University of Copenhagen. He received his PhD in library and information science from the Royal School of Library and Information Science, Copenhagen, Denmark. He can be contacted at: Jep.nic@hum.ku.dk
Tove Faber Frandsen is head of Videncentret at Odense University Hospital, Denmark. She received her PhD in library and information science from the Royal School of Library and Information Science, Copenhagen, Denmark. She can be contacted at: t.faber@videncentret.sdu.dk