Exploring the structure of library and information science Web space based on multivariate analysis of social tags
Soohyung Joo
School of Information Science, University of Kentucky, 337 Little Library Bldg., Lexington, KY 40506, USA
Margaret E.I. Kipp
School of Information Studies, University of Wisconsin-Milwaukee, 2025 E Newport, Milwaukee, WI 53211, USA
Introduction
Traditionally, information organization involved the creation of order within subject areas by professionally trained indexers who organized the subjects into hierarchies of related materials based on expert knowledge of a field. With the advent of the Internet and the World Wide Web, the growth of available information began to outstrip the abilities of human indexers to scale with the size of the document space and required the use of new methods of organization to provide effective access to information. While automatic indexing and algorithms such as Google's Page Rank citation based system attempt to alleviate some of these issues by extracting important terms from full text documents, users are still faced with hundreds of thousands of Internet hits when performing a search. Professional indexers working alone may be unable to scale with the growth of the Internet, but collaborative social tagging has shown some promise of being able to index the most popular or most useful documents using the power of crowd sourcing.
Social tagging emerged as a compelling alternative in Internet information organization which encourages users to apply representational terms to documents on the Web through a social bookmarking tool or other Web 2.0 platform such as a social library catalogue. While these terms need not to be subject related, many are. They also form a folksonomy of terms which are all related in some way to the item being tagged. With multiple users tagging an item on tools such as Delicious.com, these terms soon form a broad folksonomy of interrelated terms all with associated frequencies which allow researchers to see the frequency or weight of each term in the folksonomy. Researchers in the field of social tagging were immediately interested in these frequency charts which demonstrated the usual power law effect (while some terms were used very frequently by taggers the vast majority of terms were used infrequently and often only once by a unique tagger). This apparent convergence of term usage at the upper ends of the frequency graphs showed that taggers acting independently could create some form of order out of the apparently unordered bag of words collected by a social bookmarking tool.
Because of its obvious intersections with the fields of indexing and information retrieval, social tagging has become a major topic in the field of library and information science, and many researchers have tried to explore the distribution and patterns of user-generated tags in different environments based on informetrics techniques. Previous studies have contributed greatly to mathematical modelling of tagging using different mathematical techniques. However, little research has applied multivariate methods, especially confirmatory factor analysis using structural equation modelling. This study introduces the application of a confirmatory factor analysis using structural equation modelling in tag space studies and presents a semantic structure exploration of library and information science Web space using tagged posts from Delicious.com. Then, based on the findings, we discuss the advantages and limitations of structural equation modelling in informetrics studies.
Literature review
Social tagging studies
After the advent of collaborative tagging in early 2000s, many articles have examined various aspects of tagging. These aspects include: the philosophical background of tagging (Weinberger 2007), strategies for improving or using folksonomies (Guy & Tonkin 2006; Schwartz 2008; Yoon 2009; Keshet 2011), analyses of specific tagging systems or specific user groups within a system (Hammond, Hannay, Lund and Scott, 2005; Madden, Ruthven and McMenemy 2013; Gabriel, Spiliopoulou and Nanopoulos 2014), comparisons of controlled vocabularies and tagging (Kipp 2005; Wolfram, Olson and Bloom 2009; Kipp 2011; Golub, Lykke and Tudhope 2014; White 2013), mathematical modelling of tagging systems (Cattuto, Loreto, and Pietronero 2006), user motivations for tagging (Marlow et al. 2006a, 2006b), semantic structure of or relationships among social tags (Cantador, Konstas andJose, 2011; Andrews, Zaihrayeu and Pane, 2012; Wagner, Singer, Strohmaier and Huberman, 2014) and the use of tags in information retrieval (Peters 2009; Bar-llan 2012; Yi and Yoo 2012; Lu and Kipp 2014). In this study, we concentrate on tagging material which examines the use of tags for mathematical modelling as well as relevant studies examining tags as indexing terms or tag usage for information retrieval.
Much of the early work in tagging concentrated on patterns present in the tag frequency graphs and on term usage in tagging created by the network effect of many users tagging the same item (Hammond et al. 2005; Golder and Huberman 2006; Kipp and Campbell 2006). These studies showed that tag terms were reasonable choices representing the targeted item and suggested that users could make useful choices of indexing terms which could be potentially important in the design of information retrieval systems. Further work by Kipp (2005; 2011) examined tags as indexing terms determining that users tags showed some overlap with indexing terms while retaining differences in vocabulary usage and in the use of subjective or affective and non-subject terms (Kipp 2005; 2011). Guy and Tonkin (2006) proposed some simple rules that can be used to tidy up the tags and to eliminate or control duplication of singular/plural forms and other spelling variations. Studies examining user motivation for tagging by Marlow et al. (2006a; 2006b) suggest that users tag mainly for themselves, but that the network effect present in the tag frequency graphs renders many of these terms useful to other users as well (Marlow et al. 2006a; 2006b). Folksonomies have also been studied as a source of terms for enriching or building controlled vocabularies and thesauri (Schwartz, et al., 2007; Yoon 2009). Chen and Ke (2013) analysed the patterns of social tags collected from 1,661 journal articles tagged in CiteULike. They observed that tags obeyed a power law distribution. All of these studies suggested a future for tagging in information organization and retrieval as, at minimum, a source of useful entry terms from a user perspective.
Social tagging also brought up practical implications in the library and museum communities. Spiteri (2006) investigated how social tags could be employed in public library catalogues focusing on personal information space organization, controlled vocabulary supplement, and online communities of interest. In addition, Spiteri (2013) examined the linguistic structure of folksonomy terms and evaluated the collected tags against the National Information Standards Organization (NISO) guidelines. They found that tags correspond to the NISO guidelines in terms of types of concepts expressed, the predominance of single terms and nouns, and the use of recognised spelling. More importantly, they identified problem areas of using tags, such as inconsistent use of count nouns and the incidence of ambiguous tags. In the museum context, Trant and Wyman (2006) and Trant (2009) found that public-generated social tags show a perspective different from that of museum documentation. They claimed that user contributed tags could be compelling supplementary aids to access and search museum objects by reflecting the breadth of approaches to works of museums.
Some of the earlier studies of tagging used small samples with limited statistical analysis or generally qualitative analysis of tagging to demonstrate that social tagging was creating interesting patterns and structures in data available on the Web and was worthy of further study using more advanced mathematical modelling techniques.
Methods in social tagging studies
Researchers have explored the patterns or distributions of social tags using different mathematical and statistical methods. Golder and Huberman (2006) analysed the structure of collaborative tagging systems as well as their dynamic aspects. They discovered regularities in user activity, tag frequencies, kinds of tags used, bursts of popularity in bookmarking and a remarkable stability over the short term in the relative proportions of tags within a given URL. In particular, they presented a dynamic model of collaborative tagging that predicts these stable patterns and relates them to imitation and shared knowledge. Heyman and Garcia-Molina (2006) proposed an effective algorithm for converting a large corpus of tags annotating objects in a tagging system into a navigable hierarchical taxonomy of tags. Xu et al. (2006) defined a set of general criteria for a good tagging system, such as coverage of multiple facets, least effort and high popularity. Based on these criteria, they proposed a collaborative tag suggestion algorithm to identify most appropriate tags, while eliminating noise and spam. Cappocci and Caldarelli (2008) explored the semantic patterns among tags and suggested the methods of a tripartite graph and clustering coefficients in analysing CiteULike, an online collaborative tagging system. Yi and Yoo (2012) used power functions and logarithms to estimate the distribution of tag frequency of Delicious.com tag data, which exhibited an inverse-J shape. They quantitatively modelled based on parametric power and logarithm functions with R2 values to explain the unique tag patterns collected from Delicious.com.
Network analysis has been another frequently applied method in tagging studies. Cattuto et al. (2007) applied a network analysis to examine the co-occurrence of social tags from an online bookmarking system. In addition, social tags were used to explore the semantic structure of resources. Grahl, Hotho, and Stumme (2007) suggested a clustering method for computing a conceptual hierarchy for a folksonomy dataset, named the FolkRank algorithm. The hierarchy is complemented with ranked lists of users and resources most related to each cluster. Schmitz et al. (2008) analysed the main network characteristics of two commercial Websites, YouTube and Delicious.com, by adopting tri-partite hyper-graphs using classical network measures like characteristic path length and clustering coefficients. Subsequently, they developed a network of tag co-occurrence and investigated its statistical properties, focusing on correlations in node connectivity and pointing out features that reflect emergent semantics within the folksonomy. Cattuto, Baldassarri, Servedio and Loreto (2008) introduced three measures of tag relatedness: tag co-occurrence, cosine similarity of co-occurrence distributions, and FolkRank, an adaptation of the PageRank algorithm to folksonomies, and computed each measure on tags from a large-scale dataset crawled from Delicious.com. Their results clearly exposed different characteristics of the selected measures of relatedness, making them applicable to different subtasks of knowledge extraction such as synonym detection or discovery of concept hierarchies.
Oldenburg, Garbe, and Cap (2008), exploited cross-space similarities of folksonomies to improve a variety of tagging use cases to overcome the limited view of single folksonomy analysis. Their report presented the similarities and convergent aspects of cross-space analysis of co-tag spaces for five well-established social classification services for tagging of bookmarks (del.icio.us, BibSonomy bookmarks), and publications (BibSonomy publications, CiteULike, Connotea). Markines et al. (2009) built an evaluation framework to compare various general folksonomy-based similarity measures derived from established information-theoretic, statistical, and practical measures. Ke and Chen (2012) discovered the implicit hidden structures embedded in the social tag space of 1,600 articles from 15 library and information science journals using social network analysis. They analysed centrality degrees, co-used tag categories, role sharing among tag categories and others using various techniques of social network analysis. Feicheng and Yating (2014) explored the characteristics of co-occurrence network of social tags based on social network analysis. They found that the structure of Web space represented by tags can reflect reality of knowledge area.
Kipp and Campbell (2006) examined tagging using informetrics methods to examine frequency of tag usage and tag patterns over time. They also used multidimensional scaling to examine the patterns in co-tag usage in tags assigned to particular URLs. They suggested that differences in term usage which were exemplified in the multidimensional scaling graph as different clusters of synonyms might be a sign of different user groups present in the tag cloud. Muller (2007) confirmed this result with a different data set and different user groups from an IBM based tagging system. In her dissertation, Kipp (2009) explored the unique distribution and patterns of social tags from popular collaborative bookmarking sites. She employed multiple mathematical methods such as linear trajectory tracing and multidimensional scaling to explore the patterns of social tags observed in delicious and CiteULike.
Knautz, Soubusta, and Stock (2010) incorporated tag information into an information retrieval system based on tag co-occurrences and subsequent clustering in an effort to help users gain access to digital data through information visualisation in the form of tag clusters. Andrews, Zaihrayeu and Pane (2012) suggested a classification system that represents the semantic annotation of user tag terms based on the object-subject-predicate relationship. Kashoob and Caverlee (2012) suggested a methodological framework to analyse different aspects of social bookmarking communities over time. By analysing a large set of tagging data, over 13 million postings, they inspected the temporal dimensions of social bookmarking activities and explored the dynamics of bookmarking community formation, evolution, and dissolution.
Several researchers tried to identify the semantic relationships between objects by analysing user generated social tags. For example, Al-Khalifa and Davis (2006) claimed that social tags would carry more semantic value than automatically extracted keywords. They demonstrated that social tags can be used in the process of generating semantic metadata to annotate Web resources. Kipp and Joo (2010) applied structural equation modelling in Web structure analysis using social tagging data. They tested if the structural equation modelling would be applicable to analyse the correlative relationships amongst the nodes, and found the promising possibility that social tagging can be used to represent the semantic relationships between Websites. However, their analysis was preliminary, limited to simply correlation calculation between Websites, while complex hierarchical relationships were not explored. Cantador, Konstas, and Jose (2011) investigated the underlying concepts of tags and mapped them to semantic relationships based on external knowledge bases (e.g., Wikipedia) using the W3C Linking Open Data initiative. Recently, Xu et al. (2014) suggested a method to compute semantic relatedness between Flickr image items by analysing the co-occurrence social tags.
The previous studies have contributed greatly to exploring different aspects of collaborative tags in different situations. Also, a multitude of mathematical methods have been proposed applicable to social tagging research. However, only a few studies used multivariate statistics techniques. Especially, structural equation modelling has not been widely introduced in the field of Web space studies. Kipp and Joo (2010) tested structural equation modelling with a small set of tagging data. This study enhances their method to analyse a larger data set with more complicated hierarchical model. More importantly, this study introduces how to analyse second-order relationships of Web space constructs, which is one of the unique contributions of this study. This study is one of the few studies to apply a higher-order confirmatory factor analysis using structural equation modelling to investigate the semantic structures discussed in other Web space studies.
Research questions
This study selected library and information science Websites, including libraries, schools, and organizations. The study addresses two research questions in relation to Web space analysis of the library and information science field:
- What is the overall distribution of sites in the library and information science field Web space based on social tags?
- How do social tags represent the hierarchical structure of Web space in the field of library and information science?
Method
Data collection
In this study, we reused tagging data collected in 2011, which contains a tag frequency matrix for a set of seventy-eight library & information science related Websites including library and information science schools, iSchools (ischools.org), library organizations, public libraries, academic libraries and special libraries (Appendix 1). We reused datasets to empirically test a new methodological approach, structural equation modelling based analysis, suggested in this study.
The dataset was collected using a tag crawler, delicious.py, which was designed to collect a large set of tagging data from Delicious.com. The basic component of Delicious.com was the bookmark entry or post made by each user upon encountering a Website of interest. A user typically had many posts which bookmark different sites; in addition, a Website can be bookmarked with Delicious.com posts by many different users. Each post consists of a URL, an optional extended description, a set of tags, a username and the date on which it was posted. Posts may be collected by user, by tag, or by URL. This dataset was collected before the substantial interface changes to Delicious.com after its sale by Yahoo in 2011 (Arrington 2011). Delicious.com was chosen for this study because it provided more users and tags per item than most other similar tools at the time. It also provided a broad folksonomy and few limits or restrictions on tag formation.
The dataset contains the tags collected from prominent schools, organizations and public libraries from the United States. The selected seventy-eight Websites are grouped in ten predefined categories:
- iSchool, not library and information science school,
- iSchool and library and information science school,
- library and information science, not iSchool,
- academic organization,
- special organization,
- state library association,
- public library,
- special library,
- private university academic library, and
- public university academic library.
In addition, those ten categories are grouped into three higher-level dimensions: school, organization, and library. The data for each URL consist of posts by up to 2,050 users and included their tag lists, date of posting and any additional description provided. Delicious.com no longer allows access to data beyond 2,050 entries at any one time, but previous research has shown that as few as 100 users is sufficient to ensure some stability in the tag cloud (Golder and Huberman 2006) and even fewer users are necessary to generate useful terms (Kipp 2009). Sites chosen for this study had been posted by an average of 290 users, a minimum of five and a maximum of 2,050 accessible posts. The total number of tags used ranged from a minimum of twenty-five to a maximum of 7,014 (average 864). The total number of unique tags used ranged from a minimum of twenty-one to a maximum of 1086 (average 184).
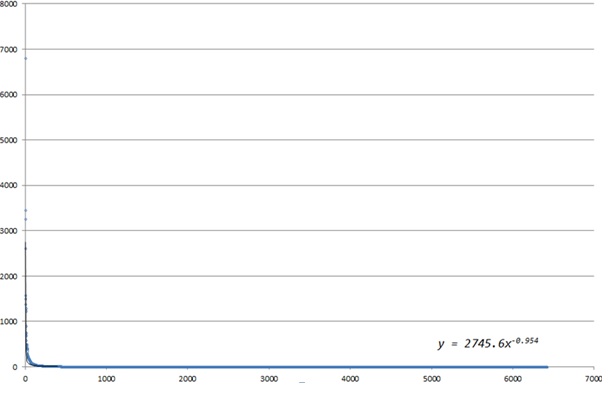
In this study, we extracted 630 core tag terms which occurred at least six times amongst the selected library and information science sites. The reasons why we selected 630 frequent tags are two-fold: First, tagging patterns were investigated to find the appropriate number of tags to be analysed. Tagging data showed a typical power law pattern, a so called inverse J pattern that entails a long tail (Yi and Chan 2009; Chen and Ke 2013). The following power function was obtained from the tag distribution.
y = 2745.6x-0.954 (1)
The observed long tail consists of tags appearing only once across the sites. Those one-time appearing tags are usually considered less meaningful. It has been recommended to remove those infrequent tags in the data analysis (Xu et al. 2014; Syn 2014). This study removed those long tails to achieve data parsimony. Figure 1 shows the tag frequency distribution, which exhibited a typical power-law pattern.
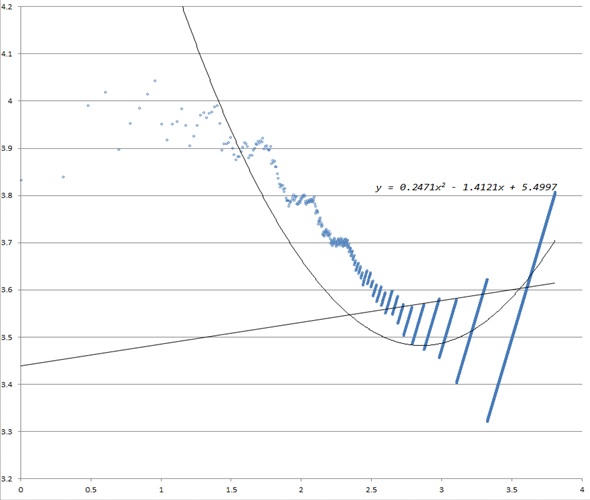
Second, to determine a cut-off point for the long tail, we analysed token distribution. Han, Joo and Wolfram (2014) suggested a novel method to identify a cut-off point for Zipf law pattern data. They used an inflexion point of token distribution to determine a criterion for selecting meaningful terms. This study also analysed tag term token distribution. To easily interpret the data and determine a cut-off point, the data were transformed using logarithms. The distribution of tokens exhibited a "V" shaped curvilinear pattern (Figure 2). A polynomial estimation graph was obtained from the observed pattern as follows:
y = 0.2471x2 - 1.4121x + 5.4997 (1)
From the observed pattern, a cut-off point was calculated as 2.85, which indicated about 707 terms (≈102.85). The closest number of terms that occurred more than five times across the sites turned out to be 630 terms, which were selected to be analysed in this study. In this way, common tag terms were extracted, which frequently co-occurred across the sites. In addition, we were able to achieve parsimony of the dataset as well as lower skewness and kurtosis.
Then, the original dataset was transformed using square roots and logarithms sequentially to further control for skewness and kurtosis. The distribution of the original dataset was extremely skewed because of the nature of tag frequency distributions which form a power law. Logarithms reduced the skewness significantly in the original dataset. However, the transformed data still remained non-normally distributed. Therefore, the authors employed unweighted least square method to fit the model in the structural equation modelling analysis.
Data analysis strategy
The data analysis consists of two steps: 1) the exploration of library and information science Web space using multidimensional scaling of the tagging data; and 2) the confirmation of the semantic structure of library and information science Web space based on confirmatory factor analysis. First, multidimensional scaling was selected as a method to explore the spatial distribution of Websites in the library and information science based on tagging frequency data. Multidimensional scaling refers to a 'set of mathematical techniques that enable a researcher to uncover the hidden structure of data bases' (Kruskal and Wish, 1978, p. 5).
These techniques use proximities among a set of objects (in this study the 78 Websites) as input, where proximity is a number which indicates how similar or how different two objects are (Kruskal & Wish, 1978). Multidimensional scaling is often used in information visualisation using 2-dimensional or higher dimensional maps, based on the calculation of dissimilarities in data. In multidimensional scaling, objects of interest are usually projected on a two-dimensional or three-dimensional spatial map to show how closely the objects are located to each other in the space.
In this study, a three-dimensional multidimensional scaling map was drawn using the Euclidean distance. We computed dissimilarities between Websites based on the tag frequency pattern of each Website, and then applied multidimensional scaling using XLSTAT, a software package that produces a 3-D visualisation of a multidimensional scaling map. By exploring the 3-D output of the selected 78 Websites mapping, we clustered the Websites belonging to the same category to investigate whether the Websites in the same category tend to be located adjacent to each other in the Web space based on tagging patterns.
Second, structural equation modelling is applied to confirm the exploratory findings from multidimensional scaling and to investigate more detailed semantic relationships among the selected entities. Structural equation modelling, which is also known as the covariance structural model is a multivariate statistical analysis technique for establishing, estimating, and verifying relational models (Hoyle and Panter, 1995). In structural equation modelling, researchers need to come up with their own conceptual model based on their exploratory findings, assumptions, or theories. Then, structural equation modelling confirms the predefined conceptual model by fitting the model with the empirical observation data. In this study, a confirmatory factor analysis is employed to confirm the semantic structure of library & information science Web space. A confirmatory factor analysis is used to “confirm” a particular pattern of relationships predicted on the basis of a predefined model or structure (Kim, 2007)
In this study, two levels of conceptual models are established as shown in Figures 8 and 9. The first-order model consists of ten predefined categories and their associated Websites as in Appendix 1. The main objectives of the first-order model analysis are to investigate the relationships between the ten categories and the seventy-eight Websites, which is represented by factor loadings (Λ matrix), and the correlation amongst the ten categories, which is represented by correlation coefficients (Φ matrix). This first-order model can be presented by multiple equations in structural equation modelling. Equation 1 includes the parameters of factor loadings (λij), which show the numerical relationships between the latent constructs (categories) (ξj) and observations (tag frequency patterns for each site) (Xi). Specific numbers of parameters to be estimated are addressed in the Results section.
Xi = λij * ξj + δXi (3)
where ξj = latent construct (category), λij = factor loading, δXi = unexplained variation.
After the first-order model, the authors applied a second-order confirmatory factor analysis to examine higher semantic structure. In this second-order model, the three higher constructs, school, organization and library were added to the model (see Figure 9). In the second-order model, the hierarchical relationships between the ten first-order constructs and the three second-order constructs are mainly investigated. The uniqueness of this study lies in that it attempts to investigate hierarchical relationships among different categories in the Web space. In this case, the higher constructs (school, organization, and library) are exogenous, the while the ten constructs are endogenous. Thus, in the second-order model, the ten constructs are presented as η (endogenous side) in equations, while three higher constructs are presented as ξ (exogenous side; School(ξ1), organization(ξ2), and Library(ξ3)). Then, ten parameters of Γ matrix, which relates three second-order constructs to ten first-order constructs, was estimated. The second-order model can be summarised as the sequential combination of first-order equations and second-order equations. The specific numbers of parameters to be estimated are addressed in the Results section.
First-order model:
X = ΛX(η) + ε (4)
where ΛX = factor loading matrix, η = first-order construct (endogenous), ε = unexplained variance.
Second-order model:
η = Γ(ξ) + ζ (5)
where η = first-order construct (endogenous), ξ = second-order construct (exogenous), Γ = structural relationship between first-order and second-order constructs, ζ = unexplained variance.
Results
The social tag patterns in the selected 78 Websites were initially explored using multidimensional scaling. Using the Euclidean distance model, a three-dimensional plot was drawn as shown in Figure 3. The multidimensional scaling analysis exhibited a fair mapping result: Stress value = 0.9094, R2 = 0.9829. The MDS analysis results showed that the Websites belonging to the same category were closely located on the map. Schools sites including three different types of schools (library and information science programme not iSchool, iSchool with library and information science programme, and iSchool not library and information science programme) were clustered closely to each other. Also, academic libraries and public libraries formed their own groups in the space respectively. organization sites seem to be located adjacent to each other, and in particular, State Library Association sites showed strong coherence around the centre of the three-dimensional space. Figure 3 shows the overall structure of Websites in the library & information science field based on social tag information.
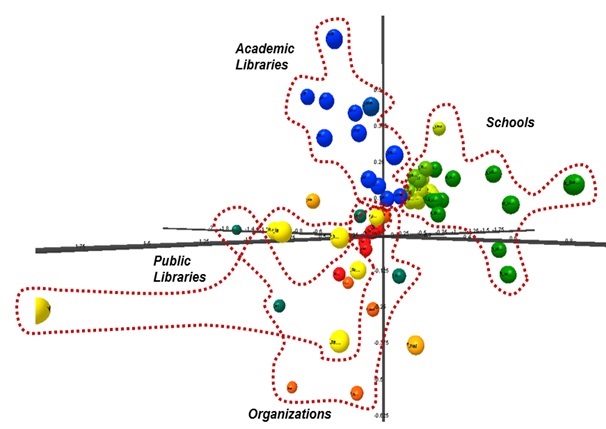
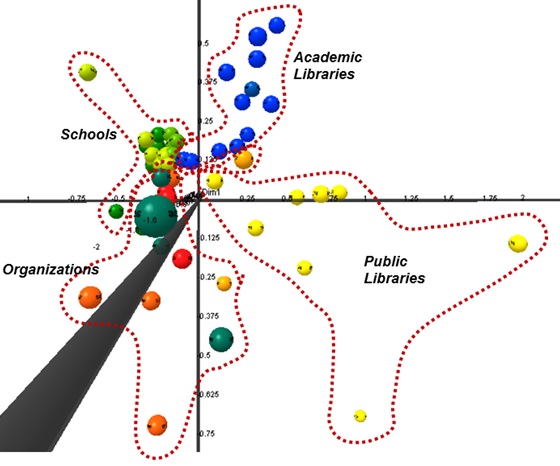
Figure 4 below shows a rotated view to provide a better view of distinct public library sites and organization sites. As shown in the map, the public library sites occupy a specific region in the multidimensional scaling graph which is separate from the regions of other groups. organization sites are also distinctly separate from school sites and academic libraries. However, these overall structure maps might not be able to show the group of special libraries distinctly because of the obscuring effect of overlapping nodes in a three-dimensional view.
To further explore the detailed structure of the nodes, we enlarged the map. Figure 5 shows the enlarged region of school sites. Each type of school site is clustered separately in the region of school sites. Although all school sites are located near each other in the multidimensional scaling graph, on enlarging it was clear that they formed separate groups by type in the school site region.
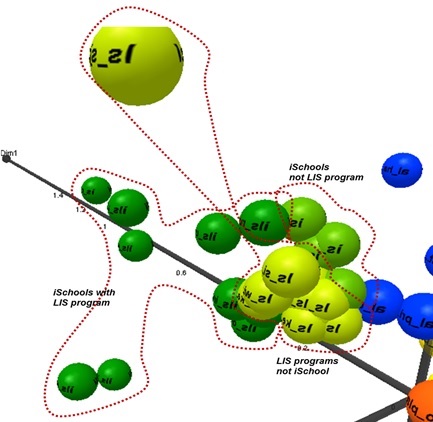
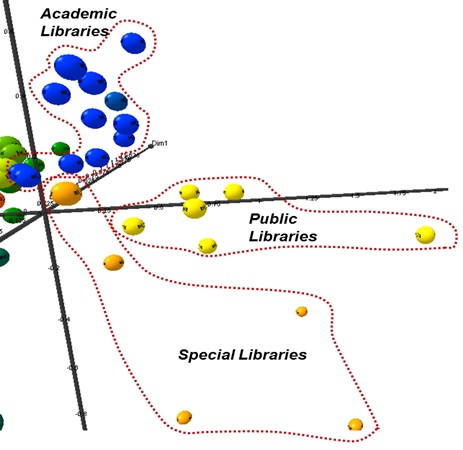
Figure 6 represents the locations of library Websites including academic, public, and special libraries. Each library type formed its own cluster. Academic library sites are densely clustered, whereas special libraries were comparatively dispersed. The public library Websites are also relatively densely grouped, forming a separate cluster.
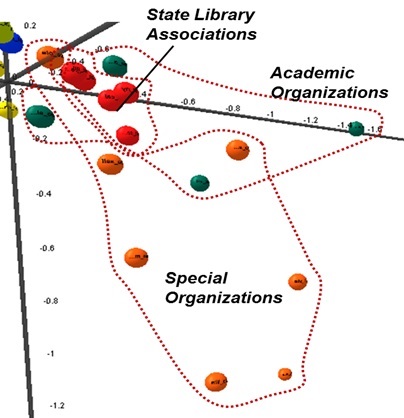
This study also examined the organizational region separately in detail. As shown in Figure 7, the sites of each category are projected as a group on the map. Compared to school sites and library sites, the organizational sites do not show clear distinctions between groups. Even after several attempts of rotation of the three-axes dimensional view, the authors failed to find a view that clearly separates the groups without overlapping. That is, there exists some overlapping of nodes in terms of tag patterns in the LIS Web space. State library Websites showed strong coherence clustering densely together whereas academic organizations and special organizations were sparsely dispersed.
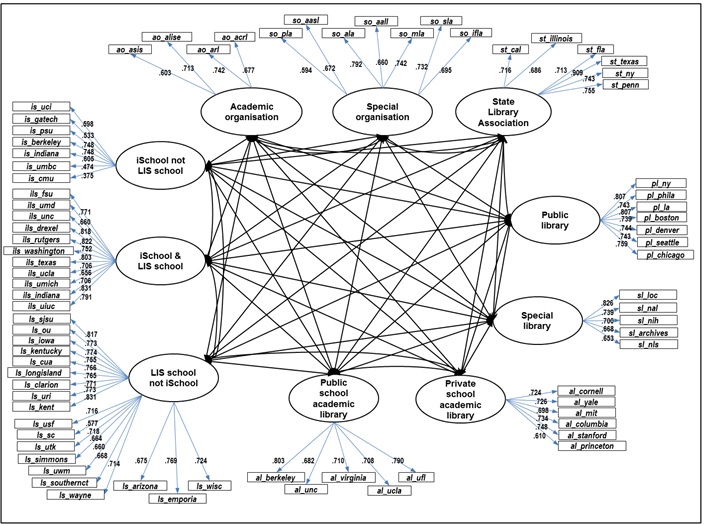
Next, to explain the structure of Web space based on tag information, a confirmatory factor analysis was applied using structural equation modelling. Ten constructs were identified using seventy-eight Websites selected through consultation with two library and information science domain experts. The first-order model is comprised of seventy-eight observed variables (Websites), eighty-eight latent variables (ten constructs and seventy-eight residuals). The model involved eighty-eight exogenous variables and seventy-eight endogenous variables. A total of 201 parameters were to be estimated, including sixty-eight factor loading estimates, forty-five covariance estimates and eighty-eight residuals. Figure 8 presents the identified model to explain the structure of Websites in the field of library and information science. Each construct was loaded with four to nineteen items respectively. Using AMOS 18, the authors fit the model using the variance-covariance matrix derived from tag information. To freely fit the model from the assumption of multi-normality, the unweighted least squares method was adopted.
The overall fit of this structural equation model was tested using the following criteria of the goodness-of-fit indices: GFI>0.90, AGFI>0.85, NFI>0.90, RMR<0.05 (Kim, 2007). The structural equation model of the suggested library and information science structure exhibits an adequate fit: GFI=0.977, AGFI=0.976, NFI=.971, RMR=0.001. The factor loadings of items to their associated constructs ranged between 0.374 and 0.909. Two cases including Department of Information Systems, University of Maryland—Baltimore County and School of Information Systems and Management, Carnegie Mellon University exhibited relatively low factor loadings of less than 0.5. The Department of Information Systems, University of Maryland—Baltimore County, whose programme name is information systems, showed a different tag frequency pattern focusing more on system-related terms. Also, the School of Information Systems and Management, Carnegie Mellon University differs from other iSchools showing more frequencies related to systems and ;management terms. Except for these two cases, all the factor loadings estimated in the model were higher than 0.5, which revealed that the identified constructs were well explained and the associated items had been placed in the correct category. Factor loadings estimated between constructs and associated Websites in the model are presented in Appendix 2.
Correlation coefficients between constructs were also computed from an Φ matrix. Table 1 shows the correlation coefficients between constructs. The correlation coefficients between similar constructs turned out comparatively high. For instance, iSchool with library and information science programme and library and information science programme not iSchool, which share the common characteristics of library and information science programmes, showed high correlation coefficients, 0.830. iSchool and library and information science school and iSchool not library and information science school, Special organization and Academic organization, and Private school academic library and Public school academic library also exhibited relatively high correlation coefficients, 0.895, 0.986, and 0.976 respectively. Conversely, the correlation between less relevant constructs showed lower correlation coefficients, such as iSchool not library and information science programme and State library association (0.021) and iSchool not library and information science programme and Public library (0.164). This structural equation modelling result reveals that social tagging information associated with Websites can show similarities between the structure of Websites and real world structure in the library and information science field.
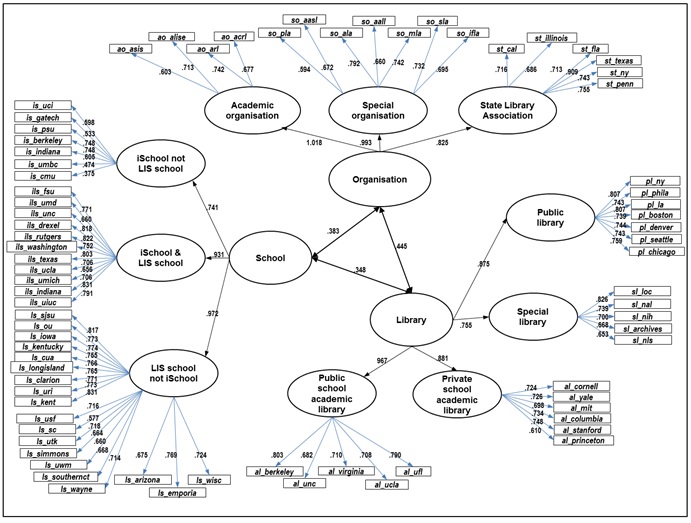
To further scrutinise the higher-order semantic structure of Websites in the library and information science field, a second-order confirmatory factor analysis was conducted using structural equation modelling. Along with ten constructs, three second-order constructs were added to the first-order model including School, Library, and organization. A total of 169 parameters were to be estimated, including seventy-five factor loading estimates, three covariance estimates, and ninety-one residual estimates. Figure 9 presents the identified second-order model to explain the semantic structure of library & information science field Websites. Again, the unweighted least squares method was adopted. The structural equation model of the second-order confirmatory factor analysis shows an adequate fit: GFI=0.970, AGFI=0.968, NFI=.962, RMR=0.001 (where criteria for the goodness-of-fit: GFI>0.90, AGFI>0.85, NFI>0.90, RMR<0.05).
For this second-order model, the correlation coefficients between the second-order constructs were also calculated. The correlation coefficients between the higher order constructs was moderately high, and in particular, the correlation coefficient between Library and organization was high at 0.445. Pearson r was 0.348 between School and Library, while it was 0.383 between School and organization.
| iSchool & LIS S. |
iSchool not LIS S. |
Acad. Org. |
Special Org. |
State Lib. A. |
Public Lib. |
Special Lib. |
Private U. Acad. Lib. |
Public U. Acad. Lib. |
|
|---|---|---|---|---|---|---|---|---|---|
| LIS S. not iSchool |
.895 | .609 | .430 | .402 | .327 | .246 | .231 | .354 | .412 |
| iSchool & LIS S. |
.830 | .437 | .322 | .221 | .214 | .227 | .334 | .417 | |
| iSchool not LIS S. |
.365 | .160 | .021 | .164 | .221 | .339 | .418 | ||
| Acad. Org. |
.986 | .807 | .346 | .334 | .460 | .492 | |||
| Special Org. |
.868 | .366 | .380 | .369 | .412 | ||||
| State Lib. A. |
.345 | .215 | .326 | .354 | |||||
| Public Lib. |
.740 | .763 | .805 | ||||||
| Special Lib. |
.575 | .639 | |||||||
| Special Lib. |
.639 | ||||||||
| (Abbreviation: S.- School; Lib.-Library; U.- University; Org. - organization; A.- Association; Acad. - Academic) | |||||||||
Discussion
This study suggested a new statistical approach in tag structure studies, and answered two research questions empirically. First, social tags show different dimensions in the Web space of the library and information science field, ranging from including library and information science Programme Not iSchool, iSchool with library and information science programme, iSchool Not library and information science Programme, Academic organizations, Special organizations, State Library Associations, Public Libraries, Special Libraries, Private University Academic Libraries, and Public University Academic Libraries. Second, social tags confirmed the real world structure in the field of library and information science. That is, the structure of the tagging data shows similar connections to those present in the real world despite the fact that taggers may not be domain experts in the field of library and information science.
In this study we examined two research questions which would allow us to determine the effectiveness of structural equation modelling as an analysis method for tagging data, in comparison with multi-dimensional scaling.
Our first research question examined the distribution of tags using multidimensional scaling.
RQ1: What is the overall distribution of sites in the library and information science field Web space based on social tags?
We found that the overall distribution of sites in the library and information science field based on an analysis of tag space showed a strong similarity between clusters found in a multidimensional scaling graph based on tag usage applied to various library and information science organizations and connections between these organizations present in the field.
Our second research question examined structures in the tagging data using structural equation modelling.
RQ2: How do social tags represent the hierarchical structure of Web space in the field of library and information science?
We found that latent relationships underlying tag terms can be used to represent the relationships between the selected Websites. Structural equation modelling calculated correlation coefficients between the Websites. It enables us to numerically represent how the Websites are associated with each other, and consequently show the structure of Web space in the field of library and information science. The results revealed that closer relationships exist between the Website groups with similar characteristics. More importantly, we analysed the hierarchical structure of Web space by using a second-order model of structural equation modelling. The second-order model numerically identifies higher level latent concepts in the Web space, such as organization, school, and library.
Methodological implications
This study suggested a new statistical approach, structural equation modelling, in tag structure studies, and found that structural equation modelling also can be a useful data analysis method to investigate the structure of data in informetrics studies. In addition, the authors found that structural equation modelling has some advantages over multidimensional scaling. First, as we have seen above, structural equation modelling enables us to compute correlation coefficients between constructs. In multidimensional scaling, it is not possible to define the numeric relationships between different groups. In structural equation modelling, however, we can easily come up with the correlation coefficients between different constructs which can be derived from the Φ matrix of the structural equation model. Second, structural equation modelling is a more flexible and effective way to investigate hierarchical structures of data than multidimensional scaling.
This study investigated the hierarchical relationships among different levels of categories on the Web space. If we design second- or higher-order models, complicated semantic structures of data can be analysed using structural equation modelling. Structural equation modelling offers hierarchical analyses which can be used to calculate numeric relationships between different higher order constructs, which enables quantitative semantic Web analysis based on social tagging information. Structural equation modelling can be useful to numerically examine hierarchical relationships in various browsing categories used in the Web. Third, structural equation modelling results are easier to interpret than multidimensional scaling because it provides more detailed information about a construct and its associated variables. The confirmatory factor analysis results present factor loadings (Λ matrix), which explain how each variable is loaded by a construct. In multidimensional scaling analysis, researchers rely on intuitive interpretation of clustering, and it can be more difficult to determine how each Website is associated with the identified group. Structural equation modelling analysis estimates a specific relationship between a Website and its corresponding construct. Fourth, as in multidimensional scaling, structural equation modelling can be applied freely from the assumption of multi-normality of variables when using the unweighted least squares model fitting method. Usually, the distributions of tagging frequency are skewed even after data transformation using mathematical functions such as square roots and logarithm. This non-normality has been an obstacle to employing multivariate statistical methods in informetrics studies. However, structural equation modelling can use the unweighted least squares method as a model fit function for non-normally distributed data. Thus, structural equation modelling can be applied to a data set of social tagging data regardless of the non-normality of the dataset.
However, a confirmatory factor analysis using structural equation modelling has a critical limitation because of its nature as confirmatory analysis. Despite the strengths of structural equation modelling method, it is not appropriate for initial exploration of a dataset. Basically, structural equation modelling allows researchers to fit an identified model to empirical data. Thus, to identify the model, researchers need to predefine the model based on domain knowledge in a specific area, which requires initial analysis of the data using other methods. That is, without a pre-defined model structural equation modelling cannot be used. Therefore, the authors suggest using multidimensional scaling and structural equation modelling together in informetrics studies. Multidimensional scaling is an effective and easy-to-apply method for exploring the nature of data, while structural equation modelling is an optimal method to elaborate and confirm the observed patterns of a dataset. Researchers could apply multidimensional scaling to initiate the analysis of a specific dataset to see the distribution of patterns. Then, structural equation modelling would be a strong method to elaborate the initial findings from multidimensional scaling, and confirm the findings or ideas empirically.
Theoretical and practical implications
Mathematical modelling of tag data has been conducted since the beginning of tag research. Many studies have examined mathematical models using univariate statistics, network analysis and graph theory. Some studies also used co-tag analysis and multidimensional scaling to examine tag data. All of these studies revealed the structures which are being created by individual taggers as they tag items on social bookmarking sites and especially as multiple taggers assign tags to the same item.
Previous studies have examined tags as index terms and suggested ways to enhance the indexing properties of tags. This study examines structures present in the aggregate collections of tags associated with specific items and uses statistical modelling techniques to examine these structures. These techniques could be used to help select clusters of related tags based on the frequency of their use together on strongly correlated Websites. Terms which occur frequently together on strongly correlated Websites suggest strong semantic ties which would be useful for enhancing information retrieval of related Websites in fields outside of library and information science. Additionally, such strong ties would be useful in developing semantic Web applications which rely on linkages between relevant items.
Limitations of the study
First, although the study analysed seventy-eight Websites and 630 core tags, the sample and tag size could be enlarged to better generalise the results. Although we selected core tags by analysing term token distribution, there is still a further need for more sophisticated and effective method to remove unnecessary long tail terms in social tag analysis. Second, the dataset used in this study was collected in 2011 when Delicious.com had a different interface and was still in common use as a social bookmarking system. Changes to the interface, mean that the data may no longer represent current practice on Delicious.com. However, this data thus represents a snapshot of a specific time period in Delicious.com's lifecycle as a social bookmarking system. Delicious.com was originally chosen for this study because it was one of the most popular social bookmarking sites for many years and provided: a) more tagging information than other similar sites and b) more variation in tagging behaviour as it used a broad rather than a narrow folksonomy and had few limits or restrictions on tag formation. This study thus remains relevant as a snapshot of tagging structures present in a system with a broad folksonomy and free tagging at a specific time.
Conclusions
While previous studies have used mathematical modelling techniques to examine structures in tagging, relatively little research has used multivariate statistical methods, especially factor analysis and structural equation modelling. This study introduced the application of confirmatory factor analysis techniques in tag structure studies and suggests the use of the unweighted least squares model to overcome the problems of non-normality in tagging data.
This study also demonstrates that tagging data can be used to explore the linkages between Websites and their corresponding organizations. While analyses of links and co-links between Websites have been used for competitive analysis and to define potential competitors in a field, little research has examined this possibility in tagging data or the use of multidimensional scaling and structural equation models to enhance information retrieval and analysis of Web structures.
The critical contribution of this study lies in the fact that the combination of exploratory and confirmatory analysis can be applied to various contexts that involve text analysis. In particular, the suggested mixed approach can be used to analyse user communications or tagging data collected from other social media, such as twitter, Flickr, and Youtube. Previous studies of tagging or social media have analysed statistical features of usage, such as view statistics and access patterns (e.g., Cheng, Dale, and Liu, 2008; Zink, Suh, Gu and Kurose, 2008), or explored user generated text focusing on context, sentiment, and opinions using text mining (e.g., Choudhury and Breslin, 2010; Siersdorfer, Chelaru, Nejdl and San Pedro, 2010; Schultes, Dorner and Lehner, 2013; Thelwall, Buckley and Paltoglou, 2012, 2013). However, those studies relied mainly on exploratory analysis, which uncover patterns of something observed from social media text. The confirmatory approach will provide richer results of social media text analysis. Most importantly, structural equation modelling-based text analysis will enable researchers to further analyse the relationships between latent constructs derived from text mining, which is the significant methodological improvement in text analysis.
Future research can be extended to other types of Web data derived from different social media, such as Twitter, Flickr, and Instagram to examine the differences between narrow and broad folksonomies using the analysis methods described above. For example, user tags and other descriptive text (e.g., title, description, etc.) in Flickr items can imply structural relationships amongst items. More important, the researchers plan to apply the suggested method to a larger dataset. The methods suggested herein, structural equation modelling-based analysis, can be applicable to detect hidden hierarchical semantic structure underlying the text data generated by users.
About the authors
Soohyung Joo is an assistant professor in the School of Information Science at the University of Kentucky. His main research
areas include digital libraries, information retrieval, information system design, and data analytics. He can be contacted at: soohyung.joo@uky.edu.
Margaret E.I. Kipp is an associate professor and member of the Knowledge Organization Research Group, School of Information Studies, University of Wisconsin-Milwaukee. Her research interests include social tagging, information organization on the Web, classification
systems, information retrieval, collaborative Web technologies and the creation and visualization of structures in information organization
systems. She can be contacted at kipp@uwm.edu