A framework for constructing optimisation models to increase the visibility of organizations' information in search engines
Andrej Miklosik, Nina Evans, Stefan Zak and Julia Lipianska.
Introduction. To make their information available to users, organizations need to be aware of the impact of time-evolving factors affecting the organic search visibility of their websites. The current methods of assessing factors’ individual contributions to search ranking are not viable.
Method. The objective of this paper is to create a universally applicable, flexible and time-resilient framework for constructing optimisation models to increase organic search engine visibility and information findability of organizations’ information. This is achieved by i) testing the contribution of selected factors to the search engine results page (SERP) rankings for diverse types of keywords, ii) creating the framework, iii) testing and enhancing the framework and iv) identifying the constraints of the framework.
Analysis. Models were created, starting with the collection of extensive data for three industries (business, finance, information technologies). Three search phrases were defined for each industry, formulated as a question.
Results. The framework is usable for future research on improving the findability of organizations’ information. Furthermore, the framework can be implemented in organizations in various industries to enhance their chance of being found when a user searches for information.
Introduction
Search engine visibility, or search visibility, represents a key factor in achieving the marketing and business goals of an organization. Its importance exceeds the virtual borders of digital marketing and, more specifically, search engine marketing. Because of the changing information search behaviour of customers, although not exclusively in business-to-consumer markets, organizations need to ensure that they appear at the top of the search engine results pages. Thus, organizations need to implement search engine marketing and search engine optimisation tools.
In this paper, the authors focus on improving organic search visibility to continuously enhance the findability of their information. To define priorities of the optimisation, actual ranking factors that are periodically published by relevant industry bodies can be utilised. These factors, however, change across the studies and the initiatives to determine the individual correlation of each factor with the ranking results within the search engine results pages often do not produce statistically reliable results. Moreover, the situation changes in time and the ranking is dependent on the search phrase, location and search engine.
The primary objective of the paper is to present a framework for improving information findability by constructing optimisation models to increase the organic search engine visibility of organizations in various sectors. The objectives of the study were as follows:
- to examine the factors influencing organic search visibility;
- to create a framework for gathering relevant data about key organic search visibility factors and modelling their impact on search engine positions for specific keywords;
- to ensure that the framework is robust, universally applicable, flexible and time-resilient; and
- to prove that the framework generates results specific to each segment, keyword and time.
To prove the applicability of the framework, the authors have followed the suggested steps and analysed search engine results pages for various search phrases within the information technology, business, and finance sectors. Models were created, using data collected in three different time periods. The segment, search engine, platform, location and time-specific results that were generated suggest the influence of different ranking factors on each search engine results page.
Theoretical background
Information search behaviour
Ensuring visibility of an organization’s resources in organic search results is necessary because of the changing behaviour of users actively looking for information within their purchasing decision-making process. The first search engines – Excite (excite.com) (1993), Yahoo (yahoo.com) (1994) and Google (google.com) (1998) – changed the way of accessing information from the growing network of websites (Stern, 2015). Users have started relying on full-text search instead of using other sources of information about companies such as online directories. These are still available but with minimum impact compared to online search. In the online directories, users were going through a set of categories using a top-bottom approach. First, they selected a top-level category where they believed the organization or product can be found. This category often comprised a set of subcategories and this could continue depending on the depth of the taxonomy. At the bottom level, a list of organizations from the last subcategory could be found and after selecting one, the user could see its details, usually including both structured and unstructured information, such as description, sector, contact details, list of products, link to the website of the organization, etc.
In the big data age, users need to deal with a tremendous amount of information, which can be collected from various types of sources (Li, Huang, Wang and Wu, 2015). Search engines have been developed to address the issue of information overload, providing the most relevant results to people searching for information. The process of finding information about products and organizations is therefore now more straightforward. Search engines offer the most relevant results at the top of results pages and users only need to enter keywords relevant to what they are looking for. Because of this simplicity and improving relevancy of results, the use of search engines has increased significantly. In September 1999, one year after being launched, Google was already answering 3.5 million search queries daily (Battelle, 2005). The last confirmed numbers from 2012 state that there were 3.5 billion searches performed on Google daily, equating to 1.2 trillion searches a year, worldwide (Smart Insights, 2018b). The growth has been exponential; in 2000, Google users made 14 billion queries a year (Sullivan, 2016); by 2012, the number of searches had increased by 91 times. In 2016, Google announced that it handles trillions of searches a year worldwide, thus the figure could be safely assumed to be two trillion or more (Sullivan, 2016).
More than ever before, users are also using their mobile devices to search for information. In most countries and demographic groups, there are more searches performed on mobile devices than on desktops, with India, Mexico and Indonesia having up to four times higher smartphone audience compared to desktop audience (Smart Insights, 2018a). Also, users often use more devices to access the Internet, perform their work tasks, and, most importantly, search for information, often in parallel and multitasking (Du and Spink, 2011; Google, 2012). Online search is often used to switch between different devices. The information search starts on one device and online search provides the way of retrieving the last accessed resources on the second device after returning to the research (Google, 2012). Search is often local as people are looking for the information outside their homes. New technologies are also changing the way users enter the search phrase. Voice search is on the rise with people using their mobile devices and voice-activated speakers to enter the question and receive the answer. It is expected that 50% of all searches will be voice searches and 30% of all searches will be done without a screen by 2020 (Gartner, 2016; Olson, 2016). Consequently, search phrases become longer and are often formulated as questions.
An average user can also distinguish between paid and organic results, although often just intuitively. By building the experience of getting more relevant results when clicking on the organic/not-paid results, the user starts avoiding the paid results. A large-scale field experiment has confirmed that new and infrequent users are positively influenced by paid search results (advertisements), however, the purchasing behaviour of more frequent users is not influenced by advertisements (Blake, Nosko and Tadelis, 2015). Thus, for organizations it is crucial to ensure that the information within their online resources is easily found. This needs to be ensured both for searching on desktop and mobile devices.
Search visibility
The impact of implementing digital marketing strategies on the economic efficiency of organizations has been well demonstrated (Dorcak and Delina, 2011; Yang, Shi, and Wang, 2015). Search engine marketing has established itself as a substantial part of digital strategies, and its influence on performance of companies has been documented (Tomasi and Li, 2015). The research on search visibility and factors influencing it started two decades ago and was intensified in the second stage of the search engine optimisation evolution starting in 2013 (Feeny and Arsenault, 2008; Raunio, 2008; Thurow, 2003, 2007; Weideman, 2009; Weideman and Chambers, 2005). Presently, it is an object of interest of prominent academics and practitioners.
Search engine optimisation focuses on achieving top positions in organic search results. Researchers and practitioners of this area try to understand how organic results are created and different resources offered to users are ranked. Google (google.com), Bing (www.bing.com), Yahoo (yahoo.com), and other search engines base their business on offering the best search results to their users. If they are good at this and the results offered meet the needs of their users and help them find required information, they will continue to use them. The most relevant content (images, videos, products, links to websites) is displayed at the top of search results. Search engines use various factors to create the rank of content listed in search results. Only a few of the websites can be featured on the first search engine results page and obviously, only one can be the first. To increase the visibility of organizations' information in search engines, higher ranking of their own content for the most relevant and popular keywords needs to be achieved.
The role of search visibility can be seen within these three key areas: it enables the organization to attract new visitors potentially looking for its products online; it fosters the transition between the offline and online worlds by reducing the boundaries between the brick-and-mortar and online shopping (Kates and Greenberg, 2013) and increasing the efficiency of marketing campaigns containing above-the-line media (Joo, Wilbur, Cowgill, and Zhu, 2014; Joo, Wilbur, and Zhu, 2016; Miklosik, 2014); and it serves as a bridge enabling the transition between various multimedia devices in the sequential mode of use (Google, 2012). An accent on integrated marketing (communications) systems, instead of treating various online marketing activities as standalone, has been discussed in the literature lately (Dong and Li, 2018; Duralia, 2018; Miklosik, 2016; Valos, Mapleston, Polonsky and Ewing, 2017; Yang, Lin, Carlson and Ross, 2016). Thus, organizations should be shifting their focus towards an integrated marketing approach that builds on search visibility (denoted as search-centric marketing) while also fostering sustainability of marketing activities.
Organic search visibility and paid search results should be coordinated into one coherent strategy where keywords with lower organic visibility are included in pay-per-click campaigns to guarantee a certain level of search visibility (e.g., within the first three results on the search engine results page) for the defined keywords. Working on organic search visibility requires more time and a systemic approach. It is not only e-commerce companies that realise that, by using search engine optimisation techniques, search visibility can be significantly increased in time (Kritzinger and Weideman, 2013, 2015). On the other hand, creating a pay-per-click campaign and reaching top position in a search engine results page is a straightforward activity with almost instant results (Berman and Katona, 2013). In this paper, the authors focus on organic search visibility. Factors affecting organic search visibility are generally known, despite the complexity of the search engines’ algorithms. They can be organized according to two basic variables: (1) the general relevance of the landing page and the website and (2) the specific relevance of the respective landing page in terms of content quality, quantity and its structure and presentation, which affects usability and onsite usage statistics. Sometimes, these groups are also referred to as offsite and onsite factors. Some experts suggest using three categories: backlink profiles, on-page factors, and traffic data (SEMrush, 2017); however, it can be argued that the traffic data are mostly dependent on the quality of the landing page in terms of its content quality, quantity and representation, which affect time on site, pages per session and bounce rate.
Identification of the research gap
When one examines the data from recently published industry studies of factors affecting search ranking and, thus, organic search visibility (Dean, 2016; Maksimava, 2016; SEOmoz, 2017; Searchmetrics, 2017; SEMrush, 2017) that originated as the result of analysing big data generated for hundreds of thousands of keywords in numerous countries, the most important ranking factors include:
- General relevance:
- Website security and trust – The share of websites with https on the search engine results page increases with the higher positions.
- Link profile – A balanced link profile with more backlinks from unique domains with high domain authority is crucial to rank, especially for high-volume keywords. Two complex scores – domain authority and page authority – can be considered to adequately reflect the relevance of the website and the landing page, considering their link profiles and other data (Kundu, 2014).
- Website visits – The overall number of visits seems to be relevant when determining the search ranking, where pages with higher traffic occupy top positions, especially for high-volume keywords.
- Social signals – These come from various social media profiles, the existence of external reviews and the average rating.
- Specific relevance:
- Content quantity – There is usually more content on pages ranking higher, and, the higher the search volume, the more content is required, the existence of user-generated content being one subfactor.
- Content quality – It is necessary to have sufficient keyword-mentions in various locations on the landing page: title, body, metadata, images, etc.
- User behaviour – This is represented by the click-through rate from the listing on the search engine results pages, and the on-page statistics such as bounce rate, page on time, and pages per session.
- Technical search engine optimisation – The presence of H1 (Heading 1), page speed, mobile friendliness of the landing page and elimination of broken links and other errors on the landing page are all significant.
The reason for constructing the framework presented in this article is the fact that there is no clear consensus on the exact impact of these factors on the organic search visibility, even for a generic search engine results page. SEMrush (2017) has confirmed that the competition for each keyword and its situation on the search engine results page affect the ranking patterns. With the variety of search results appearing on the search engine results pages (e.g., results with Google sitelinks; rich answers of various types such as featured snippets, Google answer box, charts, tables, sliders, maps, forms, etc.; regular results; YouTube videos and more), both the situation resulting in the search ranking and the factors affecting the ranking are completely unique. Moreover, despite the worldwide dominance of Google with its global share of more than 80% (Net Applications, 2017), there are other relevant search engines on the market, and in some countries their market share is quite significant. Bing and Yahoo are its two most significant worldwide competitors, followed by some local players (e.g., Baidu (www.baidu.com) in China, Yandex (Yandex.ru) in Russia, Naver (www.naver.com) in South Korea and Seznam (www.seznam.cz) in the Czech Republic). For organizations, it is crucial to be able to determine which factors are affecting the organic search visibility in their sector and search engine, and thus what exactly they should do to increase their search ranking. Instead of reverse-engineering the search engine optimisation factors (Cañabate Carmona, Fonseca Casas, and Sabaté i Garriga, 2014) and attempting to calculate individual correlations between the alleged ranking factors and the page’s positions, which can be less than 0.3 with a high standard deviation value (SEMrush, 2017), the introduced framework opens avenues for creating specific models and, through them, identifying the measures that will most probably have the best effect and thus the best return on investment for the specific search engine results pages the organization focuses on.
Research method
The most relevant factors affecting organic search visibility were summarised in the theoretical background section. The framework that would enable organizations to continually improve their organic search visibility, by identifying the most relevant ranking factors specific to keywords, sector and search engine, was created in the following steps:
- Test the contribution of selected relevant factors to the search rankings for diverse types of keywords and initially prove that constructing a model that enables the detection of the possible combination of their contribution in various situations, is feasible;
- Ensure that the framework has parameters of replicability, universality and flexibility;
- Develop the framework and construct the constraints of its application; and
- Create a research design to prove that the framework is applicable for different segments and combinations of keywords, is robust and produces different results over time.
To prove the applicability of the framework, the authors followed all the defined steps. Models were created, starting with the collection of extensive data for three diverse types of sectors. Within each, three search phrases were defined, thereby simulating the trends in formulating the keywords or search phrase in the form of a question. The combinations are listed in Table 1.
| ID Business Sector | ID Finance Sector | ID IT Sector |
|---|---|---|
| B1 How to do a cost benefit analysis | F1 How to choose a bank account | I1 How to choose a web hosting company |
| B2 What is the cost of company audit | F2 What is the best bank account in Australia | I2 What is the best server for a small business |
| B3 How much does a sales director make | F3 Who has the highest interest rate on a savings account | I3 How much does a website cost |
For every search phrase, a sorted list of search results on the first search engine results page was created and the featured pages were analysed in detail. Data about page authority and domain authority were collected; the existence of https was added as the third indicator of general relevance and trust. To assess the relevance of each landing page to the search phrase, its content was analysed. Two new metrics were created to reflect the quality and quantity of the content with respect to the keywords contained in the search phrase:
- Visible keywords – total number of keywords located in various locations: page title, URL, headings and other locations.
- On-page content score – a weighted score reflecting the importance of each location and the keyword relevance in connection to search phrase; i.e. including the keyword in the page title is expected to have higher impact on the search ranking of the landing page than adding the keyword in the common paragraph text. Similarly, the occurrence of the keyword best bank account is considered more important than best account and thus the occurrences of some keywords were divided by 2 (two examples of keywords are depicted in italics in Table 2).
To collect the data, each search phrase was decomposed to several keywords and their frequency in each of the locations was determined. Subsequently, the visible keywords and on-page content score indicators were calculated. The example of the decomposition of the search phrase, the assignment of weights for assessed keyword locations and the calculation of visible keywords’ and on-page content scores are shown in Table 2.
| Location weight | 35% | 30% | 25% | 10% | Score |
|---|---|---|---|---|---|
| Keyword/location | Title | URL | Headings | Other | Visible keywords |
| best bank account | 1 | 1 | 5 | 16 | 290 |
| Australia | 1 | 1 | 5 | 5 | |
| bank account | 0 | 0 | 2 | 95 | On-page content score |
| best account | 0 | 0 | 5 | 153 | 19.175 |
| Location subtotal for OCS | 2 | 2 | 13.5 | 145 |
Values for two other factors were collected as part of determining the specific relevance of the page – the existence of user generated content (by detecting whether there is any form of user-generated content present on the page, usually represented by an enabled discussion), and the speed of the page measured by the Google PageSpeed tool as accessed from a desktop computer.
The measurement of data was repeated in three cycles:
- June 2017 – The data were captured between 12 and 14 June 2017 (the letter a was added to the measurement, e.g., B1-a, B2-a, etc.).
- July 2017 – The data were captured between 12 and 14 July 2017 (the letter b was added to the measurement, e.g., B1-b, B2-b, etc.).
- August 2017 – The data were captured between 12 and 14 August 2017 (the letter c was added to the measurement, e.g., B1-c, B2-c, etc.).
Using correlation analysis, the contribution of individual factors to the search rankings was calculated. Low positive or negative correlation suggested that there was no significant connection between the value of the factor and the search ranking of the respective landing page. The authors focused on individual correlations higher than 0.3, which means that the factor’s contribution to the final search ranking within the given combination of the sector and keyword is significant. Using simulation, various combinations of 2–4 factors with the highest individual correlations were assessed, to find the combination of weights of factors that would produce the score and a rank as close as possible to the original search ranking. This was achieved by following these steps for each combination of factors (usually 8–10 combinations for each search phrase and measurement cycle):
- Transform the data to the same scale: 0 (worst result) – 100 (best result);
- Set the weights of the factors for the simulation;
- Calculate the score for each website as a sum of weighted subscores for each of the factors;
- Rank the website according to the simulated score and determine the correlation between the original and simulated search rankings;
- Repeat steps 2 to 4 for all possible combinations of the factors’ weights; and
- Select the combination of factors and their weights that yielded the highest correlation between the original and simulated search rankings as the result of the simulation.
The selected combination of factors and their weights represented the top factors the organization should focus on (according to their weights) in its search engine optimisation activities. By implementing improvements resulting in the increased performance and scores for these indicators, it maximises the chance of moving up in the search engine results page for the respective keyword considering the specific situation in the search ranking for the sector and the current time.
Research results
The framework
The authors created a framework consisting of several types of steps, including strategic decision-making, operative decision-making, data collection, quantitative and qualitative analysis and minor and major periodic checks. The application of this framework results in the creation of numerous models using the strategic approach. It also results in the addition or removal of factors according to the state of current knowledge, the situation in the search engine optimisation industry, actual trends and Google’s (or Bing’s or other search engines’) algorithm development. The framework is depicted in Figure 1.
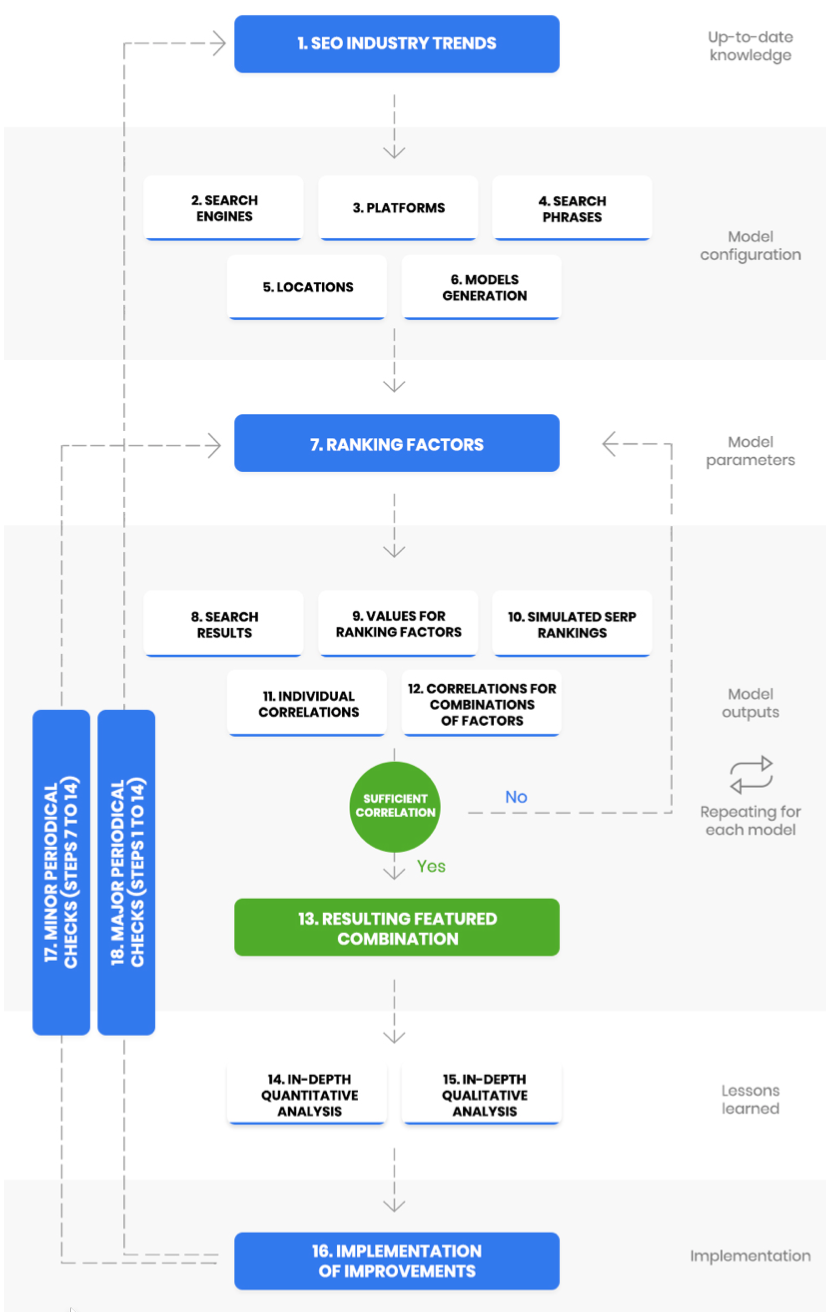
Figure 1: Framework for constructing optimisation models to increase organic search visibility
The framework consists of the following steps:
- Research the current trends in search engine optimisation and review the ranking factors that are most probably crucial for the current time.
- Select one or more desired search engines to use in the model (e.g., Google, Bing, Yahoo, etc.).
- Select desired platforms to be included in the model, i.e. desktop, mobile or both.
- Decide which search phrases will be included and make test searches using each search engine and each platform to obtain new ideas and finalise the keyword list.
- Determine the search location, i.e. whether to search globally or to add more locations to the model.
- Generate multiple models; one for each search engine, platform, search phrase and location.
- Select ranking factors which will be used for gathering data for all models. Generally, both onsite and offsite ranking factors should be considered. Selected indicators can be the same for all platforms or search engines or they may differ. For example, the mobile page speed and the existence of accelerate mobile pages version will be included when performing the research for the mobile platform, and desktop page speed will be relevant when creating the model for the desktop platform. Alternatively, more tools or more locations can be used to get the values for one indicator (e.g., using GTmetrix, which is another tool helping determine the speed of a website, in addition to Google PageSpeed Tools).
- Perform search and analyse the first search engine results page for each keyword. Take screenshots, create numbered list of websites in the form of a table for every search engine, location and platform.
- Check the values for all selected ranking factors for each website on the list and transform the data to the same scale 0 (worst result) to100 (best result).
- Simulate the search ranking for each factor individually (e.g., the website with the worst on-page content score will rank 10 in the simulated ranking).
- Determine the correlation between the real and the simulated search rankings for each indicator to assess its possible contribution to the original search ranking for this actual situation.
- Simulate various search rankings by applying the possible combination of factors’ weights and calculate the correlation between the real and the simulated search ranking for each of the combinations of factors’ weights. Various combinations of 2, 3, 4 or more factors with the highest individual correlations can be tried to achieve the highest possible positive correlation, ideally above 0.6. If the resulting correlation is not above 0.6 or some similarly defined value, return to step 7 to redefine the ranking factors included in the model.
- Select the combination of those factors and their weights whose simulated application has generated the search ranking with the closest similarity to the original search results for further analysis.
- Analyse the quantitative data in detail to learn more about the factors enabling the competitors to rank higher in the search results.
- Perform qualitative analysis of the content and texts to get more insights on the onsite situation, usability of each competitor’s landing page, calls to action and other factors affecting the content relevance, bounce rate, time on site and pages per visit stats.
- Apply changes on the analysed page, site-wide and offsite based on the lessons learned from the analysis.
- Minor periodic checks: Repeat steps 7 to 14 periodically (e.g., monthly or quarterly) to compare the data with the previous measurement, check the progress and determine new measures that might help to increase the search ranking. Implement them.
- Major periodic checks: Repeat steps 1 to 14, (e.g., in a yearly cycle), to stay on top of current trends in the industry and reflect changes in ranking factors caused by the revisions in the search engines’ algorithms.
Results generated by the framework
To demonstrate the application of the framework and the results it generates in time, the authors have created nine models, one for each sector and keyword. The Google search engine was selected, focused on desktop search results, and all results were checked without adding any specific location to the search strings. Results were checked locally from Australia using an Australian IP address. The values for five ranking factors were gathered: page authority, domain authority, https, page speed and user-generated content. The authors subsequently calculated the visible keywords and on-page content score values (more details are provided in the research method section of the paper). Search engine results pages of nine search phrases in three different time periods were examined, which resulted in a detailed analysis of 270 landing pages on 27 search engine results pages and more than 21,000 keyword occurrences in different locations.
The partial results, showing the individual correlations of ranking factors to the original search ranking, vary across the search strings and within the three different timeframes. In general, it can be stated that the mean individual correlation was below 0.3 for all seven factors, with six factors generating a positive mean correlation and one factor – page speed – a negative. This finding is in line with the conclusions of the SEMrush study (SEMrush, 2017) and the presumptions of the authors of this study, namely that determining the importance of ranking factors based solely on individual correlations would not be the optimal approach. However, when looking at the data individually, some specifically high individual correlations can be found. In seven out of twenty-seven measurements, the correlation between the performance of the website in at least one specific area (value of the individual ranking factor) and the search ranking was above 0.6 (these cases are highlighted in Table 3). In one measurement (I2-c), comparing the original search ranking with the simulated ranking based on the individual factor values, produced a correlation above 0.8.
| Measurement | PA | DA | HTTPS | UGC | PSD | VIK | OCS |
|---|---|---|---|---|---|---|---|
| B1-a | 0.559 | 0.475 | 0.000 | 0.266 | 0.152 | 0.093 | -0.382 |
| B1-b | 0.554 | 0.054 | -0.142 | 0.497 | 0.073 | -0.497 | -0.604 |
| B1-c | 0.430 | 0.266 | -0.426 | 0.640 | -0.042 | -0.191 | -0.261 |
| B2-a | 0.485 | 0.624 | 0.174 | 0.000 | 0.403 | 0.128 | 0.273 |
| B2-b | 0.042 | 0.006 | 0.418 | 0.435 | -0.237 | 0.261 | 0.236 |
| B2-c | 0.493 | 0.150 | -0.131 | -0.017 | -0.233 | 0.255 | 0.382 |
| B3-a | 0.368 | 0.516 | 0.174 | -0.174 | 0.284 | 0.516 | 0.611 |
| B3-b | 0.512 | 0.323 | -0.266 | 0.000 | -0.237 | 0.576 | 0.600 |
| B3-c | 0.400 | 0.452 | -0.592 | -0.174 | 0.128 | 0.297 | 0.539 |
| F1-a | -0.273 | 0.370 | 0.190 | 0.494 | -0.324 | 0.239 | 0.236 |
| F1-b | -0.073 | 0.419 | 0.190 | 0.494 | -0.061 | 0.497 | 0.382 |
| F1-c | 0.156 | 0.321 | 0.266 | 0.342 | -0.099 | 0.261 | 0.212 |
| F2-a | -0.242 | -0.075 | 0.261 | 0.035 | 0.311 | 0.728 | 0.728 |
| F2-b | 0.288 | 0.282 | 0.592 | 0.213 | -0.112 | 0.311 | 0.435 |
| F2-c | -0.256 | 0.073 | 0.000 | 0.356 | 0.093 | 0.734 | 0.709 |
| F3-a | -0.372 | 0.038 | -0.284 | 0.114 | -0.703 | 0.152 | 0.285 |
| F3-b | -0.355 | -0.582 | -0.426 | -0.087 | -0.343 | -0.006 | 0.055 |
| F3-c | 0.400 | 0.548 | -0.213 | 0.348 | -0.764 | 0.113 | 0.079 |
| I1-a | 0.217 | -0.217 | -0.722 | -0.087 | -0.321 | -0.309 | -0.345 |
| I1-b | -0.319 | -0.054 | 0.646 | -0.665 | -0.558 | 0.455 | 0.479 |
| I1-c | 0.249 | -0.249 | -0.058 | -0.522 | -0.321 | -0.212 | -0.127 |
| I2-a | 0.490 | 0.336 | -0.244 | 0.087 | -0.313 | 0.152 | 0.200 |
| I2-b | 0.509 | 0.164 | 0.244 | -0.174 | -0.249 | 0.261 | 0.394 |
| I2-c | 0.463 | 0.092 | -0.355 | 0.266 | 0.091 | 0.818 | 0.806 |
| I3-a | -0.237 | 0.117 | 0.142 | -0.342 | 0.370 | -0.152 | 0.055 |
| I3-b | 0.268 | 0.236 | 0.284 | 0.295 | -0.597 | 0.455 | 0.356 |
| I3-c | 0.094 | -0.381 | 0.038 | -0.426 | 0.030 | 0.038 | 0.164 |
| Sum | 4.850 | 4.307 | -0.241 | 2.214 | -3.583 | 5.971 | 6.496 |
| Mean | 0.180 | 0.160 | -0.009 | 0.082 | -0.133 | 0.221 | 0.241 |
| Legend: PA – page authority; DA – domain authority; HTTPS – https; PSD – page speed; UGC – user generated content; VIK – visible keywords; OCS – on-page content score | |||||||
The level of attribution of each factor to the original search ranking varies among the measurements. Sometimes, individual page authority (PA) correlations are very similar for all three measurements (e.g., the values for I2a-c, namely 0.490, 0.509, and 0.463), which means that in all three cases the search rankings are influenced by the page authority to almost the same level. In other cases, the values differ significantly between measurements. And even in the context of I2, the correlations of other factors tend to vary, and thus it can be confirmed that each situation (the combination of search phrase, search engine and measurement) is unique.
By following steps 12 to 15 in the proposed framework, the organization can obtain more valuable insights, which will help its team to focus on priorities and streamline the search engine optimisation and search engine marketing activities. Steps 12 and 13 enable the finding of those combinations of ranking factors within the constructed model that contribute the most to better search rankings. By focusing on these factors, the organization maximises the return on investment into search engine optimisation, and these improvements have the greatest potential for positively influencing the search ranking of the landing page. Application of these steps and possible conclusions based on the results will be illustrated using the case of the search phrase B1 and the three measurements of values that took place in June, July and August 2017 (B1a-c). In the first measurement, page authority, domain authority and user-generated content would be the three most influential factors, yielding individual correlations of 0.559, 0.475 and 0.266 respectively. Based on these findings, the company would focus mostly on building the page authority by fostering organic citations of this landing page and increasing the domain authority, which requires enriching the overall link profile of the whole website. Having user-generated content on the landing page seems important, too. In the second and third measurement, domain authority seems to be less important while user-generated content increases in significance, with its individual correlation in the B1-c case exceeding 0.6. The priorities of search engine optimisiation, i.e. the degree of resources dedicated to improving each score, would be set as following:
- PA (page authority) – 39%
- DA (domain authority) – 33%
- UGC (user-generated content) – 18%
- PSD (page speed) – 10%
By developing a model of the joint contribution of factors to the search ranking, the situation changes. First, the authors determined the correlation between the simulated ranking based on the above-shown influence of each factor and the real search engine results page, which was 0.576. After that, the mutual interaction of the four ranking factors on the search ranking was considered. By adjusting their contribution to the model, new optimal search engine optimisation prioritisations were set, producing a higher correlation of 0.636. However, if all seven ranking factors were included in the modelling, it was detected that by replacing the user-generated content factor with visible keywords and final adjustment of the priorities, the highest correlation of 0.661 was achieved. A comparison of these three different results is presented in Table 4.
| | F | P | F | P | F | P | F | P | OC |
|---|---|---|---|---|---|---|---|---|---|
| Priorities reflecting individual correlations | PA | 39% | DA | 33% | UGC | 18% | PSD | 10% | 0.576 |
| Best combination of the factors above | PA | 50% | DA | 10% | UGC | 20% | PSD | 20% | 0.636 |
| Best overall combination | PA | 50% | DA | 30% | VIK | 12% | PSD | 8% | 0.661 |
| Legend: F – ranking factor; P – search engine optimisation priority; PA – page authority; DA – domain authority; UGC – user generated content; VIK – visible keywords; PSD – page speed; OC – overall correlation | |||||||||
These results indicate that the search engine optimisation priorities are different if the overall contribution of the factors and their interference is considered. Naturally, organizations should focus on the combination with the highest overall correlation. Thus, the organization should invest 50% of its commitment (and budget) into improving the page authority of the landing page and 30% into increasing the domain authority of the domain/website; it should focus on the content quality and quantity represented by the inclusion of keywords in defined locations (12%) and check whether the loading time of the landing page could be decreased (8% of effort and resources). However, by including steps 14 and 15 of the framework before making the final decision, the organization can conduct a deeper analysis. For example, it may detect that its page authority is already the highest of all landing pages in the top 10 list and that the page does not feature user-generated content. Thus, it could get some edge over the competitors by enabling user-generated content on the landing page. Also, quantitative and qualitative analysis is important in terms of working with content and the inclusion of keywords in the visible parts of the content.
If the decision to take additional or different factors into consideration were made in step 7 of the framework, the resulting model, correlations and the implications would be different. The current situation for all three measurements for the B1 search phrase is depicted in Table 5.
| Measurement | Factor | Priority | Factor | Priority | Factor | Priority | Factor | Priority | OC |
|---|---|---|---|---|---|---|---|---|---|
| B1-a | PA | 50% | DA | 30% | VIK | 12% | PSD | 8% | 0.661 |
| B1-b | UGC | 40% | PA | 50% | DA | 10% | - | - | 0.673 |
| B1-c | UGC | 40% | PA | 20% | DA | 40% | - | - | 0.697 |
| Legend: PA – page authority; DA – domain authority; VIK – visible keywords; PSD – page speed; UGC – user generated content; OC – overall correlation | |||||||||
In this model scenario, the authors have proceeded to step 17 of the framework, without the implementation of changes (step 16) that would be suggested based on the previous steps. However, despite the changes of the situation between these three measurements (within three months), the model consisting of seven selected ranking factors - page authority, domain authority, https, user-generated content, page speed, visible keywords, and on-page content score has proven to be feasible and the results are valuable and applicable in the context of this search phrase. All three overall correlations are higher than the highest individual correlation achieved in each measurement (0.661 versus 0.559, 0.673 versus 0.554, and 0.697 versus 0.640). Because of this, working on identifying the priorities of optimisation with the combination of several indicators has the potential to increase the efficiency of the measures taken as the result of gaining these insights.
Applying this model to other search phrases generated interesting results as well. Many of the featured combinations of factors according to the final search engine optimisation priorities generated the overall correlation above the critical 0.6 value, with the highest overall correlation value at 0.867. Such a high correlation (above 0.8 in 5 of 27 cases) indicates that, if the resulting weights of factors were applied to the search engine results page, the simulated search ranking would be almost identical to the original search ranking. Therefore, by focusing on these factors and using their weight as the level of priority for using the organization’s resources, improvement of the search ranking of the organization’s landing page should result from the implementation. Correlation values around 0.4 or 0.5 indicate medium strength of correlation, and the organization should therefore consider modifying the ranking factors in the model. Despite this recommendation, many lessons can still be learned from the model generating these medium-strength correlations. In certain cases, the overall correlation fell below 0.3, which can be considered too low to create relevant conclusions. In these cases, model variables need to be changed. Thus, the organization should return to step 7 of the framework and redefine the ranking factors that will be included in the model. Table 6 shows the maximum overall correlations reached when simulating the most probable weights of ranking factors for each measurement.
| Measurement | Overall correlation | Mean |
|---|---|---|
| B1-a | 0.661 | 0.677 |
| B1-b | 0.673 | |
| B1-c | 0.697 | |
| B2-a | 0.758 | 0.592 |
| B2-b | 0.467 | |
| B2-c | 0.552 | |
| B3-a | 0.806 | 0.721 |
| B3-b | 0.661 | |
| B3-c | 0.697 | |
| F1-a | 0.661 | 0.673 |
| F1-b | 0.721 | |
| F1-c | 0.636 | |
| F2-a | 0.867 | 0.810 |
| F2-b | 0.830 | |
| F2-c | 0.734 | |
| F3-a | 0.285 | 0.297 |
| F3-b | 0.055 | |
| F3-c | 0.552 | |
| I1-a | 0.217 | 0.440 |
| I1-b | 0.855 | |
| I1-c | 0.249 | |
| I2-a | 0.612 | 0.705 |
| I2-b | 0.685 | |
| I2-c | 0.818 | |
| I3-a | 0.370 | 0.422 |
| I3-b | 0.588 | |
| I3-c | 0.309 |
If the mean values of the overall correlations are assessed, there is only one case with a mean correlation less than 0.3 (the F3 search phrase with overall correlation 0.297). However, the correlation changes significantly between measurements: in the August 2017 data batch, the overall correlation reaches 0.552, which already suggests a solid medium-level correlation. This situation shows that, in some cases, the situation on the search engine results pages is quite specific and is not easily explicable by the influence of the most common ranking factors. However, this can change in time and, by applying the same model, some standardisation of values according to the expectations can be observed.
Discussion
When analysing the data generated by following steps 1 to 11 of the framework, the authors could identify unique information that can be of immediate value to the organization, even without finishing the application with the remaining steps. By considering each situation – the SERP for each search phrase and measurement individually – the organizations can already focus on improving the scores of those indicators with individual correlation above 0.6 (these are highlighted in Table 3).
If the adoption and use of the initial model for the simulation does not provide satisfactory results, there is a possibility of adding some other simple indicators or creating new and more complex ones using a system of values and weights. The on-page content score already used in our model scenarios is an example of such an indicator. The formula for its calculation can be modified, e.g., to distinguish the keywords appearing in various headings (H1, H2, H3, etc.), bullet points or even in visually hidden components such as metadata description. Internal links pointing to a landing page with the text in anchor can also represent a subfactor of the on-page content score. When searching for parts of the search phrase in the content, related content forms such as cost-benefit analysis should be considered. It is the decision of the organization applying the framework to determine whether these should have the same or reduced weight on the on-page content score. Abbreviations that are commonly used and recognised in the sector should also be considered, as there is a great chance that Google (and possibly other search engines) will treat them as synonyms, e.g., cost-benefit analysis in this case.
If the model produces a low correlation after changing the factors, the keyword selection should be reviewed. For example, when analysing the search phrase B3 How much does a sales director make, the authors initially identified the occurrences of these keywords: salary, sales director, and make; with make having only a 50% score on the visible keywords and on-page content score. What needed to be done was to take the most common variants for the first two keywords into account – salaries for the first, SD and director of sales for the latter. Also, two of the websites did not mention either the sales director keyword or its modifications. However, they contained texts about salaries of sales managers. Tracking the keyword sales separately and adding the keyword manager needed to be considered in this case to achieve higher correlation coefficients. To cover the term make more comprehensively, variants such as earn can be tracked as synonyms. Common sense would be applied to determine if the synonym should have the same or lower weight on the score.
In certain cases, qualitative analysis (step 15 of the framework) may also help discover the roots of a low correlation coefficient. Manually examining the values that have low individual correlation, especially for some keywords in locations visible or invisible to the user, can shed light on what is happening within the search engine results page. It may be discovered (e.g., case I3-A) that a certain website has been over-optimised and therefore it won’t rank at the top of the search engine results page, despite having the highest number of keywords in important locations. In case I3-A, for example, websites ranking 4 and 6 (websitebuilderexpert.com and webpagefx.com) are probably over-optimised, achieving an unnaturally high on-page content score that is 4-6 times higher than its neighbours in the search engine results page. In this case, manually lowering the on-page content score to the level of the next competitor might positively affect the correlations achieved.
Achieving a high correlation coefficient has its natural limitations in terms of this framework and factors included in the modelling. Roots of the limitations lie in the fact that some ranking factors are not measurable or known by third parties and cannot be included in the model (though Google and possibly some other search engines do have this information), including these three important ranking factors:
- Click-through rate from the search rankings – this is determined by the quality and attractiveness of the page title and metadata descriptions. Search engines strongly prefer results exhibiting higher click-through rate compared to an average for the ranking spot.
- Usability and user behaviour – Google knows the behaviour of people reaching the target site. If there is a high bounce rate, low time on site, or not enough pages per session, the page will drop in search rankings.
- Internal link silos – these are considered an important indicator, as they show what importance is assigned to a landing page internally.
The authors have demonstrated that the framework and the models generated with its application can result in combinations of factors that strongly affect the search ranking with correlation coefficients usually over 0.6 and reaching almost 0.9 in certain cases. Thus, the limitations of assessing individual correlations and making solid conclusions based on these correlations have been effectively removed. By adopting and implementing this framework, an organization can create the foundation for processes that will enable it to continually increase the organic visibility of websites in its portfolio. This systematic approach represents the opposite of desperately following all the updates of search engine optimisation ranking factors, changing the search engine optimisation priorities based on these findings and applying them across the whole portfolio and different countries without considering the specifics of each industry and search engine results pages.
Conclusion
To increase the visibility of their information in search engines, organizations need to understand the changes in online information search behaviour. These are reflected in the way how search engines process the content they index and offer the best results to people looking for it. Getting to the top of organic search results requires knowing how people search for information. This includes knowing which devices they use, where they search, how the search phrase is entered, how multiple devices are used to search and complete the purchasing decision (or another process), etc. Furthermore, it is crucial to determine which factors influence the ranking in the search results provided, relevant to the search phrase, device and location.
The constructed framework solves the existing problems of the fact that the ranking factors change in time and, moreover, change with the search phrase, location, device etc. It enables organizations to determine the factors that contribute to organic search visibility in the analysed sector with a given search phrase. By recognising these factors and their most probable contribution to the search ranking, organizations can maximise the return on investment to search engine optimisation and search engine marketing and, through this, increase the visibility of their online information and, ultimately, the key performance indicators of the whole organization.
The framework fulfils all the set requirements regarding its robustness, universal applicability, scalability and time sovereignty. It represents a unique outcome from a theoretical perspective, in contrast to research studies producing results with time-limited application because of their focus on the actual situation and factors affecting organic search visibility. The framework is ready for the future as it is not focused on how the search phrase is inserted (typing, voice), its type (keyword string, command, question, etc.), or its length (short or long). In this study the authors followed the suggested steps of the framework and proved its applicability for a diverse range of segments and industries, not limited to information technology, business or finance sectors.
Future research
The universal applicability of the presented framework can be further confirmed in future research studies focused on creating different models by:
- including search results from countries other than Australia;
- examining the search engine results pages for other industries;
- comparing the results for different types and lengths of search queries;
- considering search results from mobile platforms; or
- including different ranking factors in the created models.
These points represent possible directions for future research stemming from the study’s findings.
Acknowledgements
This paper originated as the result of working on the grant scheme 2015-PSD-PAV-01 ‘Optimization of websites for search engines as an integral component of marketing’.
About the authors
Andrej Miklosik is an Associate Professor in the Department of Marketing, Faculty of Commerce at the University of Economics in Bratislava. Andrej undertook his doctoral studies at this university and holds numerous professional certifications in the area of information technology governance and project management. His research focuses on the information technology and business fusion, particularly in the areas of knowledge management, new technologies in business and marketing, and search visibility of organizations. He can be contacted at andrej.miklosik@euba.sk
Nina Evans is an Associate Professor and the Associate Head of the School of Information Technology and Mathematical Science at the University of South Australia. She holds tertiary qualifications in Chemical Engineering, Education, Computer Science, a Masters’ degree in Information Technology, an MBA and a PhD. Her research interest relates to information and knowledge management, managing the business-IT interface, social networks in SMEs and ICT Innovation. She can be contacted at nina.evans@unisa.edu.au
Stefan Zak is an Associate Professor in the Department of Marketing, Faculty of Commerce at the University of Economics in Bratislava. Stefan's research interests include market research and the use of information and communication technologies in marketing. His recent research projects were focusing on marketing tools in the mHealth sector and the role of influencers in the consumer purchasing decision-making process. He can be contacted at stefan.zak@euba.sk
Julia Lipianska is an Associate Professor in the Department of Marketing, Faculty of Commerce at the University of Economics in Bratislava. In her research she has been looking at maximising the efficiency of tools and the contribution of the whole marketing mix to the performance of organizations, with the focus on the processes related to creating and deploying pricing strategies within organizations. She can be contacted at julia.lipianska@euba.sk
References
- Battelle, J. (2005). The search: how Google and its rivals rewrote the rules of business and transformed our culture. New York, NY: Portfolio.
- Berman, R., & Katona, Z. (2013). The role of search engine optimization in search marketing. Marketing Science, 32(4), 644–651.
- Blake, T., Nosko, C. & Tadelis, S. (2015). Consumer heterogeneity and paid search effectiveness: A Large‐Scale Field Experiment. Econometrica, 83(1), 155-174.
- Cañabate Carmona, A., Fonseca Casas, P., & Sabaté i Garrig.a, F. (2014). The unfathomable secret remains: a reverse engineering study of SEO factors on Google’s search engine. Barcelona, Spain: Universitat Politècnica de Catalunya. (Working paper). Retrieved from https://upcommons.upc.edu/bitstream/handle/2117/24874/paper%20v1%20-%20The%20unfathomable%20secret%20remains.pdf?sequence=8&isAllowed=y. (Archived by WebCite® at http://www.webcitation.org/75Keqlwlq)
- Dean, B. (2016). We analyzed 1 million Google search results. Here’s what we learned about SEO. Cheyenne, WY: Backlinko llc. Retrieved from https://backlinko.com/search-engine-ranking. (Archived by WebCite® at http://www.webcitation.org/74U1Fmfoj)
- Dong, X., & Li, H. (2018). Does online media sequence matter in product marketing? Electronic Commerce Research and Applications, 28, 44–53.
- Dorcak, P., & Delina, R. (2011). Impact of e-marketing services on economic performance. Ekonomicky Casopis, 59(1), 44–58.
- Du, J. T., & Spink, A. (2011). Toward a web search model: integrating multitasking, cognitive coordination, and cognitive shifts. Journal of the Association for Information Science and Technology, 62(8), 1446–1472.
- Duralia, O. (2018). Integrated marketing communication and its impact on consumer behavior. Studies in Business and Economics, 13(2), 92–102.
- Feeny, D., & Arsenault, T. (2008). Your website: greater visibility and return of investment through search engine marketing. DESIDOC Journal of Library & Information Technology, 28(4), 79-82.
- Gartner. (2016). Gartner reveals top predictions for IT organizations and users in 2017 and beyond. Retrieved from https://www.gartner.com/newsroom/id/3482117. (Archived by WebCite® at http://www.webcitation.org/74WZdMuZd)
- Google. (2012). The new multi-screen world study. Retrieved from https://www.thinkwithgoogle.com/advertising-channels/mobile/the-new-multi-screen-world-study/ (Archived by WebCite® at http://www.webcitation.org/74U1Haewf)
- Joo, M., Wilbur, K. C., & Zhu, Y. (2016). Effects of TV advertising on keyword search. International Journal of Research in Marketing, 33(3), 508–523.
- Joo, M., Wilbur, K. C., Cowgill, B., & Zhu, Y. (2014). Television advertising and online search. Management Science, 60(1), 56–73.
- Kates, A., & Greenberg, E. (2013). Strategic digital marketing: top digital experts share the formula for tangible returns on your marketing investment. New York: McGraw-Hill.
- Kritzinger, W. T., & Weideman, M. (2013). Search engine optimization and pay-per-click marketing strategies. Journal of Organizational Computing and Electronic Commerce, 23(3), 273–286.
- Kritzinger, W. T., & Weideman, M. (2015). Comparative case study on website traffic generated by search engine optimisation and a pay-per-click campaign, versus marketing expenditure. South African Journal of Information Management, 17(1), 1-12.
- Kundu, S. (2014). Why domain authority is most important for SEO? [Web log post]. Retrieved from https://codeboxr.com/blogs/why-domain-authority-is-most-important-for-seo-3/. (Archived by WebCite® at http://www.webcitation.org/74U1MIIqh)
- Li, J., Huang, C., Wang, X. & Wu, S. (2015). Balancing efficiency and effectiveness for fusion-based search engines in the 'big data' environment. Information Research, 21(2), paper 710. Retrieved from http://InformationR.net/ir/21-2/paper710.html (Archived by WebCite® at http://www.webcitation.org/6hmvFFriB)
- Maksimava, M. (2016). Google’s 9 major ranking signals: what they are and how to check your site against them. Link-Assistant.Com Retrieved from https://www.link-assistant.com/news/ranking-factors.html. (Archived by WebCite® at http://www.webcitation.org/74U1O1Lpw)
- Miklosik, A. (2014). Improving positions in search engines as the centre of consumer-oriented marketing campaigns. In D. Matus, J and Petranova (Ed.), Marketing identity: explosion of innovations, (pp. 323–333). Trnava, Slovakia: Faculty of Mass Media Communication, University of Ss. Cyril and Methodius.
- Miklosik, A. (2016). Search-centric approach to sustainability of academic marketing. Economic Annals-XXI, 156(1–2), 92–96.
- Net Applications. (2017). Search engine market share. Aliso Viejo, CA: Net Applications. Retrieved from https://www.netmarketshare.com/search-engine-market-share.aspx. (Archived by WebCite® at http://www.webcitation.org/74U1PeS3e)
- Olson, C. (2016, April 25). Just say it: The future of search is voice and personal digital assistants. [Web log post]. Retrieved November 30, 2018, from https://www.campaignlive.co.uk/article/just-say-it-future-search-voice-personal-digital-assistants/1392459. (Archived by WebCite® at http://www.webcitation.org/74WZbWxCN)
- Raunio, T. (2008). Visibility on the Web: search results and spam. Unpublished doctoral dissertation. University of Jyväskylä, Jyväskylä, Finland. Retrieved from https://jyx.jyu.fi/bitstream/handle/123456789/18361/1/URN_NBN_fi_jyu-200805151473.pdf. (Archived by WebCite® at http://www.webcitation.org/75KexYozd)
- Searchmetrics. (2017, December 1). Searchmetrics ranking factors – rebooting for relevance. [Web log post]. Retrieved from https://www.searchmetrics.com/knowledge-base/ranking-factors/ (Archived by WebCite® at http://www.webcitation.org/74U1TRb73)
- SEMrush. (2017). SEMrush ranking factors study 2017. Boston, MA: SEMrush Inc. Retrieved from https://www.semrush.com/ranking-factors/. (Archived by WebCite® at http://www.webcitation.org/74U1UaMuA)
- SEOmoz Inc. (2017). 2017 Local search ranking factors. Seattle, WA: SEOmoz Inc. Retrieved from https://moz.com/local-search-ranking-factors. (Archived by WebCite® at http://www.webcitation.org/75Kew1n7M)
- Smart Insights (2018a). Mobile marketing statistics compilation. Leeds, UK: Smart Insights Ltd. Retrieved from https://www.smartinsights.com/mobile-marketing/mobile-marketing-analytics/mobile-marketing-statistics/. (Archived by WebCite® at http://www.webcitation.org/74U1XcG8O)
- Smart Insights (2018b). Search engine statistics 2018. Leeds, UK: Smart Insights Ltd. Retrieved from https://www.smartinsights.com/search-engine-marketing/search-engine-statistics/. (Archived by WebCite® at http://www.webcitation.org/74U1Vi77d)
- Stern, T. (2015, June 24). The evolution of SEO trends over 25 years. [Web log post]. Search Engine LandRetrieved from https://searchengineland.com/evolution-seo-trends-25-years-223424. (Archived by WebCite® at http://www.webcitation.org/74U3AXmad)
- Sullivan, D. (2016, May 24). Google now handles at least 2 trillion searches per year. [Web log entry]. Search Engine Land. Retrieved from https://searchengineland.com/google-now-handles-2-999-trillion-searches-per-year-250247. (Archived by WebCite® at http://www.webcitation.org/75Keqlwlq)
- Thurow, S. (2003). Search engine visibility. Indianapolis, IN : New Riders.
- Thurow, S. (2007). Search engine visibility. 2nd ed. Indianapolis, IN : New Riders, Pearson Education.
- Tomasi, S., & Li, X. (2015). Influences of search engine optimization on performance of SMEs: a aualitative perceptive. Journal of Electronic Commerce in Organizations, 13(1), 27–49.
- Valos, M. J., Maplestone, V. L., Polonsky, M. J., & Ewing, M. (2017). Integrating social media within an integrated marketing communication decision-making framework. Journal of Marketing Management, 33(17–18), 1522–1558.
- Weideman, M. (2009). Website visibility : the theory and practice of improving rankings. Oxford: Chandos Publishing.
- Weideman, M., & Chambers, R. (2005). Application of best practice towards improving web site visibility to search engines: a pilot study. South African Journal of Information Management, 7(4), a288. Retrieved from https://sajim.co.za/index.php/sajim/article/view/288/278 (Archived by WebCite® at http://www.webcitation.org/769YsD0n2)
- Yang, S., Lin, S., Carlson, J. R., & Ross Jr., W. T. (2016). Brand engagement on social media: will firms’ social media efforts influence search engine advertising effectiveness? Journal of Marketing Management, 32(5–6, SI), 526–557.
- Yang, Z., Shi, Y., & Wang, B. (2015). Search engine marketing, financing ability and firm performance in e-commerce. Procedia Computer Science, 55, 1106–1112.