On the use of multimedia in Twitter health communication: analysis of tweets regarding the Zika virus
JungWon Yoon, Loni Hagen, James Andrews, Ryan Scharf, Thomas Keller and EunKyung Chung
Introduction: This study investigated influences of multimedia tweets on retweetablity during public health crises, in order to provide evidence for facilitating effective use of Twitter for health communication.
Method: Using the Twitter stream API, a total of 359,043 Zika-related tweets were collected for analysis.
Analysis: The sampled tweets were quantitatively analysed using descriptive statistics and chi-squared tests. For content analysis, subsets of the dataset were manually coded.
Results: 1) text tweets were sent out more frequently than multimedia tweets, but multimedia tweets had higher retweetability, 2) tweets by government, mainstream news media, and online news media were frequently retweeted, 3) images were often used for educational and informational (not news) tweets, and videos were used for educational and political purposes, 4) however, considering retweetability, highly retweeted images were for disseminating brief news, and highly retweeted video tweets were for disseminating informational or educational messages, and 5) ratios of non-U.S. agents were higher in multimedia retweets than text retweets.
Conclusion: The findings can help government and business practitioners to build their social media communication strategies in order to effectively select proper content and multimedia formats to enhance the impact of information sharing and communications during emergent health situations.
Introduction
People use multimedia because they feel it enables them to communicate more effectively (Snyder, 2014). In the past, due to a lack of readily available technologies for creating and disseminating multimedia, multimedia use was limited and generally considered as supplementary material to augment text. Yet, multimedia objects have the potential to be more than this. Multimedia can communicate information and knowledge that cannot be delivered through text alone and provides additional value by enabling a greater influence and impact of a message.
The effectiveness of multimedia in communication has long been recognized in various disciplines. For instance, research in education has demonstrated that multimedia enhances understanding and recall of information (People use multimedia because they feel they enables them to communicate more effectively (Snyder, 2014). In the past, due to a lack of readily available technologies for creating and disseminating multimedia, multimedia use was limited and generally considered as supplementary material to augment text. Yet, multimedia objects have the potential to be more than this. Multimedia can communicate information and knowledge that cannot be delivered through text alone and provides additional value by enabling a greater influence and impact of a message.
The effectiveness of multimedia in communication has long been recognized in various disciplines. For instance, research in education has demonstrated that multimedia enhances understanding and recall of information (Mayer, 2005) and research in marketing and journalism has shown that multimedia has more persuasive power for consumers and readers (Joffe, 2008; Naik and Raman, 2003). We encounter the use of multimedia for other various purposes that add value to content; Westman and Oittinen (2006) demonstrated that the use of photos in newspaper articles helps in providing proof of events, can catch the attention of readers and fill space. In the health communication field, it has been reported that visual information is an effective way for enhancing comprehension and adherence to health instruction and changing attitudes and risky behaviour; in particular people with low health literacy benefit from visual aids (Garcia-Retamero and Cokely, 2013; Houts, Doak Doak and Loscalzo, 2006).
Today’s personal digital devices and technologies mean that people are more able to easily create, disseminate and use multimedia. Sharing of multimedia has increased, especially on social media communication platforms such as Facebook, Twitter, YouTube and Instagram. Twitter is considered an important source for sharing information and has been a popular means of disseminating news and updates in emergent situations, such as public health crises (Rantasila, Sirola, Kekkonen, Valaskivi and Kunelius, 2018). Medical/health emergencies, such as Ebola and H1N1, are some of the more salient examples of such emergent situations. In such events, it is much more important to communicate in an efficient and effective way; therefore, more evidence is needed regarding what constitutes an effective use of multimedia in Twitter communication. Despite the frequent use of Twitter for health communication, there is currently a lack of studies on the use of multimedia in health-related tweets.
In order to understand how multimedia impacts conversations on Twitter, we collected tweets related to the outbreak of the Zika virus. In 2016, the outbreak of Zika was widespread, particularly in the Americas. The outbreak began in April 2015 in Brazil and spread to other countries in South America, Central America, North America and the Caribbean. Cases of Zika were also reported in Singapore and Malaysia in August 2016. In the continental United States, the first Zika-related death was in Utah, the first baby born with a Zika-related birth defect was in New York City and the first local Zika transmission was in Florida. These events were reported in July 2016. As of December 8, 2016, there were 4,575 cases of Zika reported in the continental United States and Hawaii (Timeline..., 2016). Although most people who are infected by the Zika virus do not present symptoms or show only mild ones, there are possibilities of a serious birth defect of the brain and other problems in babies whose mothers were infected with Zika during their pregnancy (Zika virus, 2018). Such potentially devastating outcomes related to Zika understandably raised the concerns of people across the globe.
This study investigated influences of multimedia tweets on their retweetablity during public health crises and sought to provide evidence for effective Twitter communication based on the study’s findings. The purpose of the study was to understand the characteristics of multimedia tweets on the topic of Zika virus and those tweets’ retweetability (i.e., frequency of retweets). The following research questions guided this study:
- RQ1: How frequently is multimedia content used in Zika-virus-related tweets and retweets?
- RQ2: What are the characteristics of agents that actively send out multimedia tweets?
- RQ3: How are topical characteristics of multimedia tweets characterized in tweets and retweets?
Related studies
Multimedia and social media
Multimedia has been used widely across social media. Users are likely to communicate with others using multimedia-embedded postings. When reviewing past, related studies, three categories of research endeavours emerged: the use of images, the impact of images and the use of videos in terms of social media.
Embedding images in social media communications were studied in a few circumstances that were of national interest or concern. These were discussed in a few studies. For instance, Chung and Yoon investigated how images were used within 1,589 Twitter messages related to the Boston bombing in April 2013. Messages expressing opinions were found to be tagged favorite most, and messages sharing information were recognized as most influential to users. In addition, the primary image use was likely to be data-driven, supporting information dissemination, information processing and learning, instead of object-driven images used for purposes such as aesthetic value, emotional/persuasive purpose, or illustration (Chung and Yoon, 2013). They found that various types of images (direct photos, captured images, graphics) were used and identified relations between Twitter messages and images (Yoon and Chung, 2016).
In a similar context to that of the Boston bombing event, Vis, Faulkner, Parry, Manyukhina and Evans (2013) conducted an exploratory study of images tweeted during the 2011 UK riots. The results identified different types of images on Twitter, such as digital camera pictures, appropriated pictures and TV screen shots. With certain types of images, users were likely to create and mobilize the images as means of communication. As another effort to identify the types of images used in social media, Thelwall et al. (2016) conducted a content analysis of 800 randomly selected images tweeted during a week of 2014 in both the UK and the USA. According to the results of the study, the most frequent type of image was the photograph, but a substantial number of the images were in hybrid or layered formats such as screen shots, collages and captioned pictures in order to communicate through social media. In terms of the purpose of tweets, sharing the details of daily life, chatting, or gossiping were identified as common purposes. As a more concept-oriented approach to image type classification, Chen, Lu, Kan and Cui (2013) analysed tweet posts with images and indicated that there are two types of image: visually relevant image tweets and visually non-relevant image tweets in this study. A visually relevant image tweet means that image is likely to play an important role in presenting the topic of the tweet message. On the other hand, a visually non-relevant image tweet tends to use image as a way of dressing up the tweet message.
Second, there have been efforts to demonstrate the impact of image use in social media. Yoon and Chung (2016) focused on the characteristics of tweet message, senders and influential messages, analysing 174 Boston bombing postings with images. The results showed that three primary purposes of the images were to express opinions, share information and report news. The major types of tweet-senders were media and individuals and different categories of tweet messages were found depending on types of individuals tweeting. More importantly, whether tweets are influential (highly retweeted) or not shows different patterns in terms of tweet message categories and senders. In terms of Facebook, Ulloa, Mora, Pros and Tarrida (2015) experimented with the effects of images in Facebook posts. News items with three different formats of images posted on Facebook walls were presented to twenty-four Spanish college students and their responses were recorded with an eye-tracking device. The results showed that the size of an image is significant in terms of attracting and retaining users. Similar to the study by Ulloa, et al., Zhao, Zhu, Qian and Zhou (2013) identified the impact of multimedia in context of social media in China. On Sina Weibo, multimedia tweets were more dominant and popular compared to text tweets. In particular, the study demonstrated that tweets with multimedia showed a longer life span.
Third, although the majority of studies have focused on the uses and impact of images on social media, there have also been efforts to understand the uses and impact of videos on social media. Morgan, Snelson and Elison-Bowers (2010) examined image and video postings of substance use on social media among young adults. According to the results of their content analysis, females in social gatherings tended to post images of alcohol consumption. On the other hand, solitary males were more likely to post images and videos of marijuana use. As self-disclosure, while the perceptions of the postings related to alcohol use were positive, marijuana-related postings were perceived negatively. Similar to that study by Morgan, et al., Syed-Abdul et al. (2013) conducted a content analysis on videos and demonstrated that misleading health information, such as pro-anorexia information, was identified in 29.3% of anorexia-related videos on YouTube and pro-anorexia videos are more favoured and rated by its viewers.
Social media for health information and communication
According to a review of a total of 98 studies conducted during the period between January 2002 and February 2012, social media has been used for health communication among public users, patients and professionals (Moorhead et al., 2013). As the comprehensive review indicated, social media was clearly regarded as a communication medium and as a tool that provided the possibility of potentially improving health outcomes from a health professional’s perspective. More specifically, related studies on the use of social media for health information sharing and communication have focused mainly on health information behaviour and user’s perception of health issues in the context of social media. The use of social media with embedded multimedia has increased drastically. As Moorhead, et al. showed, our understandings of multimedia and health communication in the context of social media are limited.
To understand the dynamics of health information behaviour in social media environments, research efforts have attempted to identify the use of social media for health information. Chew and Eysenbach (2010) randomly selected 5,395 tweets about the H1N1 virus out of over two million Twitter posts from May 1 to December 21 in 2009. A content analysis of those 5,395 tweets showed that Twitter posts on H1N1 were primarily used to disseminate information, opinions and experiences. Similarly, with respect to the H1N1 virus, Signorini, Segre and Polgreen (2011) examined postings on Twitter in order to identify health information behaviour. The results indicated that postings on H1N1 were likely to accurately show the reported disease levels. On the other hand, the study by Salathé and Khandelwal (2011) study attempted to show the users’ perceptions on medical events. They evaluated the sentiments for a new vaccine in terms of infectious disease dynamics and control by analysing a data set from 101,853 users during the period of six months. The results indicated that health information tends to flow more between users with the same sentiments. In addition, Garimella, Alfayad and Weber (2016) used tags on Instagram to analyse images providing information regarding lifestyle-related public health, such as obesity, drinking, etc. Images obtained by both manual and automatic tag methods were valuable to infer health statistics on a national level.
On the other hand, users’ perceptions of health-related issues on social media have been investigated in several research endeavours. Heaivilin, Gerbert, Page and Gibbs (2011) analysed a set of 1,000 tweets randomly selected for the content of dental pain from a perspective of health professionals. A majority of tweet postings (83%) mentioned general dental pain, while 22% mentioned an action taken or contemplated on dental pain and 15% stated an impact of dental pain on daily activities in their tweet postings. These results may provide an opportunity for dental professionals to disseminate adequate information. In addition, Scanfeld, Scanfeld and Larson (2010) analysed Twitter postings mentioning antibiotic(s) in order to understand the use of social media for a health related matter. As a means of information sharing with other users, a total of 971 posts were categorized into eleven different groups of information regarding antibiotic(s) and perceived by users.
In sum, previous studies on multimedia and social media have found that the use of images and videos have a significant impact on information dissemination. In addition, we reviewed that users tend to communicate their health issues on social media. In this study, we investigated the use of multimedia tweets for the purpose of communicating emergent health information.
Research method
Data collection
Twitter data were collected between August 25 and September 5, 2016, during which time the reported number of Zika cases increased dramatically (Huetteman and Tavernise, 2016; Sile, 2016). Using the Twitter stream application programming interface, a sample of tweets was collected using “zika” as the query. To sample only active users communicating in English, Spanish tweets were eliminated. One well-known issues of Twitter analysis is that an extremely high number of Twitter accounts are either inactive or spam accounts. Following Barberá et al., we filtered out tweets that were created by accounts with fewer than twenty-five followers and have sent out fewer than 100 tweets (Barberá, Jost, Nagler, Tucker and Bonneau, 2015). As a result, a total of 359,043 tweets were used for the initial analysis.
Concept definition
- Text tweets: Twitter messages without images or videos
- Image tweets: Twitter messages including images
- Video tweets: Twitter messages including videos
- The number of tweets: The total number of Twitter messages, including original tweets and retweets [From Figure 1, 10 tweets (B, C, D, E, F, G, H, I, J, K)]
- The number of original tweets: The number of original Twitter messages posted during the data collection period [From Figure 1, 2 tweets (D, E)]
- The number of retweets: The number of retweeted Twitter messages during the data collection period [From Figure 1, 8 tweets (B, C, F, G, H, I, J, K)]
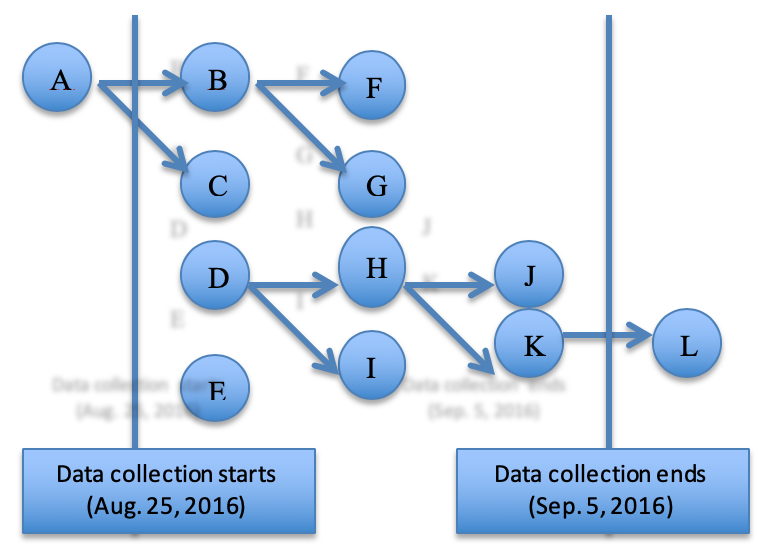
Figure 1: Concepts used in data collection
Content analysis
Subsets of the dataset were manually coded to analyse Twitter agents (e.g., Twitter accounts) and Twitter messages.
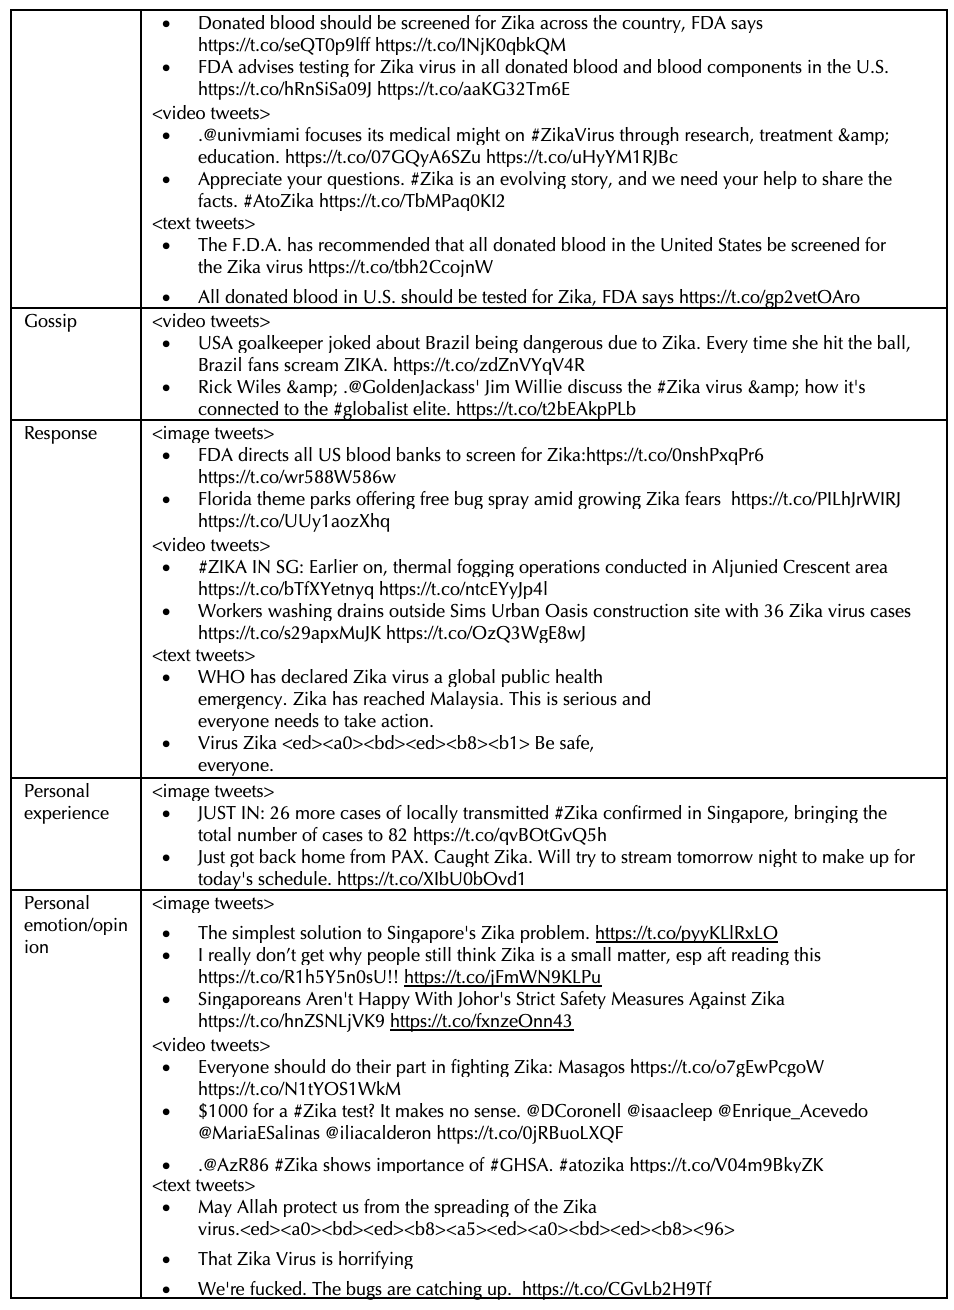
To analyse Twitter agents, we selected the top fifty agents for each of the six groups shown in Table 1 based on the number of original tweets and the number of retweets. A tweet is an original tweet an agent initiates. A retweet is a reposted or forwarded tweet. Since we collected tweets and retweets during a certain period, we do not consider tweets and retweets created outside of the data collection period. For example, we excluded 'A' and 'L' in Figure 1 from our analysis. Although we attempted to select the top fifty agents from each group, for the group of original video tweets, only nineteen agents, each of whom sent out more than one tweet, were analysed. After removing duplicate agents among the six groups, 237 agents were analysed in terms of type of agents and location.
To analyse Twitter messages, 100 Twitter messages were selected from each of the six groups: highly retweeted image tweets, highly retweeted video tweets, highly retweeted text tweets, randomly selected image tweets, randomly selected video tweets and randomly selected text tweets. In the randomly selected tweets category, there were duplicated tweets in the image and video categories. After the removal of duplicated tweets, ninety-six unique randomly selected image tweets and forty-four unique randomly selected video tweets were analysed.
Initial coding schemes were developed by one author with 10% of the randomly selected Twitter agents and Twitter messages by borrowing elements of coding schemes from previously conducted related studies (Golbeck, Grimes and Rogers, 2010; Honeycutt and Herring, 2009; Java et al., 2007; Naaman, Boase and Lai, 2010; Westman and Freund, 2010; Yoon and Chung, 2016). Then, a library and information science graduate student coded the second set of 10% randomly selected agents and tweets using the initial coding schemes and the necessary revisions were made to the initial coding schemes. Then, the same process was conducted with the third set of 20% randomly selected agents and tweets and another library and information science graduate student coded another 10% of agents and tweets. Then, the coding schemes were finalized after considering feedback from both of the graduate students (Table 2; see Appendix A for examples of tweets). The first graduate student coded the entire dataset (237 agents, 550 tweets) and the second graduate student coded 20% of the dataset (48 agents, 110 tweets). Percentage agreements were calculated to check intercoder reliability using Holsti’s (1969) reliability formula. The percentage of intercoder agreement was 86% on average (type of agents: 81%, topics of tweets: 70%, image type: 100%, video type: 92%).
| Type of tweet | No. of selected top agents | No. of tweets or retweets of selected top agent |
|---|---|---|
| Original image tweets | 53 | Agents having 33 or more original tweets |
| Original video tweets | 19 | Agents having 2 or more original tweets |
| Original text tweets | 50 | Agents having 96 or more original tweets |
| Image retweets | 50 | Agents having 214 or more retweets |
| Video retweets | 48 | Agents having 5 or more retweets |
| Text retweets | 50 | Agents having 243 or more retweets |
| Agent | Definition |
|---|---|
| government | accounts that belong to government institutions/branches and political parties from any country (e.g., @womenshealth, @WhiteHouseArchived, @govsingapore) |
| politician | accounts that belong to politicians or government officials who work for government institutions/branches and political parties (e.g., @SenRubioPress, @Schultz44) |
| mainstream news media | accounts that belong to media outlets/affiliates that are well-known in their countries (e.g., @CNN, @STcom, @nytimes) mainstream journalist accounts that belong to journalists who work for news outlets/affiliates that are well-known in their countries (e.g., @ChrisJoseNBC5, @ScottNBC5) |
| online journalist | accounts that belong to journalists who work for news outlets that are not as well-known in their countries (typically online only) (e.g., MelGohCNA, @ANC_News2) |
| online news media | accounts that belong to media outlets that are not as well-known in their countries (typically online only) (e.g., @ChannelNewsAsia, @TODAYonline, @Zika_News) |
| news aggregate | accounts that collect and repost news stories from various other media outlets but do not publish original content (e.g., @zikavirusmap, @Malaysia_RR) |
| individual | accounts that belong to a single person who is not a journalist or a politician (e.g., @Toddkron, @jennanjack) |
| others | accounts that do not fall into any of the above categories (for example, businesses, fan accounts, parody accounts, indeterminate accounts) |
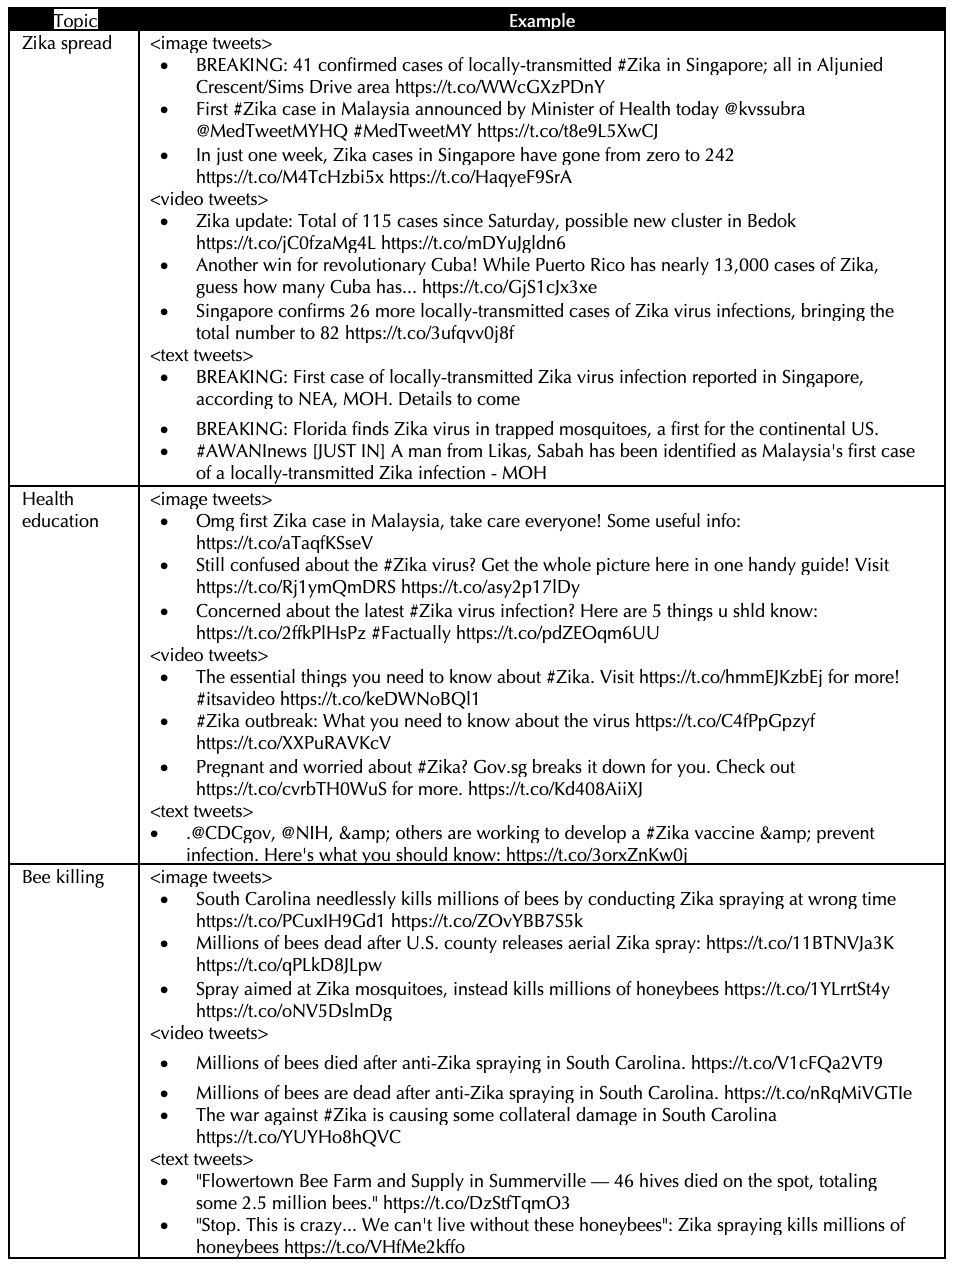
| Topics of tweets (See Appendix A for examples.) | Definition |
| Zika spread | Tweets that have to do with the spread/transmission of the Zika virus or an increase in Zika cases, as well as with specific actions that are being taken to prevent the spread of Zika. Do not include tweets that tell people how to take specific actions; those fall into the “health education” category. |
| Health education | Tweets that provide information in layman’s terms about what the Zika virus is and how people can protect themselves from Zika |
| Bee killing | Tweets that discuss the killing of bees from pesticides used to control the mosquito population |
| Politics | Tweets related to politics/political bodies’ funding of Zika research and fighting |
| Zika facts | Tweets that state scientific facts or news about Zika or have to do with research about and countermeasures taken against the virus |
| Travel | Tweets that discuss Zika’s influence on travel, Zika spread via travel, or people travelling to do Zika research |
| Advocates | Tweets from or about people or groups, the CDC, the FDA and similar organizations from other countries, which are advocating for Zika research, testing and funding without advertising any products |
| Advertisement | Tweets advertising products or techniques meant to prevent the spread of Zika |
| Gossip | Tweets promoting theories or viral ideas about Zika |
| Response | Tweets that describe an individual’s non-advocacy response to the spread of Zika. Response here refers to actions, not emotions or opinions. |
| Personal experience | Tweets focusing on an individual’s personal experiences with Zika |
| Personal emotion or opinion | Tweets describing an individual’s opinion or emotional response to Zika and its spread |
| Other Zika-related | Tweets that do not fall into any of the above categories |
| Non-Zika | Tweets that are not related to Zika |
| Image type | Definition |
| Photo | Photos of scenes, objects and people that appear to be directly taken. |
| Captured picture | Pictures that are captured from other media (screen captures from computers and mobile devices; picture of TV screen, magazine (e.g., a picture of magazine cover page), newspaper (e.g., a picture of the first page of newspaper). |
| Graphics | Mostly computer graphics, but drawings and cartoons are also included. Does not include maps and a graphic of text only. |
| Chart and Graphs | Presentation of quantitative data |
| Map | Maps in the form of photos, drawings, graphics |
| Text | An image of text that is used for disseminating only text information, which usually exceeds 140 characters. |
| Video type | Definition |
| Cartoon | Videos that are animated. Not necessarily cartoons – any videos that are composed solely of graphics |
| Broadcasting news | Professionally created videos, either by news organizations or research facilities, that describe news events and research updates as they relate to Zika |
| Lecture (presentations, speeches, etc.) | Videos that are of people, including politicians, giving speeches or answering questions |
| Home video | Videos that are taken by people or individual journalists, not professional news organizations’ equipment, that depict events happening in public or private places |
| Others | Videos that do not fit into any of the above categories |
Results
In this section, features of multimedia tweets and retweetability, features of agents of multimedia tweets and topical characteristics of multimedia tweets will be reported.
RQ1: How frequently is multimedia content used in Zika-virus-related tweets and retweets?
The number of tweets in the dataset was 358,613 and among them the number of original tweets was 186,575 (52.01% of total tweets). As shown in Figure 2, of the entire dataset, text tweets accounted 76% of the total, image tweets 23% and video tweets were 1%; however, in the set of original tweets, it was found that text tweets made up 87%, image tweets 13% and video tweets 0%. Among the retweeted messages, the percentages of image retweets and video retweets were higher (image tweets: 34%; video: 2%) than those of original tweets. This result shows that multimedia tweets have higher retweetability compared to text tweets. Regarding the average number of retweets per original tweet, the average number of retweets was 2.41 (image), 13.72 (video) and 0.68 (text).
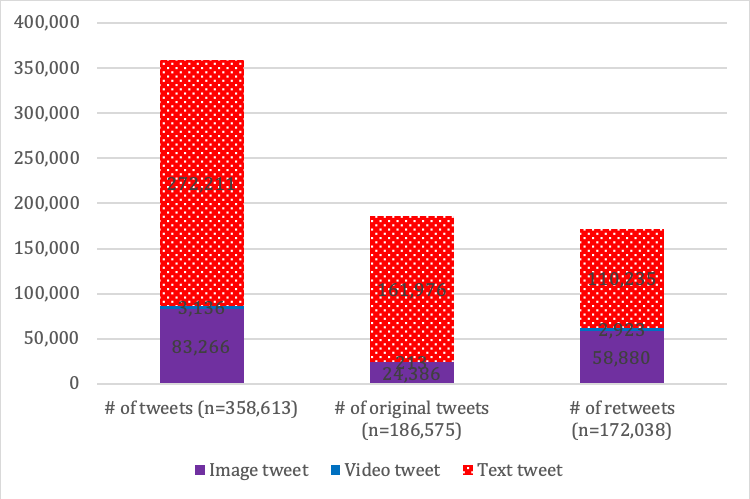
Figure 2: Distribution by media type in all tweets, original tweets and retweets
In order to understand any country-specific impact on the use of multimedia in tweets, we compared the number of tweets originating in each country by multimedia type. Table 3 shows the top countries where tweets were initiated. The countries that reported Zika cases between July 8 and September 5, 2016 were the U.S., Spain, Honduras, Saba, Paraguay, Antigua, Barbuda, Turks and Caicos, Cayman Islands, Puerto Rico, Brazil, Haiti, Guatemala, Bahamas, Singapore, British Virgin Islands, Malaysia and Philippines. Although there were likely different languages used in many of these tweets, for our results we only analysed English language tweets. However, tweets written in English came from various countries, including the U.S., Malaysia, Singapore, Philippines and Brazil. The U.S., Malaysia and Singapore were determined to be the countries most actively initiating tweets about the Zika virus.
| Image tweet | Video tweet | Text tweet | |||
|---|---|---|---|---|---|
| Country | No. of tweets | Country | No. of tweets | Country | No. of tweets |
| United States | 244 | United States | 21 | United States | 2,993 |
| Malaysia | 17 | British Virgin Islands | 1 | Malaysia | 228 |
| Singapore | 16 | Singapore | 1 | Singapore | 171 |
| India | 12 | United Kingdom | 135 | ||
| Canada | 7 | Canada | 94 | ||
| The Netherlands | 6 | India | 66 | ||
| United Kingdom | 6 | Philippines | 53 | ||
| Jamaica | 3 | Australia | 51 | ||
| Mexico | 3 | Brazil | 29 | ||
| Note: The Netherlands has two text tweets; the Republic of the Philippines and Australia have no image tweets. | |||||
RQ2: What are the characteristics of agents that actively send out multimedia tweets?
Among 72,258 unique agents, 67,049 (93%) agents sent out at least one text tweet; 7,775 (11%) agents sent out image tweets and 112 (0.2%) agents sent out video tweets at least once.
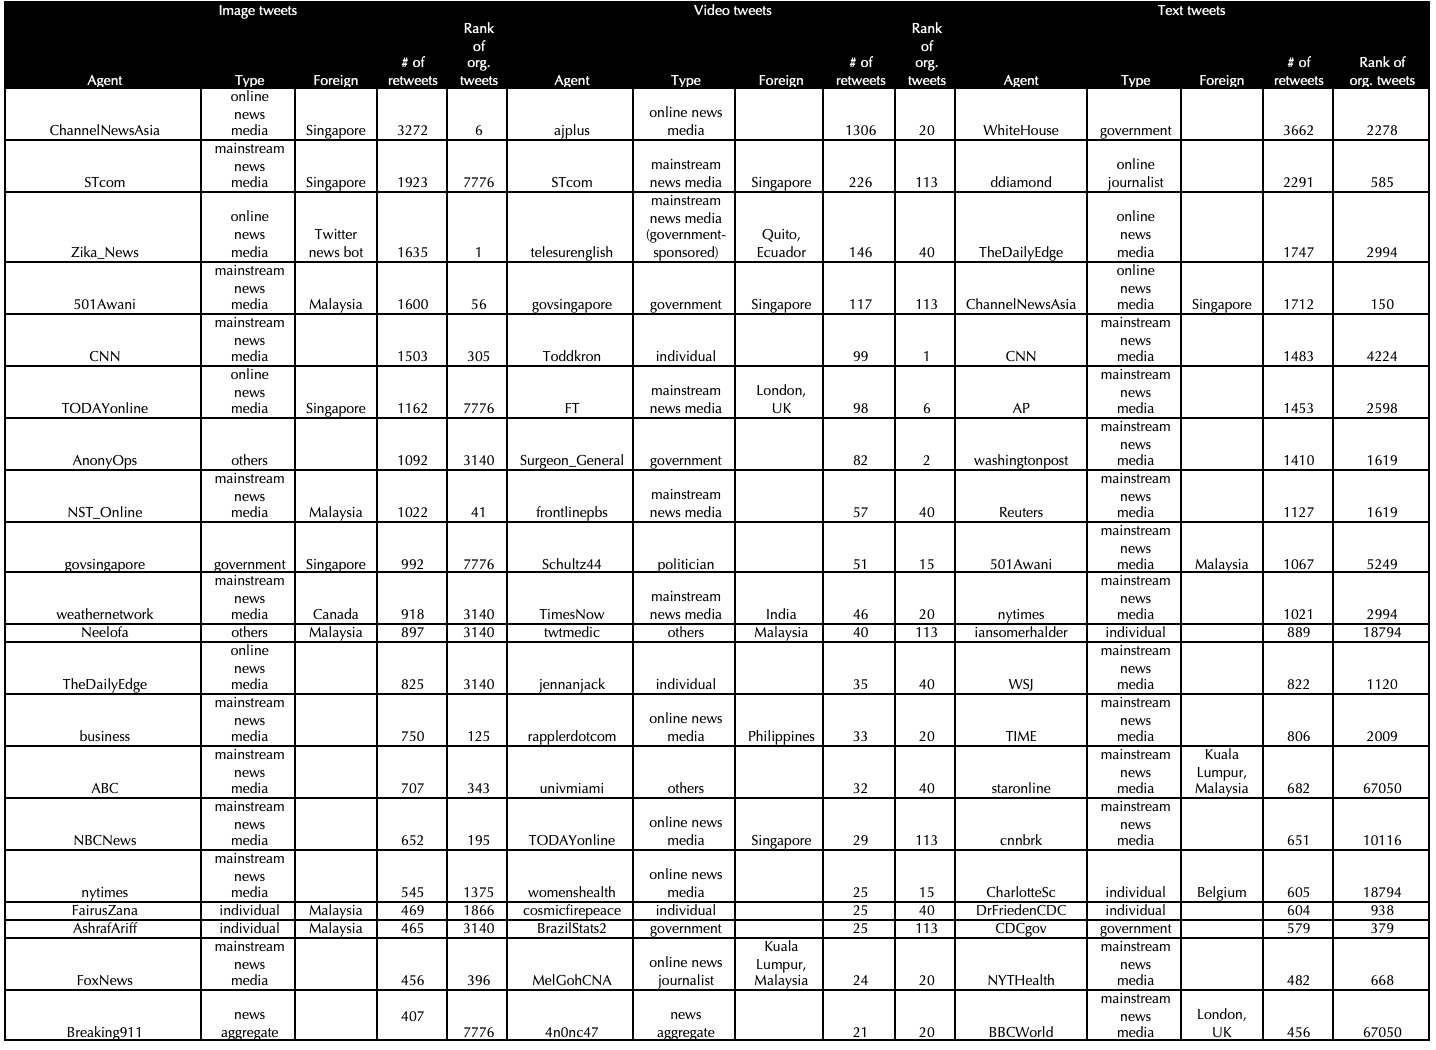
A content analysis was conducted to analyse the types of agents in six sub-groups: top fifty active agents and top fifty influential agents for each media type. In this study, active agent is defined as an agent that actively sent out original tweets and influential agents are those whose tweets were frequently retweeted. First, Figure 3a shows the percentages of active agent types. In the original image-tweets category, individuals (e.g., @LiveEdges, @MasudRanafx2), news aggregates (e.g., @1001ptUS, @intnewsday, @zikavirusmap) and online news media (e.g., @Zika_News, @EbolaRR, @ChannelNewsAsia, @arzillion,) were the main categories of active agents. Regarding active agents of original video-tweets, individuals (e.g., @Toddkron, @MasudRanafx2) were dominant, but government (e.g., @Surgeon_General, @womenshealth), mainstream news media (e.g., @cnnphilippines, @MikeSpearsNBC6, @FT) and mainstream journalists (e.g., @NewsGuyGreg, @ChrisJoseNBC5) agents also contributed. It is notable that original image and text tweets were actively sent out by online news media and news aggregates, whereas, for video tweets, mainstream news media and mainstream journalists were the active agents. This difference could be due to the fact that broadcast news and other media outlets often originate their own videos. As shown in the examples, specialized agents for health or Zika virus and agents in Asian countries were notable as well. Categorical analysis of active agents of text tweets showed similar patterns to those found with active agents of image tweets (Appendix B).
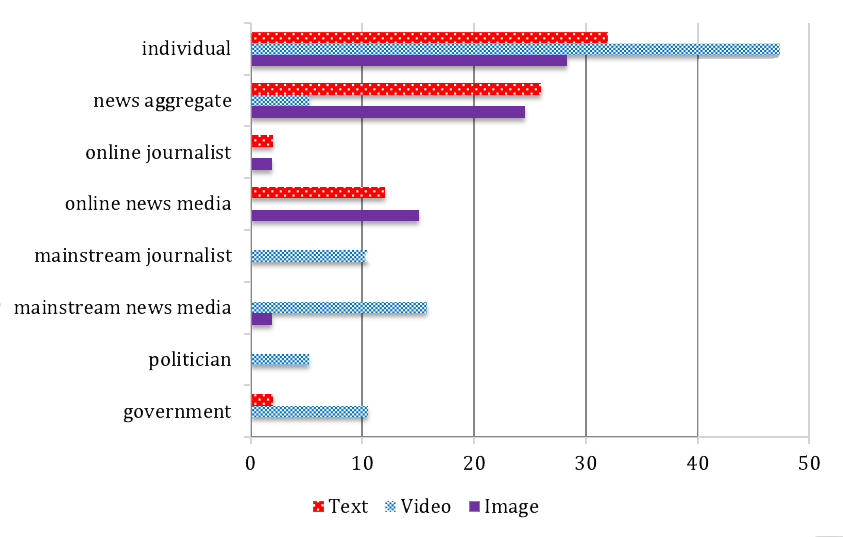
Figure 3a: Distribution of types of active agents (%) |
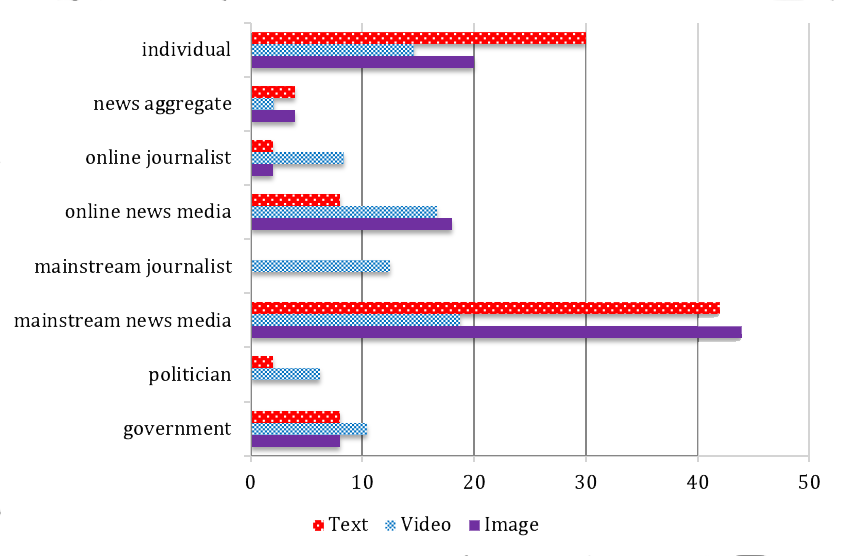
Figure 3b: Distribution of types of influential agents (%) |
Figure 3: Distribution of agent types
Second, comparing active and influential agents, in the case of image tweets, tweets sent by government (e.g., @govsingapore), mainstream news media (e.g., @STcom, @501Awani, @CNN, @NST_Online) and online news media (e.g., @ChannelNewsAsia, @Zika_News, @TODAYonline) were retweeted more often. For video tweets, messages that were tweeted by online news media, online journalists and mainstream news media were often retweeted; however, the list of top twenty most influential agents (Appendix C) shows government (@govsingapore, @BrazilStats2), mainstream news media (@STcom, @FT, @frontlinepbs) and online news media (@ajplus, @rapplerdotcom, @TODAYonline) as agents that generate the most-frequently retweeted tweets. Influential agents of text tweets were also identified as government, mainstream news media and online news media. Based on the researchers’ observations, government, mainstream news media and online news media seem to have more impact on the dissemination of tweets for all three types.
Chi-squared tests were conducted to explore the association between the types of media used and the influential agents. Type of media was found to be significantly associated with the type of agents among active agents (Χ2(16)=41.08, p <0.001). The same test among influential agents showed that the type of media and the type of influential agents were significantly associated (Χ2(16)=31.57, p <0.05). In terms of image tweets, types of agents in active agents and influential agents were significantly associated (Χ2(6)=36.70, p <0.001), just as they were with text tweets (Χ2(7)=38.50, p <0.001). A statistical difference was not found between types of agents in active agents and influential agents in video tweets (Χ2(8)=11.53).
Since this dataset was compiled from English language tweets, there is a limitation to analysing non-US agents; however, the authors still attempted to see the influence of such agents on tweet dissemination within the dataset. As presented in Table 4, 26-28% of active agents were non-U.S. agents and 28-36% of influential agents were non-U.S. agents. It was notable that the ratio of non-U.S. agents was higher for multimedia retweets. This pattern was more clearly shown in Appendix C, which lists the top twenty influential agents. Among these twenty agents, ten (50%) influential agents for image tweets and nine (45%) influential agents for video tweets were non-U.S. agents. Although further investigation is needed, non-US news outlets seemed to have limited English outputs, so video tweets originating from those countries seemed to be more highly retweeted. In the case of text tweets, only five (25%) of influential agents were from countries outside the USA.
| Image tweet | Video tweet | Text tweet | |||
|---|---|---|---|---|---|
| Original tweets | Retweets | Original tweets | Retweets | Original tweets | Retweets |
| 13 (26%) | 18 (36%) | 5 (26%)* | 18 (36%) | 14 (28%) | 14 (28%) |
| Singapore (4) Malaysia (2) India (2) UK (2) Nigeria (1) Wales (1) Canada (1) |
Malaysia (10) Singapore (4) China (2) Canada (2) |
Philippines (1) Bangladesh (1) India (1) UK (1) Europe (1) |
Singapore (7) Philippines (5) Malaysia (2) India (1) UK (1) Australia (1) Ecuador (1) |
Malaysia (3) UK (2) Singapore (1) India (1) Asia Pacific (1) Germany (1) Gurgaon (1) Pretoria (1) Padova (1) Nigeria (1) Canada (1) |
Malaysia (5) Singapore (3) UK (3) Switzerland (1) France (1) Belgium (1) |
| *Based on 19 video original tweets | |||||
RQ3: How are topical characteristics of multimedia tweets characterized in tweets and retweets?
As described in the research method section, a content analysis was conducted with six sub-datasets (100 randomly selected tweets for each of the three media types and the top 100 most highly retweeted tweets for each of the three media types). After eliminating duplicated tweets, a total of 540 tweets was used for the analysis since there were fewer than 100 tweets in terms of video and image tweets respectively.
Figure 4 shows the topical distributions of randomly selected (a) and highly retweeted (b) tweets. Noticeably, depending on the topic, there were differences among the more influential media types that were highly retweeted. Tweets on the spread of Zika, which were mostly news, were more often retweeted when they had images, although all three types of media were evenly used in the randomly selected dataset. Tweets on Zika facts, which reported scientific facts or news, often employed images, but video tweets were more often retweeted. In addition, while almost the same number of tweets were originated regarding Zika spread and Zika facts, the latter category of tweets was strikingly less retweeted compared to the former. Regarding tweets on health education, image and video tweets were often found in both randomly selected tweets and highly retweeted tweets. In terms of bee killing news, image and text tweets were more often retweeted and for tweets on politics, which include research funding requests and other political issues, video and text tweets were often used in the random sample, but text tweets were noticeable among the retweeted tweets. Overall, when considering original tweets, images were often used for educational materials and informative messages (not breaking news), whereas videos were used for educational materials and political speech. However, when considering highly retweeted messages, for informational and educational messages, video tweets were highly retweeted; for brief news, text or image tweets were more often retweeted.
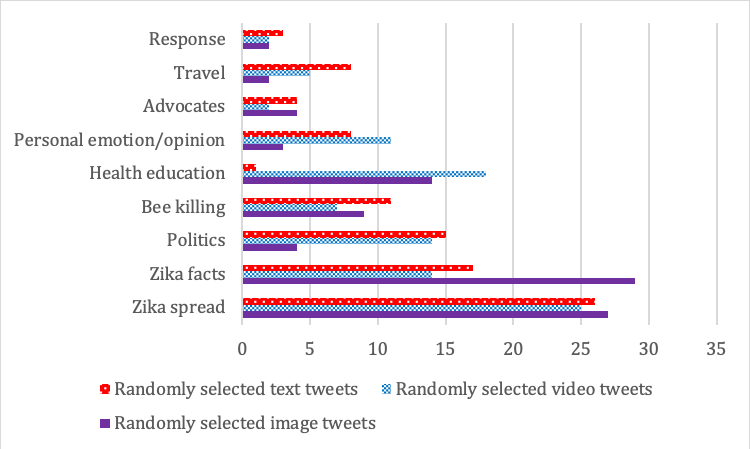
Figure 4a: Topical distribution of randomly selected tweets (%) |
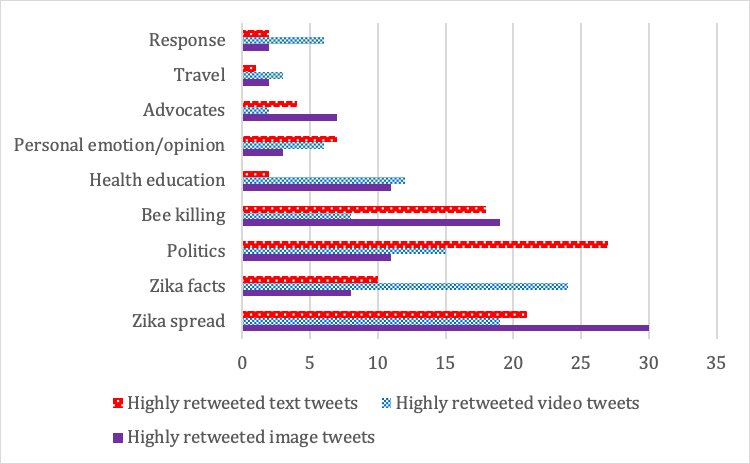
Figure 4b: Topical distribution of highly retweeted tweets (%) |
Figure 4: Topical distribution
The use of image type in each topic category was also investigated. As shown in Figure 5, the overall distribution patterns in terms of image type were similar for both randomly selected image tweets and highly retweeted image tweets: approximately two-thirds of image tweets had photos and one quarter had graphics. Image tweets that shared information or news, such as the spreading of Zika and bee killings, often used photos; whereas for health education and personal emotion or opinion tweets, graphics were dominantly used. For Zika facts and politics, photos were dominant in randomly selected tweets, but graphic tweets were often found among highly retweeted tweets.
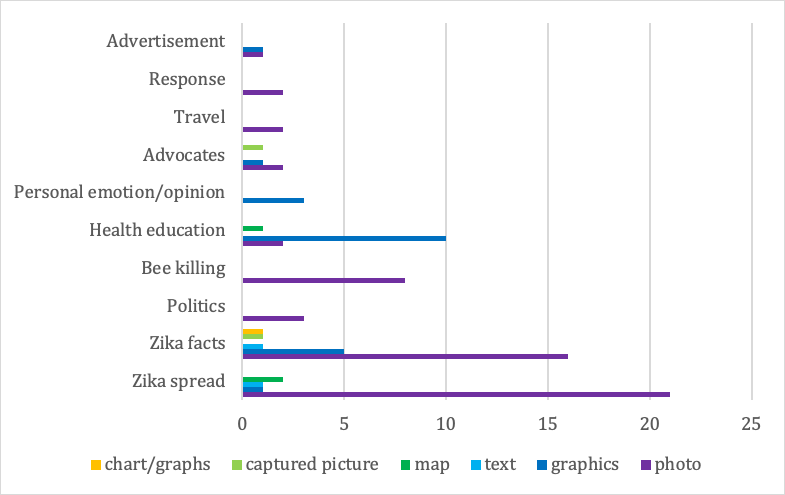
Figure 5a: Randomly sampled image tweets (%) |
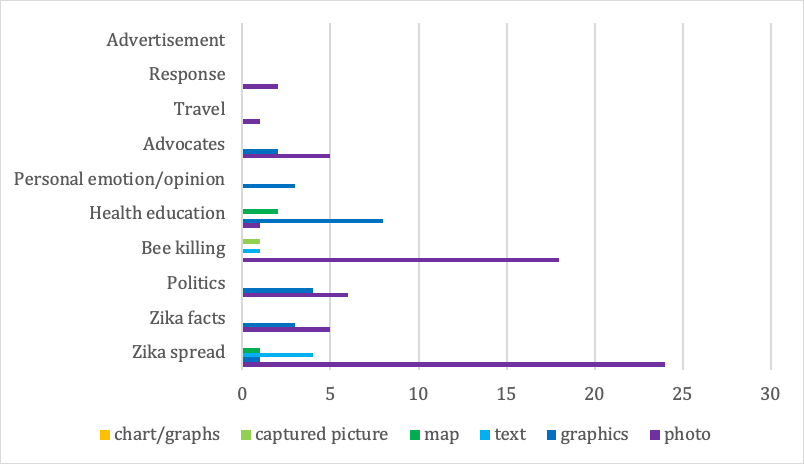
Figure 5b: Highly retweeted image tweets (%) |
Figure 5: Image types and topics of tweets
Figure 6 shows the relationship between video types and topics of tweets. For both randomly selected video tweets and highly retweeted video tweets, broadcasting news video was the most dominant type, followed by lecture (including speech and presentation), home video and cartoon. Again, for video tweets that shared news, including categories such as Zika spread, Zika fact and bee killings, broadcast news videos were dominantly used. Lecture videos, which include presentations and speeches, were used for health education and politics. Health-education-related tweets were often delivered through cartoons, in addition to lectures.
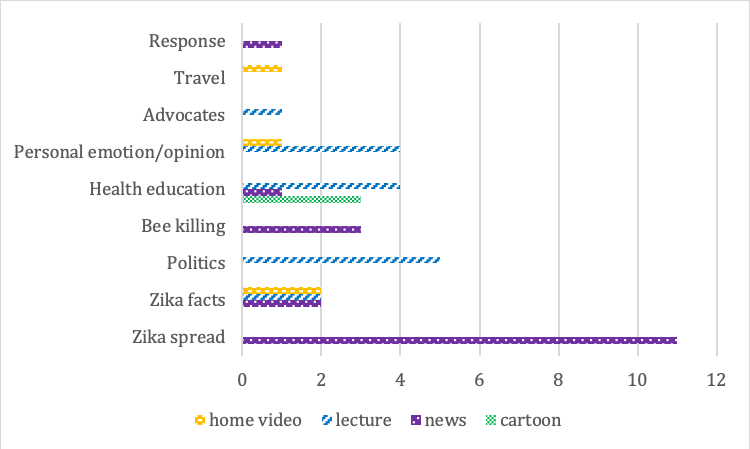
Figure 6a: Randomly sampled video tweets (%) |
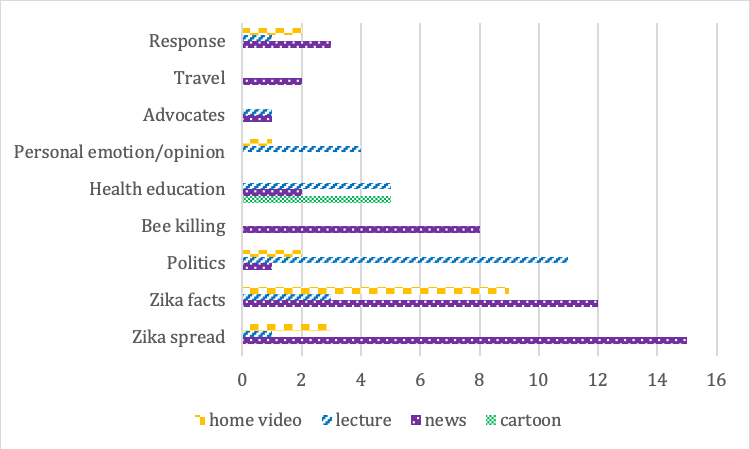
Figure 6b: Highly retweeted video tweets (%) |
Figure 6: Video types and topics of tweets
Figure 7 shows the relation between topics of tweets and types of agents by analysing original agents of highly retweeted tweets. For the image tweets, mainstream news media was dominant in several categories, including Zika spread, bee killing, Zika fact, advocate and so on and government accounts were prominent in the categories of health education and politics. However, from the video tweets, videos from individual people were notable; for example, Zika facts video tweets were often from mainstream journalists, while politics tweets were from politicians and individuals. Also, videos from governments were noticed in several categories, even if they make up a small portion of the tweets in those categories, including Zika spread, Zika facts, travel, advocates, response and more. For Zika spread and Health education, as with image tweets, mainstream news media and government were the major types of agents, respectively.
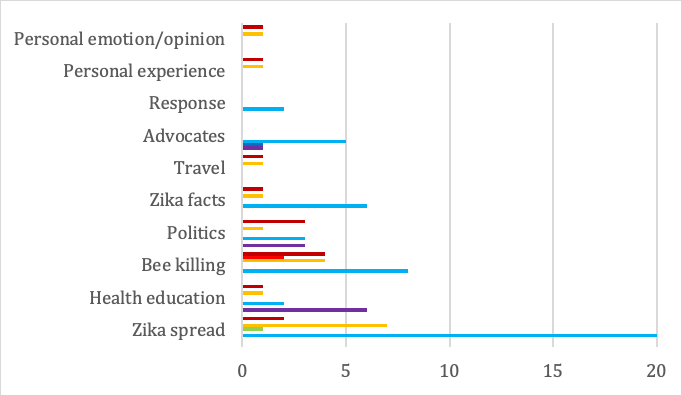
Figure 7a: Image tweets (%) |
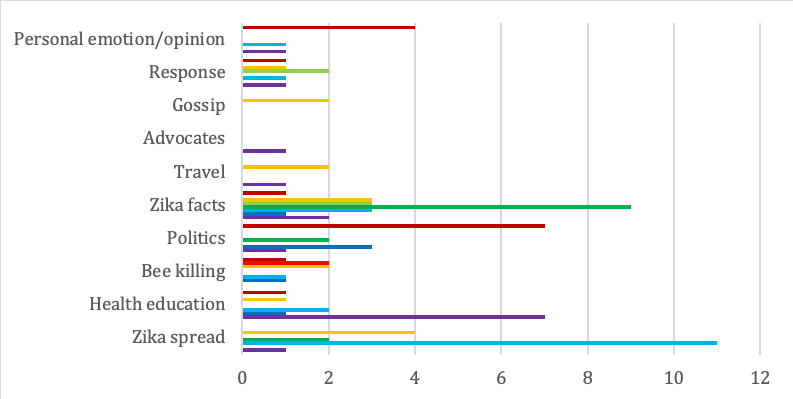
Figure 7b: Video tweets (%) |
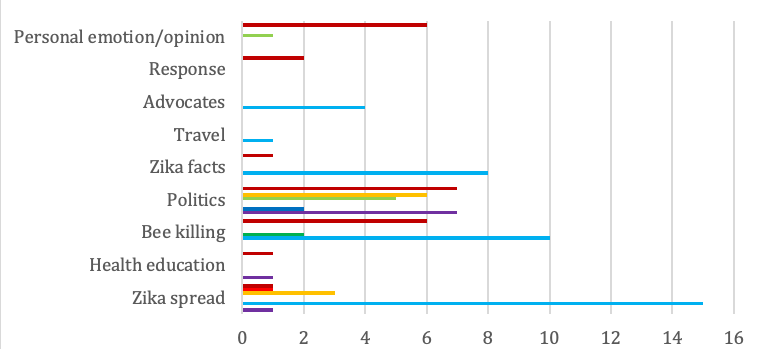
Figure 7c: Text tweets (%)
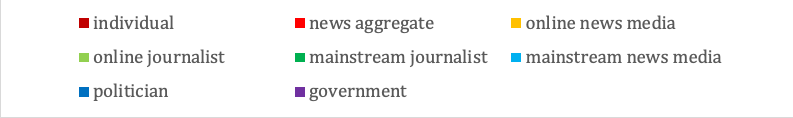
Figure 7: Tweet topics and agent types
Discussion
Our content analyses of Twitter communications during the Zika outbreak showed that agents frequently circulated information related to the spread of disease, facts, politics and health education in emergency health situations. Our findings advance previous knowledge that the use of multimedia is positively associated with higher retweetability (Zhao, Zhu, Quan and Zhao, 2013) by providing evidence on the impact of multimedia at a granular level. We discuss implications of our findings and limitations in the following subsections.
Topics and use of multimedia
The types of multimedia used in tweets seem to be associated with the content and purpose of communication. On the one hand, photo images are widely used for news and information sharing and graphic images are frequently adopted for health education and for sharing personal emotions/opinions. To provide one example, one of the most popularly retweeted tweets included an infographic created by the World Health Organization (WHO), which included the definition, symptom, prevention measures and treatment for the Zika virus (Figure 8). This infographic included highly useful information in a precise format. On the other hand, both text and images were effectively adopted for tweets regarding Zika news. These findings suggest that it is a good strategy to consider the type of multimedia suitable for the content and purpose of the communication. Our findings also suggest that use of a graphic image is recommended for health education and for sharing personal emotions/opinions. For the same reason, when the purpose of a tweet is for information sharing, use of text or photo images would be a good strategy to enhance the retweetability of one’s tweet.
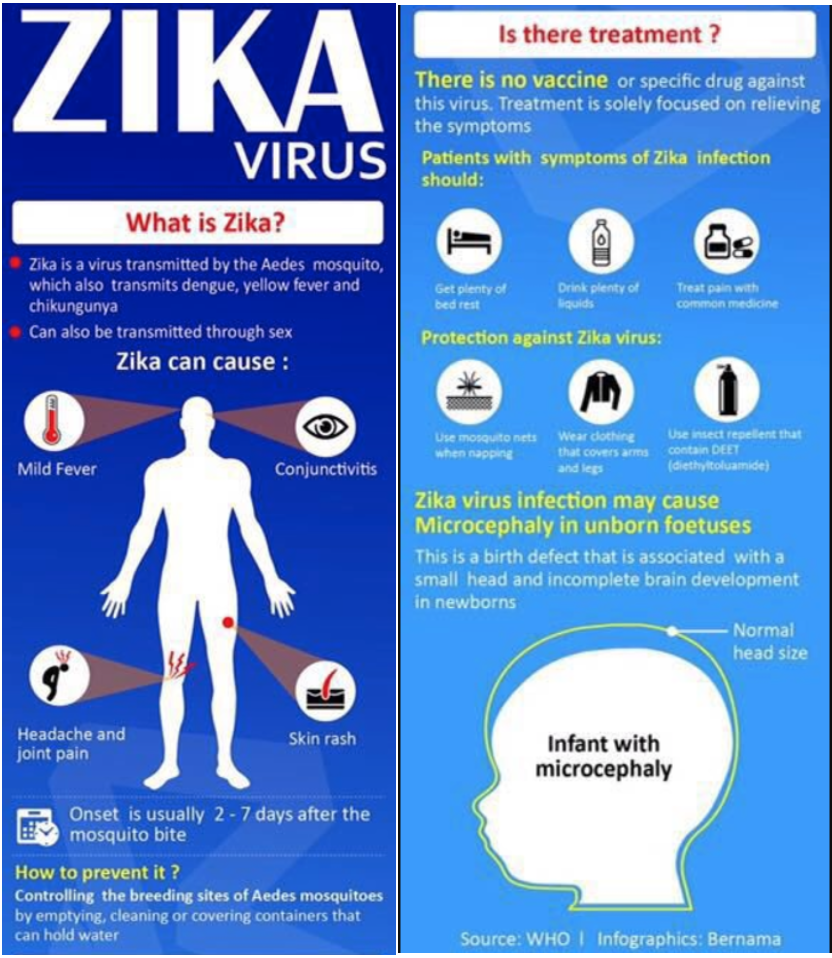
Figure 8: Infographic from a highly retweeted tweet
Use of multimedia by agent types
Mainstream and online media and government seem to be influential agents based on the number of retweets. This finding is consistent with the observation that government and news agencies are perceived as highly trusted information sources in not only medical emergencies (Hagen et al., 2017), but also other emergent situations, like the Boston marathon bombing (Yoon and Chung, 2016). In terms of multimedia use by agent types, we observed that use of video by government, online/mainstream journalists, online media and politicians were highly effective, while texts and images were more effective when used by mainstream media and individuals. It is interesting to know videos used by mainstream media outlets are not highly retweeted compared to images and texts used. We need a future study to explain why videos by mainstream news media and individuals are associated with a relatively low retweetability.
Health communication during crises
One highlight of the study was in finding governments’ efforts to communicate health education material using multimedia. We found that video tweets were highly effective for health education during the Zika health situation. During public health crises, people search for trustworthy information focusing on specific topics to share useful facts, news and opinions that are formulated for easy understanding (Hughes and Palen, 2009). Based on our findings, we recommend the use of graphic images and video (specifically cartoons and lectures) for communicating health education materials during emergent health situations.
Study of multimedia use by non-US actors
This study’s findings show that non-US actors are disproportionate in their use of videos in their tweets, using text-only tweets far less frequently. This might be related to the fact that the maximum number of allowed characters was 140 at the time of data collection. When it comes to actors whose native language is not English, their language limitation may be a motivating factor to embed videos in order to achieve a more far-reaching communication. This finding suggests that one should consider using video for communications during infectious disease outbreaks because audiences are likely to be in many countries.
Limitations
In this descriptive study, we found associations between multimedia use and agents as well as content during an emergent health situation. Although the study provides a useful snapshot of multimedia use, it does not explain why the use of specific multimedia is influential depending on agents or contents. For example, we cannot provide satisfactory explanation on why video tweets initiated by governments are highly successful while use of video by individuals and mainstream media are not successful. More studies are needed to investigate reasons of this variability. In addition, our study is not generalizable because it is based on one case study of Zika outbreak. During emergency events, factors influencing retweetability is not the same as non-emergency situations. For example, number of followers, use of hashtags and URLs had a negative impact on retweetability during the Japanese Earthquake incident in 2011 (Pervin et al., 2014). Multiple experiments using diverse emergency cases will be necessary to derive generalizable knowledge on multimedia use during emergent health situations. Also, since our study exclusively analysed English tweets, it may not provide an overall view of Twitter practices from non-English communities and countries.
Conclusion
Our goal for this study was a better understanding of the characteristics and retweetability of multimedia tweets regarding the Zika virus. This study analysed 358,613 tweets collected between August 25, 2016 and September 5, 2016. A key finding is that text tweets are sent out more frequently than multimedia tweets, but multimedia tweets have more retweetability. Image and text tweets were actively sent out by online news media and news aggregates, whereas for video tweets, mainstream news media and mainstream journalists were more active agents. These discrepancies could be due to the fact that many videos are produced by mainstream news media outlets themselves. Retweetability demonstrated that government, mainstream news media and online news media have more of an impact on the dissemination of tweets when it comes to multimedia tweets. The ratio of non-US agents is higher in multimedia retweets; although further investigation is needed, it is assumed that non-US media have limited news, particularly in English, so tweets which originate from those countries are more highly retweeted. Although images were often used for educational and informative tweets and videos for educational lectures and political speech, highly retweeted messages showed a different pattern. Highly retweeted image tweets were brief news tweets and highly retweeted video tweets were educational or informative tweets. It seems that people prefer seeing image tweets or reading text tweets rather than watching videos for brief/simple news.
This study has a practical implication in the use of multimedia during emergent health situations. Our findings can help government and business practitioners build their social media communication strategies in order to effectively select proper contents and multimedia formats to enhance the impact of information sharing and communications during emergent health situations. This study also contributes to theory development in social media and use of multimedia. First, we have devised granulated categories of multimedia types based on a real-life dataset of the recent Zika outbreak. Second, we found topical categories the social media users are mainly interested in and the use of multimedia by these topics, during a health emergent situation. Third, we found that selecting a proper multimedia format in accordance to the goal of communication and information sharing is important for increased retweetability. Future studies are necessary to explain the reasons of the discrepancy between multimedia types and retweetability.
Acknowledgements
The authors would like to thank research assistants, Mary Kate Downing and Carrie Cullen, for help in data analysis. Loni Hagen was partially supported by the National Research Foundation of Korea Grant funded by the Korean Government (NRF-2017S1A3A2066084).
About the authors
Dr. JungWon Yoon is an Associate Professor in the School of Information at University of South Florida, Tampa, FL 33620, U.S.A. Her research areas include visual information behaviour, visual communication in social media, data citation and information behaviour of under-served people, particularly in the contexts of everyday life information seeking and health information seeking. She received her Bachelor's degree in Library and Information Science and Master of Library and Information Science from Ewha Womans University, Seoul, Korea and her Ph.D. in Information Science from the University of North Texas. She can be contacted at jyoon@usf.edu
Dr. Loni Hagen is an Assistant Professor at the School of Information at the University of South Florida. She received her master’s degree in Information Studies from University of Tokyo and earned her PhD in Information Science from University at Albany, SUNY. Her primary research focuses on adopting machine learning and artificial intelligence for policymaking and discuss implication of these technologies on policy improvement. Her current domain of interests are e-participation, privacy, cybersecurity and health emergency communication. She can be contacted at lonihagen@usf.edu
Dr. James Andrews is Director of the School of Information, University of South Florida, and Associate Professor of Information Science. His research and teaching interests fall broadly within the interdisciplinary field of health informatics with specific interests in health-related information behaviour in the context of cancer genetics, as well as terminology standards in health. He can be contacted at jimandrews@usf.edu
Ryan Scharf is a Risk Analyst at American Integrity Insurance Company, Tampa, FL 33609, USA who uses big data to describe and model human behaviour as well as to improve decision making processes. He received his Bachelor’s degree in Information Studies from the University of South Florida, concentrating in data science and analytics. He can be contacted at ryan.scharf@gmail.com
Dr. Thomas Keller is a bioinformatics researcher working with the Kami Kim Lab and Research Computing at the University of South Florida, Tampa, FL 33620, USA. His current interests are in the use of data mining and machine learning to investigate questions relating to computational and evolutionary biology, health analytics and network dynamics in social media. He received his Bachelor’s degree in Zoology from the University of Florida and his PhD from the University of Texas at Austin in ecology, evolution and behaviour. He can be contacted at tekeller@usf.edu
Dr. EunKyung Chung is a Professor in the Department of Library and Information Science at the Ewha Womans University, Seoul 03760, South Korea. She received her Bachelor’s degree in Library and Information Science from Ewha Womans University, her master’s degree in Computer Science and Ph.D. in Information Science from the University of North Texas. Her research interests are on the areas of visual information retrieval and informetrics. She can be contacted at echung@ewha.ac.kr
References
- Barberá, P., Jost, J. T., Nagler, J., Tucker, J. A. & Bonneau, R. (2015). Tweeting from left to right: is online political communication more than an echo chamber? Psychological Science, 26(10), 1531-1542.
- Chen, T., Lu, D., Kan, M. Y. & Cui, P. (2013). Understanding and classifying image tweets. In Proceedings of the 21st ACM international conference on Multimedia (pp. 781-784). New York, NY: ACM.
- Chew, C. & Eysenbach, G. (2010). Pandemics in the age of Twitter: content analysis of tweets during the 2009 H1N1 outbreak. PloS one, 5(11), Retrieved from http://journals.plos.org/plosone/article?id=10.1371/journal.pone.0014118 (Archived by WebCite® at http://www.webcitation.org/6yYddMuOf)
- Chung, E. and Yoon, J. (2013). An analysis of image use in Twitter messages. Journal of Korea Biblia Society for Library and Information Science, 24(4), 75-90.
- Garcia-Retamero, R. & Cokely, E. T. (2013). Communicating health risks with visual aids. Current Directions in Psychological Science, 22(5), 392-399.
- Garimella, V. R. K., Alfayad, A. & Weber, I. (2016). Social media image analysis for public health. In Proceedings of the 2016 CHI Conference on Human Factors in Computing Systems, (pp. 5543-5547). New York, NY: ACM.
- Golbeck, J., Grimes, J. M. & Rogers, A. 2010. Twitter use by the U.S. Congress. Journal of the American Society for Information Science and Technology, 61(8), 1612–1621.
- Hagen, L., Keller, T., Neely, S., DePaula, N. & Robert-Cooperman, C. (2017). Crisis communications in the age of social media: a network analysis of Zika-related tweets. Social Science Computer Review.
- Heaivilin, N., Gerbert, B., Page, J. E. & Gibbs, J. L. (2011). Public health surveillance of dental pain via Twitter. Journal of Dental Research, 90(9), 1047-1051.
- Holsti, O.R. (1969). Content analysis for the social sciences and humanities. New York, NY: Addison-Wesley.
- Honeycutt, C. & Herring, S. C. (2009). Beyond microblogging : conversation and collaboration via Twitter. In Proceedings of the 42nd Hawaii International Conference on System Sciences, (pp. 1–10). New York, NY: IEEE.
- Houts, P. S., Doak, C. C., Doak, L. G. & Loscalzo, M. J. (2006). The role of pictures in improving health communication: a review of research on attention, comprehension, recall & adherence. Patient Education and Counseling, 61(2), 173-190.
- Huetteman, E. & Tavernise, S. (2016, September 6). Senate Democrats block Zika Bill over planned parenthood provisions. The New York Times. Retrieved from http://www.nytimes.com/2016/09/07/us/politics/zika-senate-congress.html (Archived by WebCite® at http://www.webcitation.org/6yYgUsokn)
- Hughes, A. L. & Palen, L. (2009). Twitter adoption and use in mass convergence and emergency events. International Journal of Emergency Management, 6(3–4), 248–260.
- Java, A., Song, X., Finin, T. & Tseng, B. (2007). Why we twitter: understanding microblogging usage and communities. In Proceedings of the 9th WebKDD and 1st SNA-KDD 2007 workshop on Webmining and social network analysis, San Jose, California — August 12 - 12, 2007, (pp. 56–65). New York, NY: ACM.
- Joffe, H. (2008). The power of visual material: persuasion, emotion and identification. Diogenes, 55(1), 84-93.
- Mayer, R. E. (Ed.). (2005). The Cambridge handbook of multimedia learning. Cambridge: Cambridge University Press.
- MedlinePlus. (n.d.) Zika. Retrieved from https://medlineplus.gov/zikavirus.html (Archived by WebCite® at http://www.webcitation.org/77aCISDaQ)
- Moorhead, S. A., Hazlett, D. E., Harrison, L., Carroll, J. K., Irwin, A. & Hoving, C. (2013). A new dimension of health care: systematic review of the uses, benefits & limitations of social media for health communication. Journal of Medical Internet Research, 15(4).
- Morgan, E. M., Snelson, C. & Elison-Bowers, P. (2010). Image and video disclosure of substance use on social media websites. Computers in Human Behavior, 26(6), 1405-1411.
- Naaman, M., Boase, J. & Lai, C. (2010). Is it really about me? Message content in social awareness streams. In Proceedings of the 2010 ACM Conference on Computer Supported Cooperative Work, (pp. 189–192). New York, NY: ACM.
- Naik, P. A. & Raman, K. (2003). Understanding the impact of synergy in multimedia communications. Journal of Marketing Research, 40(4), 375-388.
- Pervin, N., Takeda, H. & Toriumi, F. (2014). Factors affecting retweetability: an event-centric analysis on Twitter. In Michael D. Myers and Detmar W. Straub, (Eds.). Proceedings of the International Conference on Information Systems - Building a Better World through Information Systems, {ICIS} 2014, Auckland, New Zealand, December 14-17, 2014 (p. 10). Atlanta, GA: Association for Information Systems.
- Rantasila, A., Sirola, A., Kekkonen, A., Valaskivi, K. & Kunelius, R. (2018). #fukushima five years on: a multimethod analysis of Twitter on the anniversary of the nuclear disaster. International Journal of Communication, 12(1), 928-949.
- Salathé, M. & Khandelwal, S. (2011). Assessing vaccination sentiments with online social media: implications for infectious disease dynamics and control. PLoS Computational Biology, 7(10).
- Scanfeld, D., Scanfeld, V. & Larson, E. L. (2010). Dissemination of health information through social networks: Twitter and antibiotics. American Journal of Infection Control, 38(3), 182-188.
- Signorini, A., Segre, A. M. & Polgreen, P. M. (2011). The use of Twitter to track levels of disease activity and public concern in the US during the influenza A H1N1 pandemic. PloS one, 6(5).
- Sile, A. W. (2016, September 4). Singapore’s Zika outbreak jumps to 242 cases, as potential new cluster emerges. CNBC. Retrieved from http://www.cnbc.com/2016/09/04/singapores-zika-outbreak-jumps-to-242-cases-as-potential-new-cluster-emerges.html (Archived by WebCite® at http://www.webcitation.org/6yYzQFQbx)
- Snyder, J. (2014). Visual representation of information as communicative practice. Journal of the Association for Information Science and Technology. 65(11), 2233-2247.
- Syed-Abdul, S., Fernandez-Luque, L., Jian, W. S., Li, Y. C., Crain, S., Hsu, M. H. & Liou, D. M. (2013). Misleading health-related information promoted through video-based social media: anorexia on YouTube. Journal of Medical Internet Research, 15(2).
- Thelwall, M., Goriunova, O., Vis, F., Faulkner, S., Burns, A., Aulich, J. & D'Orazio, F. (2016). Chatting through pictures? A classification of images tweeted in one week in the UK and USA. Journal of the Association for Information Science and Technology, 67(11), 2575-2586.
- Timeline-Zika’s origin and global spread. (2016, February 25). Reuters BJDEVTEST. Retrieved from https://www.reuters.com/article/health-zika-origin-idUSL2N1641YI (Archived by WebCite® at http://www.webcitation.org/77YWCwrch)
- Ulloa, L. C., Mora, M. C. M., Pros, R. C. & Tarrida, A. C. (2015). News photography for Facebook: effects of images on the visual behaviour of readers in three simulated newspaper formats. Information Research, 20(1), paper 660. Retrieved from http://InformationR.net/ir/20-1/paper660.html. (Archived by WebCite® at http://www.webcitation.org/6yZ0CQR7o)
- Vis, F., Faulkner, S., Parry, K., Manyukhina, Y. & Evans, L. (2013). Twitpic-ing the riots: analysing images shared on Twitter during the 2011 UK riots. Twitter and society. New York, Peter Lang, 385-398.
- Westman, S. & Feund, L. (2010). Information interaction in 140 characters or less: genres on Twitter. In Proceedings of the Third Symposium on Information Interaction in Context, New Brunswick, NJ, USA — August 18 - 21, 2010 (pp. 323–327). New York, NY: ACM.
- Westman, S. and Oittinen, P. (2006). Image retrieval by end-users and intermediaries in a journalistic work context. In Proceedings of the 1st International Conference on Information Interaction in Context, Copenhagen, Denmark — October 18 - 20, 2006 (pp. 102-110). New York, NY: ACM.
- Yoon, J. and Chung, E. (2016). Image use in social network communication: a case study of tweets on the Boston marathon bombing. Information Research, 21(1), paper 708. Retrieved from http://InformationR.net/ir/21-1/paper708.html (Archived by WebCite® at http://www.webcitation.org/6frHtnziA)
- Zhao, X., Zhu, F., Qian, W. & Zhou, A. (2013). Impact of multimedia in Sina Weibo: popularity and life span. Semantic Web and Web Science (pp. 55-65). Springer, New York, NY.
- Zika virus. (2018). MedlinePlus. Retrieved from https://medlineplus.gov/zikavirus.html (Archived by WebCite® at http://www.webcitation.org/77YWWrv1f)
How to cite this paper
Appendices
Appendix A: Examples of tweets
 |  |
 |
Appendix B: List of top twenty agents of original tweets
Appendix C: List of top twenty agents of retweets