Available, but not accessible? Investigating publishers' e-lending licensing practices
Rebecca Giblin, Jenny Kennedy, Kimberlee Weatherall, Daniel Gilbert, Julian Thomas and François Petitjean.
Introduction. We report our mixed-methods investigation of publishers’ licensing practices, which affect the books public libraries can offer for e-lending.
Method. We created unique datasets recording pricing, availability and licence terms for sampled titles offered by e-book aggregators to public libraries across Australia, New Zealand, Canada, the United States and United Kingdom. A third dataset records dates of availability for recent bestsellers. We conducted follow-up interviews with representatives of five e-book aggregators.
Analysis. We quantitatively analysed availability, licence terms and price across all aggregators in Australia, snapshotting the competitive playing field in a single jurisdiction. We also compared availability and terms for the same titles from one aggregator across five jurisdictions and measured how long it took for a sample of recent bestsellers to become available for e-lending. We used data from the aggregator interviews to explain the quantitative findings.
Results. Contrary to aggregator expectations, we found considerable intra-jurisdictional price and licence differences. We also found numerous differences across jurisdictions.
Conclusions. While availability was better than anticipated, licensing practices make it infeasible for libraries to purchase certain kinds of e-book, particularly older titles. Confidentiality requirements make it difficult for libraries to shop (and aggregators to compete) on price and terms.
Introduction
Public libraries have long played a crucial role connecting books with readers. But their continuing relevance is being challenged by steady declines in literary reading (Twenge, Martin and Spitzberg, forthcoming; Wilson, 2017), the emergence of alternative entertainment forms (Twenge et al., forthcoming), competition from literary subscription services (such as Amazon’s Kindle Unlimited) and widespread budget cuts. They face other hurdles too: the growth of shift and gig-based work disconnecting community members from traditional library opening hours; new migrants looking for works in their mother tongues; resources spread thinly over enormous distances (Public Library Working Group, 2018); populations with impairments to mobility and vision. Recognising these challenges, libraries are recasting their social roles and purpose (Aabø and Audunson, 2012).
In this recasting, the lending of e-books (e-lending) is critical to libraries’ abilities to satisfy their cultural and social objectives in the changing social and technological environment. It promises greater access to books, particularly backlist titles (Wilson and Maceviciute, 2016) as well as new ways of reaching those disenfranchised from bricks-and-mortar libraries. It also potentially enables physical shelf space to be freed up for other community activities. But the legal framework does not guarantee that books will be made available to libraries for e-lending. Copyright grants rights over individual electronic uses of books, meaning that publishers have considerable control over whether to make e-books available, when, for how long & on what terms (Giblin and Weatherall, 2015).
From a publisher perspective, e-books and e-lending are disruptive technologies, viewed with ambivalence (Bergström et al., 2017; Wilson, 2014). The convenience of e-lending makes it potentially a closer substitute to purchase & hence a greater threat to other consumer markets. On the other hand, the marginal cost of distributed production for e-books is close to zero & library purchasing adds a valuable additional revenue stream (Bergström et al., 2017). Publishers serve this market by licensing books to aggregators (Zhang and Senchyne, 2017), typically multiple aggregators that compete within a jurisdiction.
E-books in public libraries
E-books have become a central part of public library collections worldwide. The leading global provider, Rakuten OverDrive (OverDrive), reported ten million checkouts in 2008 (including not just e-books but also e-audio, music and video) (OverDrive, 2009). Ten years later that had exploded to 274 million, including 185 million e-book loans (OverDrive, 2019). To put that in perspective, PubTrack Digital reported 162 million global e-book sales, from 450 commercial publishers, in 2017 (Milliot, 2018).
E-books do not take up physical space in libraries, but nonetheless compete for other resources. As of 2009, some 46% of US public library survey respondents reported reallocating funds from physical formats to digital formats (Genco, 2009).
Gaps in the literature
Investigations into the availability and use of e-books in libraries to date have been largely through interviews and surveys of librarians and readers about such matters as how they value the availability and experience of e-lending & the degree of take-up (e.g., Ashcroft, 2011; Bergström et al., 2017; Blackwell, 2017; Girard, 2014; Martindale, 2015; McKnight and Dearnley, 2003). Some scholars have also used interviews and surveys to reach other players in the book market, such as authors, publishers and booksellers (Bergström et al., 2017).
However, despite the growing importance of e-books for public libraries, there is not yet been any published, detailed analysis of what books are available to libraries as e-books for lending, what they cost, or what licence terms are offered, nor of how these differ across platforms and across jurisdictions (Yoonmo, 2017), or among publishers and publisher types.
Better data on these questions is critical. Publishers exercising their rights to control library uses of e-books have the potential to substantially impact public libraries’ abilities to fulfil their missions (Giblin and Weatherall, 2015). But nobody made any deliberate decision to regulate e-books differently to physical ones; instead, it’s simply a consequence that flows from the nature of digital. Thus, having a clear understanding of how those rights are in fact being exercised is a crucial prerequisite to discussions about potential reforms to law, policy and practice. That includes discussions about what rights publishers should have to limit access & how authors and publishers should be compensated when e-books are made available for library lending.
Research questions
We sought to fill this gap by answering the following questions:
- How do title availability, price and terms differ across aggregators in a single market?
- On a title level, how do those aspects differ across countries?
- How does library e-book availability and pricing compare to that for physical copies?
- How long after publication do bestselling titles become available for e-lending?
We were also interested in assessing whether there were observable differences between publishers, in particular between the big five (Penguin Random House, Hachette, HarperCollins, Simon & Schuster, Macmillan and their imprints) versus other publishers. We used a mixed methods approach, enriching our quantitative findings with insights obtained in subsequent interviews with aggregators. The following section explains our methods in more detail; this is followed by our findings & then further discussion and conclusions. The final sectgion briefly details our planned programme of future work.
Methods
We investigated the research questions through three studies, each involving creation of a unique new dataset:
1. The Australia-focused study. We collected availability, licence and price data for a sample of 546 books across all five key aggregators (OverDrive, Bolinda, Wheelers, James Bennett and Bibliotheca) operating in Australia. We also compiled comparative availability and pricing data for physical copies of those titles. As it contains comprehensive data for all aggregators operating within a single market, this study enables new understanding of how availability, terms and pricing can differ within a single jurisdiction & assessment of what those differences might mean for libraries and aggregators.
2. The internationally-focused study. We collected the same data as for the Australia study, but this time from a single aggregator across five territories (Australia, New Zealand, the UK, the US and Canada). By collecting data for these significant English-language jurisdictions, this study enables meaningful comparison at a title level, enabling new understanding of cross-jurisdictional differences.
3. The bestseller time-lag study. We collected data on recent Australian bestsellers and recorded the date they became available for e-lending in Australia through one aggregator.
This section provides an overview of our methods. We have also supplied interactive dashboards that contain a more detailed description of our methodology and which are publicly available for free use by anyone wishing to download our datasets, replicate our results or engage in further analysis (see https://elendingproject.org).Data collection
The e-lending ecosystem is challenging to research. Aggregators typically impose contractual restrictions on the use of their data, including confidentiality obligations, which make it very difficult to compile comparative pricing and licence information. Those difficulties are exacerbated by the fact that aggregators typically store their data in quite different forms.
We needed permission from five aggregators to collect the necessary data. Some aggregators gave permission readily, while others were hesitant or avoidant. Some viewed this exercise as a waste of their time, while others expressed concerns that the results may potentially harm them in the marketplace. On several occasions we had to request senior library representatives to intervene on the project’s behalf in order to move discussions forward. In our view, there would have been no possibility of collecting this data without that strong backing.
To secure the agreement of all aggregators, we limited our sample size to 546 titles and agreed to report results pseudonymously. We subsequently also agreed to band prices in the public datasets to assuage concerns raised by one aggregator after the data collection had been completed. All in all, it took close to a year of trust building and negotiation before all aggregators had finally agreed to participate. Notably, despite initial reluctance from some, most aggregators had become converts by the interview stage, telling us that the data actually gave them useful new insights about their business.
All availability, price and licence data was collected during the week of 17 July 2017. Each aggregator either provided us with their current availability, pricing and licence terms information for the sampled e-book titles, or gave us permission to access their library-facing software to collect it ourselves. In essence, for each title, we asked the question: if a public library was looking to acquire a given book from the relevant aggregator in that week: was the book available, on what terms & at what price?
For physical copies, price and availability data were collected from a library supplier at first instance. Where a physical copy could not be obtained from that source, we checked availability on the Australian book selling website Booktopia. Where a book was not available from either of those sources, we recorded it as not available. In all cases the price we listed for physical books was the recommended retail price (RRP) rather than the actual library cost. That is because confidentiality requirements again restrained library partners from sharing the actual prices offered to them by their suppliers. Although the recommended retail price is much higher than the price typically paid by libraries, it can be seen as a good proxy for actual cost once factoring in the additional costs involved in getting a physical book processed, catalogued and on to the shelves & provides at least a general comparison to e-book prices.
The title sample
We were interested in testing the availability of a range of books likely to be of interest to public libraries. However, as discussed above, the need to secure permission from all five aggregators meant that we were highly constrained in the number of titles we could include.
Given that constraint, we consulted with our library partners to come up with a range of proxies for quality and demand that would enable us to target books of likely interest to them. We included more newer books than older (reflecting their greater weighting in library collections), whilst still including substantial backlist and a range of genres and audiences. The preliminary sample included:
- Prize-winners:
- Pulitzer Prize for Fiction winners, 1948-2016.
- Man Booker Prize winners, 1969-2016.
- National Biography Award winners (Australia), 1996-2016.
- Inky Award winners (Australian Young Adult), 2010-2016.
- Hugo Award for Best Novel winners (Science-fiction/fantasy), 1951-2016.
- Indie Book of the Year winners (Fiction), 2010-2016.
- Indie Book of the Year winners (Non-fiction), 2010-2016.
- Romantic Book of the Year Award winners (‘Ruby’ award for long romance), 2010-2016.
- Children’s Book Council of Australia Notables (Older readers), 2017.
- Prime Minister’s Literary Award winners (in Fiction, Poetry, Non-fiction, Australian history, Young Adult fiction and Children’s fiction), 2008-2016.
- Miles Franklin literary prize-winners, 1957-2015.
- David Unaipon Award for an Unpublished Indigenous Writer (Australia - all subsequently published), 1989-2013.
- Bestsellers:
- Amazon’s Top 15 Bestselling Books yearly (overall - not country specific), 2010-2016.
- Amazon’s Top 15 Bestselling Kindle Books yearly (overall - not country specific), between 2010-2016.
- Amazon’s Top 15 Bestselling Kindle Books (overall - not country specific) (as of 10 July 2017).
- The books most held in Australian public libraries 1974/1975-2015/2016 (top 50).
- Current Better Reading Top 10 Weekly Bestselling Fiction (as of 10 July 2017).
- Current Better Reading Top 10 Weekly Bestselling Non-Fiction (as of 10 July 2017).
From these books, we then excluded duplicates, titles that were inappropriate for e-collections (such as colouring books) and books in languages other than English. The final sample comprised 546 titles, the full list of which can be downloaded from elendingproject.org. This sampling methodology was not intended to be representative of all books, or even all books held in even Australian public libraries, but to capture a good cross-section of books of interest to Australian public libraries, within our aggregator-imposed constraints.
Comparing prices and publishers
Libraries typically pay both platform fees (to access the aggregator’s platform) and additional prices for individual titles. In our data, prices are for titles only and do not include additional stand-alone platform or hosting fees but may nonetheless include some margin that goes to aggregators.
Our data also includes publishers, in order to detect patterns in how different publishers and publisher types manage e-lending. We identified e-book publishers for each title by using data drawn from a single aggregator for all of the sampled titles they had available and checking it against data on Amazon for each country. We then grouped publishers and imprints with their parent companies to help illuminate broader differences in licensing and pricing strategies.
The bestseller time-lag study
Bestsellers make up a considerable proportion of library borrowings & libraries can purchase physical copies immediately upon publication. Our bestseller time-lag study sought to assess whether there are significant time-lags between publication and availability at the time of data collection. We obtained a dataset of Australia’s top bestselling fiction titles from 2014, 2015 & 2016 from Nielsen BookScan, including their publication date, which we verified via Goodreads. In order to focus on recent bestsellers, we eliminated books that had been originally published more than two years before appearing on our bestseller list. To measure how long it took after for each publication to become available for e-lending, we used Street Date data from OverDrive (OverDrive, 2017).
Qualitative data
We supplemented the quantitative data with semi-structured interviews with representatives from every aggregator whose data were included in the three distinct studies. We also conducted discussions with library partners to understand the likely impacts of the pricing and licensing practices we discovered.
Findings
Availability
How available were e-books to Australian libraries?
Of our 546 sampled titles, 76% (n = 413) was available from at least one e-lending platform & 51% (n = 280) was available from all five platforms. The highest proportion of titles reported available from any single aggregator was 67% (n = 388), the lowest 59% (n = 339) & the median 63% (n = 360). In the bestseller time-lag study’s separate sample of 109 books, 74% (n = 81) was available for e-lending from OverDrive. Overall, availability was considerably greater than we had expected based on discussions with library communities during the study’s design.
If a book is not available for e-lending on an aggregator, there are two possible explanations: either the aggregator is actively engaged in curation and decided not to acquire the book, or the publisher had not made the book available to the aggregator. In interviews, four of the five aggregators confirmed they do not engage in curation; instead, they make available all e-books supplied by their partnering publishers. One aggregator did cull titles they considered unmarketable. However, as our sample was made up of bestselling and culturally significant award-winning titles, we consider it unlikely that this process had any adverse impact on reported availability.
How available were e-books in Australia compared to physical books?
While availability was better than anticipated, digital availability was still considerably lower than physical. We found 94% (n = 512) of the sampled titles was available for purchase in Australia in physical form. However, we also found that, of the 6% (n = 34) of titles not available physically, 59% (n = 20) was available digitally from at least one platform & 41% (n = 14) were available from all platforms. This suggests that e-books in libraries are already playing an important role in continued cultural availability.
What was the relationship between availability and age?
We wanted to understand the relationship between availability and age. To do this, we examined availability for all books across all platforms. Since there were 546 titles and five platforms, that gave us 2,730 data points (i.e., opportunities for a title to be present or absent). We discretised the years into twenty bins using equal frequency. The sample is weighted in favour of newer titles (which make up a significantly higher proportion of public library collections), with a median publication date of 2009 and range between 1924 and 2017. After discretisation, the years 2007–2017 have their own bins (reflecting their higher occurrence in our sample compared to older works.
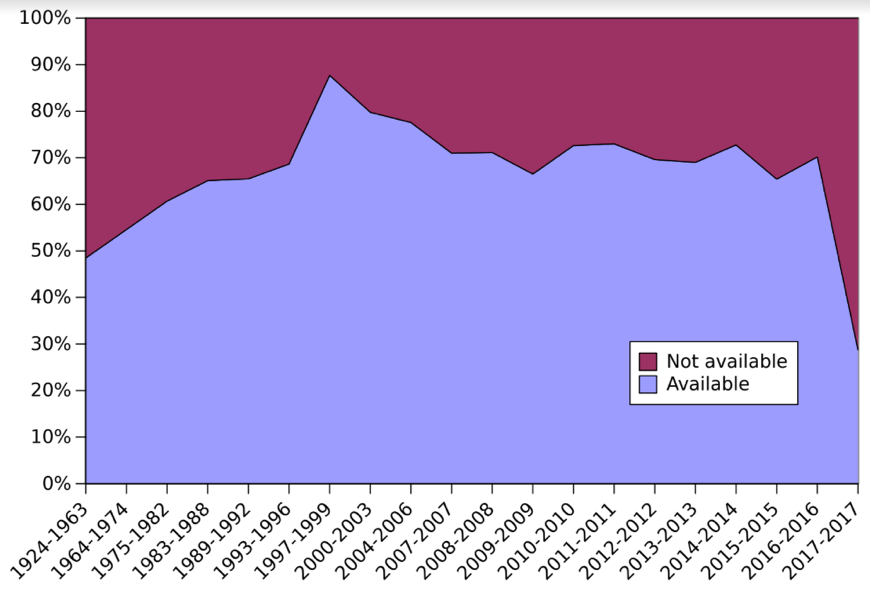
Figure 1: Availability of books by year
As shown in Figure 1, we found that the very oldest titles were available at higher rates than the newest. Peak availability was for titles published around 2000, well into the backlist. Interestingly, even titles published in the late 1980s and 1990s were widely available (at rates above 65%), showing that publishers are acting to capture value from their backlists. As explored further in the pricing and licensing analyses below however, they are doing so in ways that may deter uptake. Two competing forces likely explain the relatively lower availability of the oldest and newest books: reluctance to cannibalise retail sales of the newest titles & the higher costs associated with the oldest, which are not natively digital and may not have originally been licensed for digital distribution.
How did Australian e-book availability vary by publisher?
We found significant variations in availability across publishers: 55% (n = 302) of our sampled titles were published by the big five publishers & 33% (n = 180) were published by other publishers. We were unable to confidently identify an Australian e-book publisher for the remaining 12% (n = 64) at the time of collection and marked them unknown.
Of the big five titles, 85% (n = 256) were available on at least one platform. 68% (n = 206) were available everywhere. big five availability was significantly skewed downwards by Hachette, whose fifty sampled titles were reported as being available on at least one platform in just 8% of cases & never on all platforms. Notably also, 93% of the unavailable books in our bestseller time-lag study (26 of 28 titles) was published by Hachette. When Hachette was excluded, the remaining 253 big five titles were very widely available: 81% (n = 206) of them everywhere & 97% (n = 246) through at least one platform. The five platforms reported similar availability of these titles, ranging from a low of 87% (n = 220) to a high of 95% (n = 241), only marginally less than physical availability (96%, or n = 244). These results suggest that, Hachette aside, the biggest publishers have a strong interest in ensuring widespread library availability of their e-books. It also suggests that they prefer to promote competition between aggregators by making books widely available on many platforms, rather than entering into the kind of exclusive arrangements that are being commonly used by, for example, TV and film streaming platforms.
Most titles, 88% (158 of 180), from other publishers were available on at least one platform. However, just 41% (74) was available on every platform. Aggregators suggested that this may be because the resources required to provide titles in formats consistent with individual aggregator requirements impose a higher burden on smaller companies than larger ones. Leading Australian independent publisher Text Publishing, for example, had distribution agreements with just three platforms, though it made 100% of its twenty-one sampled titles available in each. One platform reported unsuccessful years-long efforts to court Text: ‘They’ve just said they can’t take another vendor on board right now, they’re too busy’. This is supported by the much wider rates of universal availability for the biggest publishers. If that explanation is correct, it suggests that newer entrants to the aggregation market may be at a disadvantage to established players.
How long did it take for ‘bestsellers’ to become available for e-lending in Australia?
We were interested in measuring how quickly bestsellers became available for e-lending, given historical concerns about cannibalising sales (Thompson, 2005). However, we found that most books became available quickly. Of the eighty-one books in the bestseller time-lag sample available through OverDrive, 49% (n = 40) became available on their exact publication date. Twenty-five per cent (n = 20) was available after publication: sixteen of them within ten days & the remaining four between eleven to sixteen days after the print book was published. Interestingly, 26% (n = 21) of titles were available before their official publication date, with the earliest sampled title available for e-lending three months before its official publication date.
This suggests that delays for bestsellers were not a problem at the time of data collection. However we note that, since then, the Macmillan imprint Tor has introduced a policy of mandatory four month delays for all titles (Blackwell, 2018).
How did availability compare across jurisdictions?
Copyright is territorial, which means works might be controlled by different publishers or made available on different terms across countries. The internationally-focused study sought to understand how availability of the sampled titles differed across jurisdictions. We found similar rates in the top four countries. The US led with 71% (390 of 546) of titles available, followed by New Zealand (71%, 387), Canada (70%, 384) and Australia (70%, 381). Australia’s fourth place is notable given that, as described in Constructing the sample above, the sample was skewed towards Australian books and readers. However, it still performed considerably better than the UK, which trailed with just 59% (n = 324 titles). The poor availability outcomes in UK libraries may be tied to their current extreme funding pressures, with some 25% of British public libraries closed or handed over to volunteers since 2012 (Onwuemezi, 2017). The aggregator from which the international data was sourced also noted that it has found UK publishers to be more risk-averse than their counterparts elsewhere, which might further explain an unwillingness to make books available for e-lending.
Our international comparison also found that big five publisher Hachette was much more willing to license titles in North American markets than elsewhere. In the US, our data records Hachette as publisher of 23 titles, of which 91% (n = 21) were available. In Canada, Hachette published twenty-four titles, of which 88% (n = 21) were available. In Australia and the UK however, just 4% (2 of 49) & 3% (2 of 65) of Hachette titles were available respectively. The aggregator explained Hachette’s UK office ‘largely controlled’ the rights for all Commonwealth countries & predicted a ‘similar lack of access across all of the markets that would be controlled out of that office'.
Licence terms
Are the same books available to all aggregators on the same licence terms?
The books in our study were made available for e-lending on three different types of licence. We use one copy, one user (OC/OU) to describe licences that permit titles to be lent in perpetuity, to one borrower at a time, for as long as the library subscribes to a platform (or, in the case of ported licences, a platform’s successor). Additionally, there were also two varieties of metered-access licence. These licences are also limited to borrowing by one reader at a time, but instead of being perpetual, are also limited in other ways. A common form of metering is by number of loans (usually twenty-six), after which the title expires and is no longer available to the library’s card-holders. The other main form is where a licence has a time limit either in place of, or additional to, a number of loans, e.g., twelve months, or thirty-six loans or two years (whichever comes first). Some publishers and aggregators are now experimenting with simultaneous use and per loan licences. Each of these would permit multiple borrowers at once, but none of the books in our sample was offered under one of these licences. For six of the titles in the Australia-focused study & fifteen of the titles in the internationally-focused study, multiple licence options were reported. In these cases we chose a single best licence for inclusion by comparing the price per loan for the available options.
Since the Australia-focused study covered all e-book aggregators operating in a single jurisdiction, it enabled us to test whether the same books were available to aggregators on the same terms. 41% (223 of 546) of sampled titles featured different lending models across different platforms. We categorised many of these as minor differences (for example where a licence was limited only by time on one platform (e.g., twenty-four months) and by time and loans on others (e.g., twenty-four months or thirty-six loans, whichever comes first): this is a minor difference because it would be difficult for a library to circulate an e-book more than thirty-six times in two years in any event). Ultimately, we found 22% (26 of 119) of titles had major licence differences: e.g., offered with a one copy, one user licence by at least one aggregator & with metered access by at least one other.
The number of major differences surprised aggregators. As one put it: 'my experience of working with e-publishers has been that they've been particularly rigid across all areas working with them. I didn't expect there to be that much flexibility between terms’. Another said, ‘From our dealings with publishers... they're very clear that they want everyone on an even playing field so that from a content purchasing perspective, it's even competition and that libraries are choosing vendor and platform'.
Aggregators also universally reported most publishers being willing to allow licences to be ported from one platform to another on the same terms, suggesting no intention to deliberately discriminate between them.
The most likely explanation for the differences we identified is that, even if publishers intend to make books available to all aggregators on the same terms, they often fail to pass on licence changes in a timely fashion. One aggregator explained that they regularly approach publishers about differences across platforms:
The overwhelming majority of the time, when we go back to the publishers and say, hey, we've been alerted that our pricing appears to be different, is it accurate – they'll go, oh, we changed our pricing insert timeframe here, right before we did the deal with person Y. And we just never sent it to everyone else. That has happened a ridiculous number of times.
We documented an example of this after one aggregator queried the accuracy of our draft results. They wrote: '[Publisher] used to make their content available under the OC/OU [one copy, one user] model & in July 2013 moved to a Metered Access model. Our understanding is that this change was universal across all platforms however it is not reflected in your information'.
When our data were collected in July 2017, four of the five aggregators reported offering that publisher’s titles on a metered access basis, while the fifth offered them on a one copy, one user licence. For that fifth platform, we unearthed a marketing communication advising libraries that those titles were transitioning from one copy, one user to metered access as of 1 March 2018, almost five years after the querying aggregator reported having been required to make the change. This confirms that the significant differences in terms (and prices) are at least partly attributable to publishers failing to provide identical terms to aggregators, despite intending to do so.
How do licences vary across territories?
The internationally-focused study enabled us to identify licence differences across territories. We found that licences were sometimes different for 37% (201 of 546) titles. As shown in Figure 2, where there was a difference of licence, Australia, New Zealand and the UK each had a far greater proportion of metered access than one copy, one user licences, while the inverse was true for Canada and the US. We also saw different distributions of the type of metered access. Notably, the North American countries had a relatively greater proportion of licences restricted by loans but with no time limit.
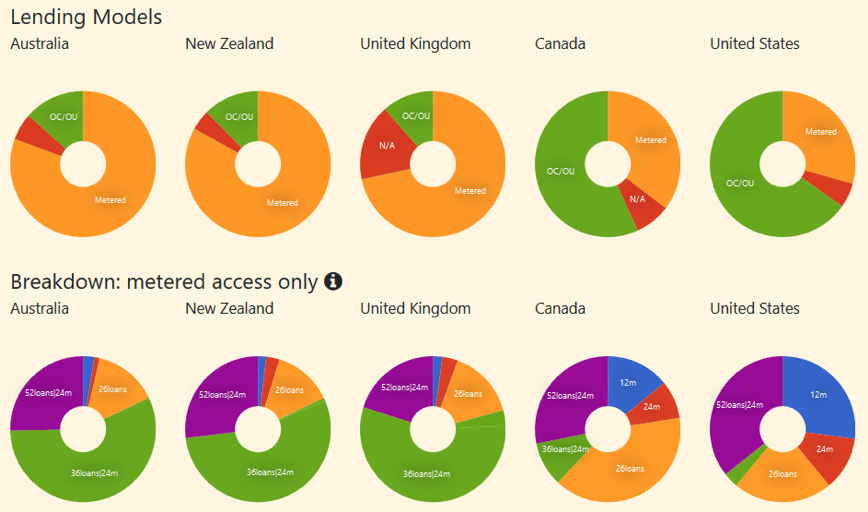
Figure 2: International licensing differences
Since the data for this study came from a single aggregator (which uses the same software across all jurisdictions), these differences are unlikely to be explained by failures to simultaneously roll out updated licence terms, or by design idiosyncrasies across aggregators’ systems. Instead, they are most likely attributable to works being deliberately made available with different terms in different jurisdictions. That may occur in instances where different publishers control rights in different jurisdictions, or where they have the same parent company but different policies for different countries (as we described in the case of Hachette).
What is the relationship between the age of the book and licence type?
In order to understand the relationship between titles’ age and licence type, we used the same discretisation method as for analysing the relationship between availability and age above (Figure 1), again creating twenty bins with equal frequency. This time there were 1,811 available title and platform pairings, since we were examining only books that were available and thus have a licence, meaning that on average each bin contains ninety-one pairings in Australia). The results, plotted in Figure 3, show a marked decrease in one copy, one user licences for the newest books. Interestingly, it also shows that backlist titles, including the oldest books in the sample, are being predominantly made available on time-limited licences. Internationally (Figure 4) we see a considerably greater proportion of titles made available on perpetual one copy, one user licences. However, we again see that the very oldest books are made available on time-limited licences at similar rates to the very newest.
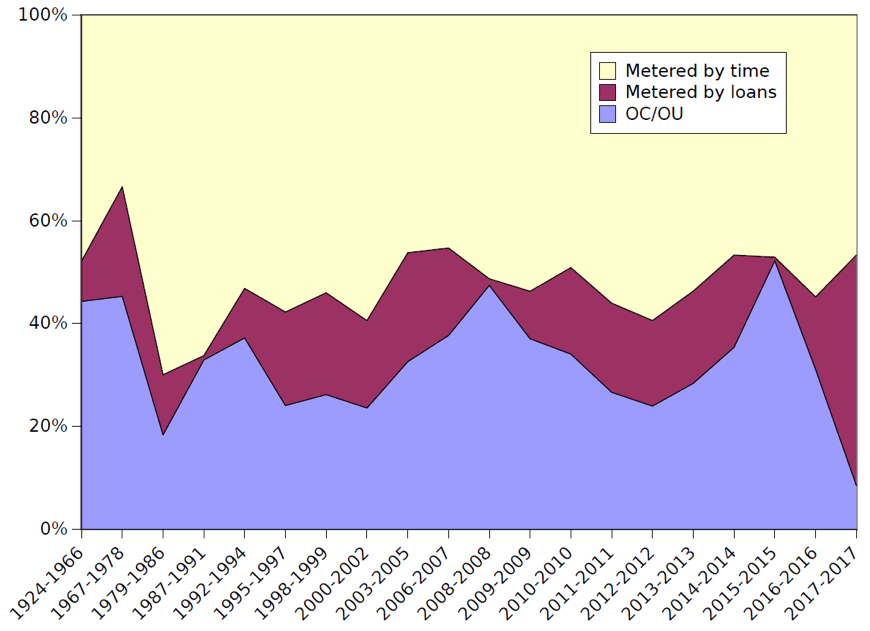
Figure 3: Relationship between age and licence type - Australia
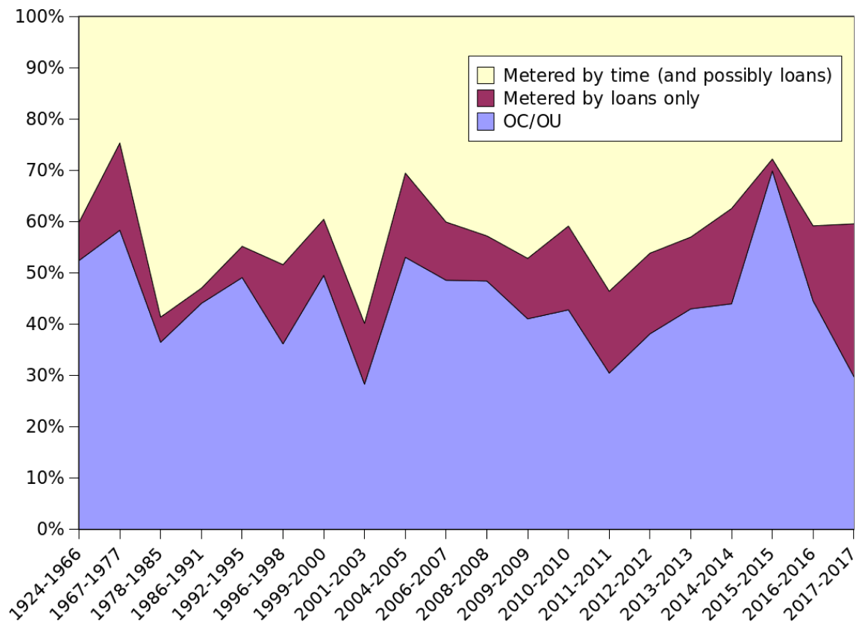
Figure 4: Relationship between age and licence type - international
How do licences vary by publisher type?
Our data show that the big five publishers use metered access models in the vast majority of cases in Australia, New Zealand and the UK, but utilise one copy, one user licences to a much greater degree in the US and Canada. By contrast, Other publishers make their titles available on very similar terms in all five jurisdictions, predominantly via one copy, one user licences (see Figure 5). Since collecting these data, Penguin Random House has switched all of its titles to time-limited licences (Albanese, 2018).
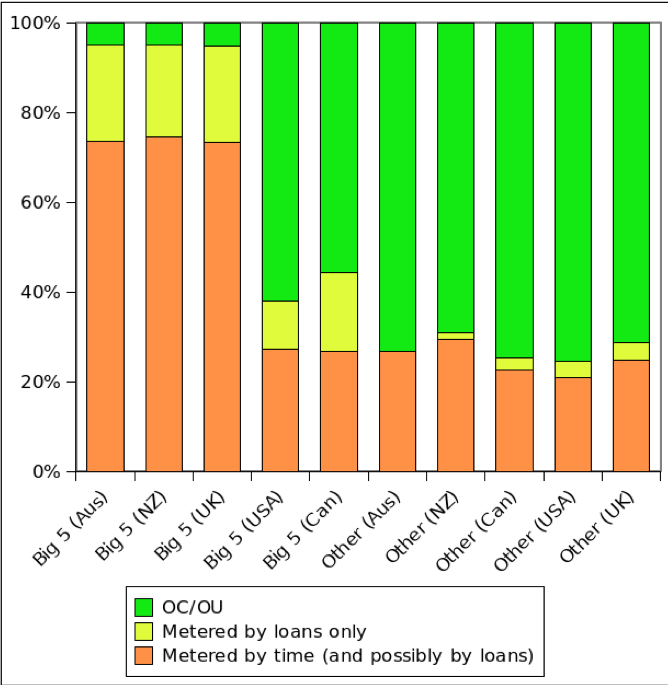
Figure 5: Licences by publisher type
Pricing
Price differences across platforms and jurisdictions
To determine whether and how book prices varied between platforms and jurisdictions, we isolated the cases involving identical licences & then calculated the mean price for each of these titles on a) every platform and b) every jurisdiction in which it was available.
Each title was available in n (out of 5) platforms.
We first calculated the mean price p = 1/n Σni=1 pi for that title, where pi represents the price of the title for platform i. We were interested in finding, among the n prices, the price pfurthest, which is then the furthest away from the mean:
pfurthest= arg (max) |pi - p|
pi,1≤i≤n
We then normalised this by the mean, to obtain an amount of ‘furthest variation’ relative to the mean price. Thus, a $2 maximum difference to the mean has more significance where the mean price of the book is $5 than where it is $100 (all dollar amounts in the paper are Australian dollars). We call this quantity furthest variation (fv):
fv=pfurthest / p
We can illustrate the formula with reference to the example title Finding Gobi, by Dion Leonard. This book is available across all Australian platforms with an identical licence in each (metered access; 26 loans). The prices from the five aggregators are as follows: $17.99, $9.09, $17.99, $18.67 and $9.08. This gives a mean price of $14.56. The price that is the furthest away from the mean price is $9.08, i.e., a difference of $5.48. The furthest variation is thus 5.48/14.56 ≈ 0.376, or 37.6%. We used this method because we only had a maximum of five values for any one title (i.e., one price from each of up to five aggregators), making standard deviation an unsatisfactory method for describing the variation.
We found substantial price differences across platforms for the same titles offered with identical licences in Australia. In the 173 cases with always-identical licences, there were price differences ≥10% 94% of the time (n = 163), ≥20% 41% of the time (n = 70) & ≥30% 26% of the time (n = 45). A further 7% (n = 12) had a difference ≥ 50%. One example was Edward P Jones’s The known world. Published in Australia by HarperCollins, it was available from all five platforms on identical twenty-six-loan licences for as little as $12.72 and as much as $53.22.
We identified a number of possible explanations for these variations. Prices are affected by structural differences across platforms (particularly whether title prices include any component of the platform fee), other confidential factors (including aggregators’ margins with publishers) & seasonal differences (such as temporary sales or publishers rolling out new pricing to different aggregators at different times). The commercial-in-confidence nature of some of these factors makes it impossible to equalise prices in a way that could enable meaningful cross-platform comparison. Our inability to do so highlights how difficult it is for libraries to make purchasing decisions (and for aggregators to compete) on price. Since they have little power to monitor title-level prices, some libraries are forming consortia to enable better bargaining with aggregators on platform fees, which are much more transparent and set by aggregators rather than publishers.
Interestingly, we found the price differences to be considerably lower in the international data than the domestic, despite the noise introduced by the necessary currency conversions and potential for different owners. In the international dataset, 253 books of the 546 are always available on the same licence. Of those, 61% (155) had a price difference of <1% & 84% (213) a price difference of <20%.
Comparing physical prices to one copy, one user (OC/OU)
We wanted to test whether one copy, one user licence prices were higher than those for physical copies & if so, determine the extent of any difference. We limited comparison with physical book prices to titles that were available on a one copy, one user licence, being most directly comparable to physical copies. Figure 6 examines the pairings of one copy, one user licences per title per platform & compares them to the physical price. Titles not available on one copy, one user licences were not plotted; titles not available physically but available one copy, one user licences were denoted by setting the physical price to $99. To improve readability three data points were not plotted: those titles were available at $35.50:$100.95; $29.95:$102.95; and $157.50:$23.95 (physical: one copy, one user).
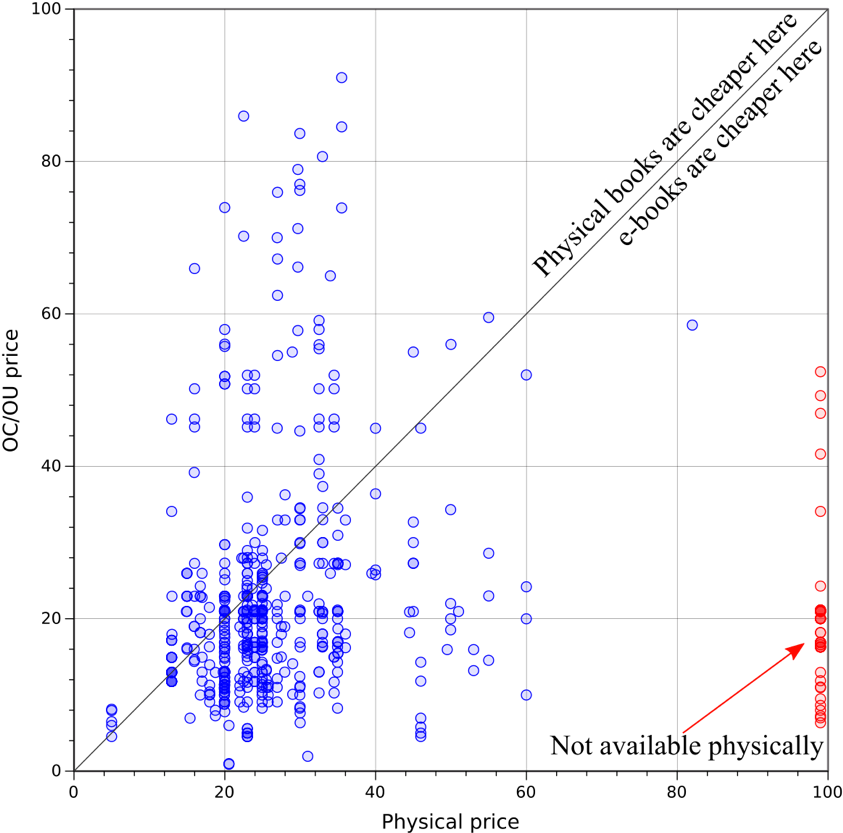
Figure 6: Comparing physical prices to one copy, one user (OC/OU) licence prices
Contrary to expectations, this showed the sampled titles were more often cheaper via one copy, one user licences than physically. This may be attractive to libraries seeking to fulfil archiving missions for titles that hold cultural value without necessarily having a high circulation: although the holding of such titles may influence ongoing platform fees, they do not attract the ongoing costs of physical copies (processing loans and returns, re-shelving, repairs, wear and tear) & don’t take up increasingly valuable shelf space.
Metered access prices
Across the five platforms and 546 titles, we had 1,230 metered licences. In calculating their per circulation costs we assumed that titles on time-based licences could be circulated twenty-six times a year (i.e., circulating once every two weeks, a conservative assumption that makes the estimation as cheap as possible). The results are depicted in the box plot at Figure 7. In that chart, the horizontal line shows the median & the lower and upper extremities of the rectangle give respectively the lower and upper quartiles (i.e., 50% of the data are contained within the rectangle box). Points considered outliers (greater than the upper quartile plus 1.5x the interquartile range) are drawn separately. For our data, there were no outliers in the lower range, so the whisker represents the minimum value. For the upper range there were always outliers and so the whisker is positioned at the upper quartile plus 1.5x the interquartile range.
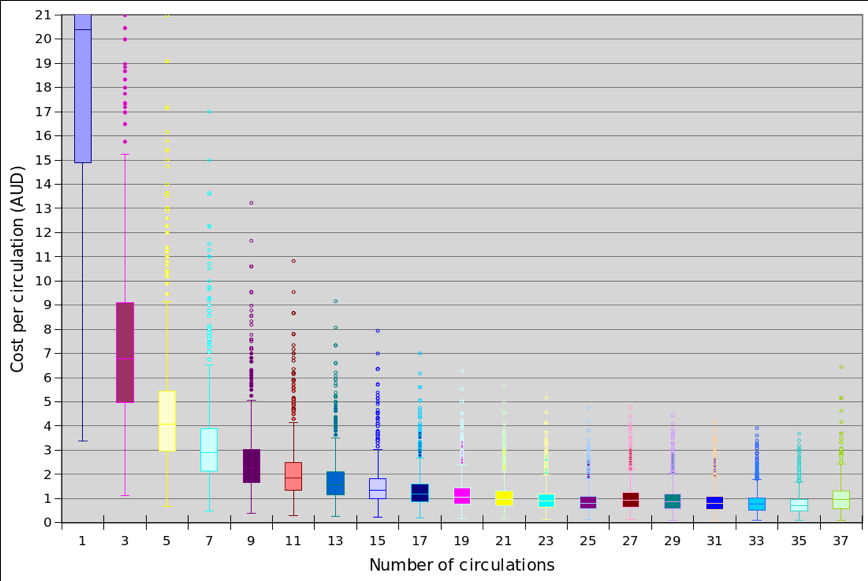
Figure 7: Cost per circulation (in Australian dollars) for metered licences.
As expected, the cost per circulation generally decreases as circulations increase, though there are slight increases at 27 and 37 circulations (reflecting the cost of additional licences needing to be purchased when twenty-six- and thirty-six-loan licences are exhausted). At five circulations the median per circulation cost is $4.08; about 75% of titles are below $5.50/circulation and about 99% of titles are below $9/circulation. At fifteen circulations the median is $1.36; about 75% of titles are below $2/circulation & 99% of titles are under $3/circulation. From twenty-one circulations, the median price per circulation is under $1 ($0.97) even if subsequent licences have to be purchased. By the thirty-sixth circulation, the median cost per circulation falls to $0.69; 75% of titles are under $1 & 99% are under $1.70.
This shows how widely per circulation costs can fluctuate depending on uptake. This is less concerning for loan-limited licences (which remain in collections until all checkouts have been exhausted) than for time-limited licences (which may expire and be deleted from collections even if nobody has borrowed them at all).
Discussion and conclusion
These first results in our investigation of the e-lending ecosystem contain mixed news. Availability was much better than anticipated, including for older books and books no longer readily available in physical form. Aside from Hachette, all ‘big five’ publishers seemed to be participating at high rates. For newer books, digital library availability approached physical levels & even bestsellers were quickly made available. That is a remarkable shift from the reluctance and anxiety publishers demonstrated about licensing their titles to libraries in the mid to late 1990s (Thompson, 2005, p. 370).
However, our analysis of licence terms suggests that, while books are widely available to libraries for e-lending, they not necessarily accessible. Of particular concern was the use of exploding or time-limited licences, which for the sampled titles were used particularly widely by big five publishers in Australia, the UK and New Zealand. As previously noted, Penguin Random House has now switched all of its titles, globally, to exploding licences (Albanese, 2018). Such licences may be less problematic when attached to books of known demand, such as new releases from established authors, or those with existing patron reservations. For titles anticipated to have lower demand however, such as culturally-depreciated, older books, such licences may significantly disincentivise libraries from including them in collections. This could contribute to a vicious cycle: library e-lending still has low take-up rates, which are partly attributable to a lack of quality content (Harvey, 2013), but libraries cannot rationalise too many purchases on time-limited licences given a limited readership. That is, the licensing model may be acting as a disincentive to adding books to collections at the same time libraries need to be growing them to build adoption. This disincentive would be stronger for smaller libraries than large consortia: for example, the purchase of a time-limited licence would be much less risky if made available to service in all readers in a city or region, rather than within a single council or county area.
Also of potential concern is the lack of flexibility found in licence offerings. Multiple licence options were reported for just six of the 546 titles in the Australia-focused study (1.1%) & fifteen for the international (2.74%). Again, this fits poorly with demand from libraries: a recent independent library-led survey (eliciting 209 responses from mostly public librarians) found that 94% would prefer to be able to choose from a range of licence options at different price points (Blackwell, 2017).
Future work
We did not always have enough data in these focused studies to make statistically significant findings. For example, the sample size of the internationally-focused study contained too few titles with identical licences to perform an unbiased comparison across countries. Next, we will be testing the questions it raises on a much larger dataset of almost 100,000 books and 370,000 distinct licences across five jurisdictions. This will include analysis of the interrelationships between price, licence and age of titles, something that was not feasible with these datasets. It will also include examination of relative price across jurisdictions. We will then survey librarians about how the e-lending practices we have identified affect their licensing decisions & test our hypothesis that high rates of time-limited licences (and the prices at which they are offered) deter libraries from adding titles of uncertain demand to their collections. We will explore the extent to which structures like consortia reduce the impact of restrictive licences (by spreading the risk over a greater number of potential readers).
Combined with the investigations reported here, this work will inform our team’s broader legal and policy analysis, including analysis of how authors get paid for library loans of their e-books and how Public Lending Rights designed for the physical paradigm might be extended to digital books. Ultimately we will make recommendations about whether e-lending ought to be left entirely to the market, as it is now, or whether there is a case for some regulatory intervention in order to help authors receive a fair share & to assist libraries to fulfil their public interest missions.
Acknowledgements
This research was partially funded by the Australian Research Council via projects LP160100387, FT170100011 and DE170100037. It also benefited from cash and in-kind contributions from research partners: National and State Libraries Australia, the state libraries of Western Australia, South Australia and New South Wales, the Australian Library and Information Association, Yarra Plenty Regional Library, Gold Coast Libraries, Brisbane City Council Libraries, Auckland Council Libraries, Vancouver Public Library, St Mary’s County Library and Hampshire Library Service.
Some of these results were presented at the Asia-Pacific Library and Information Conference 2018 and the IFLA World Library and Information Congress 2018; our thanks to participants and attendees for helpful comments and feedback. Thanks also to the project’s partners and members of its management committee who have provided data, advice and feedback on an ongoing basis since this project was first conceived in 2014. We are grateful also to the anonymous Information Research reviewers for their insightful comments and advice.
About the authors
Rebecca Giblin is an Australian Research Council Future Fellow and Associate Professor in Monash University’s Faculty of Law. Her primary research interests centre upon copyright, technology regulation & the regulation of culture (particularly how the law impacts the creation and dissemination of creative works). She can be contacted at rebecca.giblin@monash.edu.
Jenny Kennedy is a Postdoctoral Research Fellow at RMIT, Melbourne. Jenny's research interests cover media practices in everyday life, social discourses around technology use & material culture, especially in domestic contexts. She can be contacted at jenny.kennedy@rmit.edu.au.
Kimberlee Weatherall is a Professor of Law at the University of Sydney Law School, teaching and researching across intellectual property law and the intellectual property-technology nexus. Kimberlee has published extensively in leading Australian and international journals on issues ranging from digital copyright & bilateral and multilateral trade agreements and intellectual property, to the conception of the consumer in trade mark law. She can be contacted at kimberlee.weatherall@sydney.edu.au.
Daniel Ian Gilbert is a PhD candidate in Law at Monash University. His research explores the role of the Public Lending Right in supporting Australian literary culture. He can be contacted at daniel.gilbert@monash.edu.au.
Julian Thomas is a Professor of Media and Communication at RMIT. He is a researcher in digital media and the internet, including media, communications and information policy and the history of communications technologies. Julian’s recent work includes the Australian Digital Inclusion Index (2016-2018), Internet on the Outstation (Institute of Network Cultures, 2016) & The Informal Media Economy (Polity, 2015). He can be contacted at julian.thomas@rmit.edu.au.
François Petitjean is a Senior Research Fellow in Machine Learning at Monash University. His research interests include the modelling of high-dimensional data, time series analysis, statistical testing and their applications to environmental and social studies. He can be contacted at francois.petitjean@monash.edu.
References
- Aabø, S. & Audunson, R. (2012). Use of library space and the library as place. Library & Information Science Research, 34(2), 136–149.
- Albanese, A. (2018, September 4). Penguin Random House changes library e-book lending terms. Publishers Weekly. Retrieved from https://www.publishersweekly.com/pw/by-topic/industry-news/libraries/article/77904-penguin-random-house-changes-its-library-e-book-terms.html (Archived by WebCite® at http://www.webcitation.org/78axT3a6S).
- Ashcroft, L. (2011). Ebooks in libraries: an overview of the current situation. Library Management, 32(6/7), 398–407.
- Bergström, A., Höglund, L., Maceviciute, E., Nilsson, S.K., Wallin, B. & Wilson, T.D. (2017). Books on screens: players in the Swedish e-book market. Gothenburg, Sweden: Nordicom. Retrieved from
- Blackwell, M. (2017). Results of ReadersFirst e-content business models survey. ReadersFirst. Retrieved from http://www.readersfirst.org/news/2017/11/29/results-of-readersfirst-e-content-business-models-survey-2 (Archived by WebCite® at http://www.webcitation.org/72gm14oEk).
- Blackwell, M. (2018, July 6). A giant leap – backwards. ReadersFirst. Retrieved from http://www.readersfirst.org/news/2018/7/6/a-giant-leap-backwards (Archived by WebCite® at http://www.webcitation.org/72glw1CHn)
- Book Industry Collaborative Council (2013). Final report 2013. Ultimo, NSW, Australia: Australian Publishers Association. Retrieved from http://www.publishers.asn.au/documents/item/157BICC. (Archived by WebCite® at http://www.webcitation.org/78az7R4nJ)
- Genco, B. (2009). It’s been geometric! Documenting the growth and acceptance of ebooks in America’s urban public libraries. The Hague, Netherlands: IFLA. Retrieved from http://citeseerx.ist.psu.edu/viewdoc/download?doi=10.1.1.150.7443&rep=rep1&type=pdf (Archived by WebCite® at http://www.webcitation.org/78azByvQc)
- Giblin, R. & Weatherall, K. (2015). At the intersection of public service and the market: libraries and the future of lending. Australian Intellectual Property Journal, 26(4), 4-26. Retrieved from: http://ssrn.com/abstract=2647705 (Archived by WebCite® at http://www.webcitation.org/78axpupHh)
- Girard, A. (2014). Reader's block: a systematic review of barriers to adoption, access and use in e-book user studies. Information Research, 19(2), paper 624. Retrieved from http://InformationR.net/ir/19-2/paper624.html (Archived by WebCite® at http://www.webcitation.org/78axjXPKf)
- Harvey, S. (2013). E-books and e-lending think tank. The public library story. [PowerPoint slides]. Retrieved from https://bit.ly/2ZqNVq8 (Archived by the Internet Archive at https://bit.ly/2PevCoE).
- McKnight, C. & Dearnley, J. (2003). Electronic book use in a public library. Journal of Librarianship and Information Science, 35(4) 235-242.
- Martindale, G., Willett, P. & Jones, R. (2015). Use and perceptions of e-books in Derbyshire libraries. Library Review, 64(1/2), 2–20.
- Milliot, J. (2018, April 25). E-book sales fell 10% in 2017. Publishers Weekly. Retrieved from https://www.publishersweekly.com/pw/by-topic/digital/content-and-e-books/article/76706-e-book-sales-fell-10-in-2017.html (Archived by WebCite® at http://www.webcitation.org/78b0ScBLJ)
- Onwuemezi, N. (2017). Latest CIPFA figures reveal 'catastrophic' scale of library closures. The Bookseller. Retrieved from https://www.thebookseller.com/news/cipfa-library-figures-687596 (Archived by WebCite® at http://www.webcitation.org/72glhBgqn)
- OverDrive. (2009). OverDrive announces 2008 library download statistics and milestones. Cleveland, OH: OverDrive. Retrieved from https://company.overdrive.com/2009/01/06/overdrive-announces-2008-library-download-statistics-and-milestones/ (Archived by WebCite® at http://www.webcitation.org/76VmDiC0r).
- OverDrive. (2017). Why does the "on-sale date" for a title not match the "street date"? Cleveland, OH: OverDrive. Retrieved from https://help.marketplace.overdrive.com/customer/en/portal/articles/2669828-why-does-the-on-sale-date-for-a-title-not-match-the-street-date-?b_id=15212 (Archived by WebCite® at http://www.webcitation.org/76VmeT9Zm).
- OverDrive. (2019). Public libraries achieve record-breaking ebook and audiobook usage in 2018. Cleveland, OH: OverDrive. Retrieved from https://company.overdrive.com/2019/01/08/public-libraries-achieve-record-breaking-ebook-and-audiobook-usage-in-2018/ (Archived by WebCite® at http://www.webcitation.org/76VmVEM5l).
- OverDrive. (n.d.). Public libraries FAQ. Cleveland, OH: OverDrive. Retrieved from https://company.overdrive.com/libraries/public-libraries/faqs/ (Archived by WebCite® at http://www.webcitation.org/72gkHh8ez)
- Public Library Working Group (2018). Western Australian public libraries: our future background paper. Perth, WA, Australia: State Library of Western Australia. Retrieved from https://slwa.wa.gov.au/sites/default/files/Public_Libraries_Our_Future_Background_Paper.pdf (Archived by WebCite® at http://www.webcitation.org/78b0N5FgV)
- Thompson, J.B. (2005). Books in the digital age: the transformation of academic and higher education publishing in Britain and the United States. Cambridge: Polity Press.
- Twenge, J.M., Martin, G.N. & Spitzberg, B.H. (forthcoming). Trends in U.S. adolescents’ media use, 1976–2016: the rise of digital media, the decline of TV & the (near) demise of print. Psychology of Popular Media Culture. [Advance online publication.]
- Wilson, P. (2017, January 20). Reading is in decline: if not you, then who? Public Libraries Online. Retrieved from http://publiclibrariesonline.org/2017/01/reading-is-in-decline-if-not-you-then-who/ (Archived by WebCite® at http://www.webcitation.org/72gi9NKAn)
- Wilson, T.D. (2014). The e-book phenomenon: a disruptive technology. Information Research, 19(2), paper 612. . Retrieved from http://www.informationr.net/ir/19-2/paper612.html (Archived by WebCite® at http://www.webcitation.org/78ay4wwx2)
- Wilson, T.D. & Maceviciute, E. (2016). Publishers' responses to the e-book phenomenon: survey results from three 'small language' markets. Information Research, 21(4), paper 725. Retrieved from http://www.informationr.net/ir/21-4/paper725.html (Archived by WebCite® at http://www.webcitation.org/78b2ZllkA)
- Yoonmo, S. (2017). The politics of ebooks. International Journal of Media & Cultural Politics, 13(3), 211–228.
- Zhang, M. & Senchyne, J. (2017). Libraries and publisher price Control: the net price system (1901–1914) and contemporary e-book pricing. Libraries: Culture, History & Society, 1(2), 171–193.
- Zickuhr, K., Rainie, L., Purcell, K., Madden, M. & Brenner, J. (2012). Libraries, patrons & e-books. Washington, DC: Pew Internet & American Life Project