What can 100,000 books tell us about the international public library e-lending landscape?
Rebecca Giblin, Jenny Kennedy, Charlotte Pelletier, Julian Thomas, Kimberlee Weatherall, and Francois Petitjean
Introduction. We investigated the relative availability of e-books to libraries for e-lending in five English-language countries & analysed their licence terms and prices.
Method. We created a unique dataset recording author, publisher, price and terms for 100,000 titles and 388,045 e-lending licences across Australia, New Zealand, Canada, the United States and United Kingdom through the aggregator Overdrive. We developed new algorithms to estimate the original publication year for each title & to match titles across jurisdictions.
Analysis. We examined the relationships between title price, age, terms, jurisdiction, publisher and publisher type using various statistical analyses and machine learning.
Results. Price and licence differences across countries are largely attributable to the Big 5 publishers. Prices are largely independent of title age (unless the title is in the public domain) or the rights libraries obtain in exchange. Licence terms are not affected by age either, meaning that the most restrictive terms are often applied to older, less demanded books.
Conclusions. By setting terms independent of titles' value to libraries, publishers may discourage libraries from adding older and less-demanded books to their collections. We will test this hypothesis in a follow-up library survey.
Introduction
Public libraries seek to fulfil a range of vital public interest missions: ensuring widespread access to knowledge, promoting literacy and learning, ensuring equity of access & stewarding their communities' cultural and literary heritage (Gorman, 2000). E-books have tremendous potential to help further these goals, including reaching populations that can be disenfranchised from brick-and-mortar libraries: remote and regional users; shift and gig workers; and those with mobility or vision impairments (Sieghart, 2013; Giblin et al., 2019).
But that potential is affected by laws that regulate e-books very differently to their physical equivalents. Libraries have always been able to buy physical books and lend them to readers without requiring publishers' permission. But acquiring and lending e-books involves making copies and transmissions & that cannot be done without the copyright owner's permission. Thus, libraries do need publishers' permission to hold e-books in their collections and lend them (Giblin and Weatherall, 2015).
Some information about how publishers exercise their rights over e-books is publicly known: Macmillan has had a longstanding practice of bundling, i.e., requiring libraries to buy a minimum of 1000 titles in order to access any single one. HarperCollins famously licences many titles for just 26 loans at a time, after which they need to be repurchased (Whitney and Castell, 2017). Penguin Random House recently announced that all of its books, globally, will shift to time-limited licences that will see titles deleted from collections after a period of time or number of loans, whichever comes first (Albanese, 2018). Overall however, remarkably little has been understood about how publishers are exercising their power to control library e-books, how availability, terms and pricing differ across jurisdictions, by publisher type or age of book & how those decisions might impact public libraries' abilities to fulfil their missions.
In this paper, we add to our recent work investigating those issues (Giblin et al., 2019) by analysing relative availability, terms and pricing across five English language jurisdictions using a new dataset of almost 100,000 titles and 388,045 distinct licences. We have developed several innovative new algorithms. One matches records across jurisdictions with high accuracy, enabling large-scale title level comparison for the first time. We use it to examine relative availability of titles across the UK, US, Canada, New Zealand and Australia, as well as licensing and pricing differences across jurisdictions and by publisher type. The second uses GoodReads data to estimate the original publication date for each title. Books depreciate quickly & older books have much lower demand than newer ones (Thompson, 2010). We use this algorithm to help us understand how that reality is reflected in the terms on which publishers made older books available to libraries to license. Finally, we build a machine learning model of price to inform understanding of the relationships between publishers, title age, licensing model and price. Our quantitative results are enriched by semi-structured interviews with representatives of e-book aggregators. Interactive dashboards enable these data to be visually queried, facilitating understanding of the implications for library communities and opening opportunities for additional research. (Giblin et al., 2018).
We address the following research questions:
- How often do libraries have a choice of licence?
- How often are licences different across jurisdictions?
- Does publisher type influence differences in licence terms across jurisdictions?
- How do licence terms relate to original year of publication?
- How do prices compare by jurisdiction?
- How often are there price differences (and how big are they)?
- How does price relate to original year of publication?
- What can machine learning tell us about the main characteristics governing price?
- What is the relative availability of books across the US, Canada, UK, Australia and New Zealand?
- What are the relationships between availability, publisher type and jurisdiction?
Literature review
E-lending is now big business: the leading global provider, Overdrive, reported 185 million e-book loans worldwide in 2018 (Overdrive, 2019). While publishers used to be nervous about licensing their catalogues to libraries (Sieghart, 2013; Thompson, 2005) their anxiety seems to have been assuaged and now most are participating at high levels (Giblin et al., 2019).
Aggregators such as Overdrive play a crucial role in the e-lending ecosystem, negotiating licences with publishers and then delivering titles to libraries through their unique online platforms. Typically, multiple aggregators compete within each jurisdiction. Aggregators charge fees for libraries to access their platforms. Libraries may use more than one aggregator, but with finite budgets for e-lending, platform fees encourage libraries to be selective about which aggregators they engage with. The crucial role of these intermediaries for public libraries has typically escaped analysis of the e-lending ecosystem, with the notable exceptions of Zhang and Senchyne (2017) who identify how aggregators attempt to maximise the power relations of the market & Bergström et al.'s (2017) comprehensive analysis of the e-book market in Sweden, incorporating publishers, book-sellers, aggregators and libraries.
Broadly, research on e-books tends to overlook e-lending (Kumbhar, 2018), the ambivalence of academic research matching the apparent ambivalence of publishers for the e-lending market (Wilson, 2014). Until recently, research investigating the availability and use of e-books in public libraries has largely been survey-based, focused on librarians and readers & investigating questions around take-up and perceived value of e-lending (Alipour-Hafezi and Khedmatgozar, 2016). Ashcroft (2011) draws together findings from surveys of librarians and aggregators to understand how different actors raise awareness of e-book collections. Girard (2014) also draws on existing surveys to explore user barriers to e-lending, while Martindale, Willet and Jones (2015) conducted an original survey of users to understand frequency of e-book lending. None of these studies addresses the issues of availability, licencing or pricing.
More recently, Blackwell (2017) released the results of a survey of librarians on preferred business models across three of the five English-speaking jurisdictions covered in our datasets. The results do not account for jurisdictional difference which is shown to have continuing relevance for the publishing industry. Since at least 1915 there has been a division of the English-language market between the UK and North American spheres. The British Publishers Traditional Market Agreement in 1947 served to govern patterns of international publishing of English-language books for the remainder of the century (Bryant, 1979; Thompson 2010), which in turn have impacted the books available to libraries for lending.
We recently contributed the first detailed quantitative analysis of the books available to libraries for e-lending, their prices and licence terms (Giblin et al., 2019). One of our studies examined this for a set of quality titles across all five e-book aggregators operating within a single jurisdiction, Australia, enabling new understanding of intra-jurisdictional differences. Another gathered the same data, but this time across a single aggregator in each of the five main English-language markets, enabling us to begin to identify differences across regions. We also reported on studies measuring how long after publication bestselling titles become available for e-lending & comparing e-lending availability and pricing to that of physical books at a title level. That work contains important new insights about e-book availability differences by publisher. However, in order to secure participation of all aggregators operating within Australia, we were limited to a small sample size (ultimately 546 titles). That in turn limited our ability to draw statistically significant conclusions about the interrelationships between price, licence type and age of titles across jurisdictions. Such large-scale analysis is important to inform debates about the legal and policy framework: for example, regarding whether e-books should be regulated more like physical books & how authors and copyright owners should be compensated for library uses. Building on our earlier work, this paper now reports results from our study of a much larger dataset of almost 100,000 titles.
Methods
We provide an overview of our methods below, with more detailed explanations in the Appendix, where referenced.
Aggregator data
Our core data are drawn from the leading e-book aggregator, Overdrive, which gave us permission to access its online library marketplace through library partners in five English-language countries: the US, UK, Canada, Australia and New Zealand. We began with an identified list of authors (see Constructing the sample, below) and queried Overdrive's marketplace during the week of 17 July 2017 to ascertain all titles available from those authors. We ultimately captured data for 94,328 titles and 388,045 distinct licences across the five countries. Key data included author, publisher, licence terms and price (in US dollars). See Appendix A for further details.
Unlike previous studies (Giblin et al., 2019) this larger-scale study assesses only relative availability. A title from a sampled author has to appear in at least one jurisdiction in order to be visible at all. That is, if a title by one of our sampled authors is not available from Overdrive in any of the five jurisdictions, it does not show in the data. This means publishers who do not participate in e-lending in any of the sampled jurisdictions are not observed.
Constructing the sample
The e-lending market is still growing & not all e-books have a strong library readership. We were concerned that results from a purely random sample would lack utility if there was no link between them and library demand. Accordingly, we decided to focus on authors whose e-books were demonstrably of interest to library patrons. To identify them, we constructed a database containing complete historical Overdrive checkout data for our partners in Western Australia, South Australia, Tasmania, the Australian Capital Territory, Darwin, Vancouver and Auckland, a total of 7,636,224 loans and 192,786 distinct titles (the checkout database). Using the Australian subset of this database (3,492,568 loans) we identified all authors whose books had collectively been borrowed 100 times or more. That gave us 8,392 authors that formed the basis for collecting our sample. The sample is thus skewed towards established authors whose works are available for Australian libraries to license.
Checkout assumptions
Libraries are predominantly concerned with cost per circulation. A title priced at $30 is a very different value proposition depending on whether it is lent out once or thirty times. We wanted to be able to analyse our data with reference to the number of times titles are actually likely to be lent out in the field. Although there is no such thing as a typical book, we used the complete checkout database (incorporating Australian and international partner data) to develop an average for the typical number of loans. The median number of times the titles in our database were borrowed is thirteen.
Matching records
We limited this study to English-language countries to maximise the chance of titles appearing in more than one jurisdiction and thus to enable large-scale cross-jurisdictional comparison. That comparison required us to first link the records, which we did by developing an algorithm to apply a detailed set of rules that matched title and author across jurisdictions (see Appendix A for details).
Licence types
The books in our study were made available for e-lending on three different types of licence: one copy, one user (OC/OU), metered by loans & metered by time. One copy, one user licences permit titles to be lent in perpetuity, to one borrower at a time, for as long as the library subscribes to a platform (or potentially a platform's successor). The metered access licences are also limited to borrowing by one reader at a time, but instead of being perpetual, are additionally restricted by loans and/or time. Licences metered by loan can be checked out a set number of times (usually twenty-six) after which the title expires and is deleted from the library's collection. Licences metered by time have a fixed duration either in place of, or in addition to, a number of loans, for example twelve months, or thirty-six loans or twenty-four months (i.e., whichever comes first). Some publishers and aggregators are now experimenting with simultaneous use and per loan licences, but none of the books in our sample was offered under those licences. From earlier interviews we know that licence terms and pricing are determined by publishers, not by the aggregators (Giblin et al., 2019).Publisher groupings
Large publishers typically have numerous divisions and imprints (Almossawi, 2019). We grouped imprints with their parent publishers by manually searching around the ownership of each publisher at the time the data was collected. For example, we grouped books published by imprints of Penguin, Random House, Knopf and Crown into Penguin Random House. We also sometimes distinguish between the Big 5 (the world's five dominant publishing houses: Penguin Random House, Macmillan, HarperCollins, Hachette and Simon & Schuster) and all other publishers. These groupings enable us to examine larger-scale differences in licensing and pricing.
Estimating publication years
To explore differences in how publishers make older and newer titles available, we needed to know the original publication year for each title, data that were not available from the aggregator records. In our earlier related work we solved that problem by collecting publication years manually, but that was not feasible for this much larger sample size. Instead, we developed a method to automatically estimate it from publicly available data using the Goodreads Application Programming Interface. The details are set out in Appendix A.
Results
In this part we report results about licensing, pricing and availability of titles across Australia, New Zealand, the United States, Canada and the United Kingdom.
Licensing
We investigated how often libraries have a choice of licence, how often licences differ across jurisdictions, when those differences occur and how licence terms relate to original publication year.
How often do libraries have a choice of licence?
Librarians have expressed a strong preference for multiple licence options for e-book titles, to enable them to select the one that best fits their current reader and budgetary demands (Blackwell, 2017). For example, it may be that a library is motivated to purchase some copies of a popular book at a higher price on a one copy, one user licence to satisfy long-term curation goals & others at a lower price on metered access terms to satisfy temporary short-term demand.
To determine the rates at which multiple licence options were offered, we counted the total number of licences for each title in each jurisdiction in which it was available. In this analysis a title is available with more than one licence if it is available from the same publisher on different terms and/or prices (for example, one copy, one user at one price and time-metered at a different price) &/or available from more than one publisher.
We found that 97% of titles had exactly one licence available in each jurisdiction in which it was available, demonstrating zero choice for these books. 98% of titles had 1.6 licences or fewer & 99% had three licences or fewer. In the final 1%, some outlying titles had a very high number of licences: Sir Arthur Conan Doyle's The Adventures of Sherlock Holmes had the highest, with 837 licences across the five jurisdictions. Of the books with multiple licences, a large majority appeared to be public domain titles meaning they are no longer restricted by copyright and can be freely offered by multiple publishers, which explains the generally higher number of options offered. Note that in the analyses below, we needed to reduce to a single best licence to enable title-level cross-jurisdictional comparison in those 3% of cases there were multiple licence options. In each case we chose the best licence based on price by applying the rules set out in Appendix A.
How often are licence terms different across jurisdictions?
Of the 90,450 titles available in at least two countries, licence terms were identical for 74,922 (82.8%) & different for the remaining 15,528 (17.2%). We classify 15,276 (98.4%) of these differences as major: being one copy, one user in at least one jurisdiction and metered access in another; being metered by loans only in one jurisdiction and/or by time in another, or being metered by time in multiple jurisdictions but having at least a year's difference in the term.Does publisher type influence differences in licence terms across jurisdictions?
When we isolated the books that sometimes have different licence terms, we found that they were published by the Big 5 publishers at far higher rates than other publishers. This is illustrated in Figure 1, which takes all 90,450 titles available in at least two countries, divides them into columns by publisher type (Big 5 versus other) and jurisdiction & then shows, within each column, the number of titles offered under each licence type.
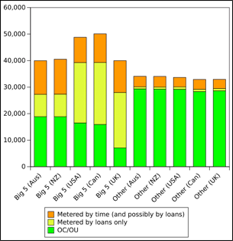
Figure 1: Number of titles offered by publisher and licence type
As Figure 1 shows, licence differences occur across jurisdictions considerably more often in the case of Big 5 publications than other publications. On the full dataset, we calculate that Big 5 publishers were involved in cases involving licence differences from a low of 12,590 cases (in the UK) to a high of 13,946 (in NZ ). Other publishers were involved much less often: from a low of 862 times (in Canada) to a high of 1,381 (in Australia).
Understanding the reasons for these differences is complicated by the fact that copyright is territorial. That means, for example, that it is possible for publisher A to hold copyright in Australia and New Zealand, while publisher B holds the North American rights & thus licence variation across these jurisdiction pairs may be attributable to publishers A and B having different approaches. To control for that possibility, we carried out another experiment where we filtered the dataset to retain only those titles that were always controlled by the same publisher or parent publisher & available in all five territories. Any differences in licence terms for this subset must ultimately be attributable to decisions made within the parent publishing house.
Of the 57,663 titles published by the same publishing group in all five jurisdictions, 29,009 (50.3%) were published by other publishers & 28,654 (49.7%) were published by the Big 5. Despite their almost equal representation in the filtered sample, we found considerable variation in the practices of the different publisher types. Big 5 publishers offered different licence terms, in at least two jurisdictions, in just over a third of all titles (9,645 times). As noted above, almost all of these differences were major, such as being one copy, one user in one jurisdiction and metered access in another. Other publishers did so in just 0.1% of cases (69 times). This confirms that the vast majority of licence differences between jurisdictions are attributable to the decisions made by the five largest publishing houses.
How do licence terms relate to original year of publication?
We were interested to know the rates at which the three licence types (one copy, one user, metered by loans and metered by time) were being applied according to the estimated year of publication for each title. Given that books are known to depreciate quickly, age may be seen as a proxy for assessing the relative value of titles to libraries.
To investigate this, we began with all 388,045 licences and then calculated the proportion each licence type comprised, by year of original publication (Figure 2). Licences metered by time include those that are limited by both time and loans. Note that the curves become much smoother from around 1990: this is because for more recent years we had more data points to calculate the proportion of the different licences.
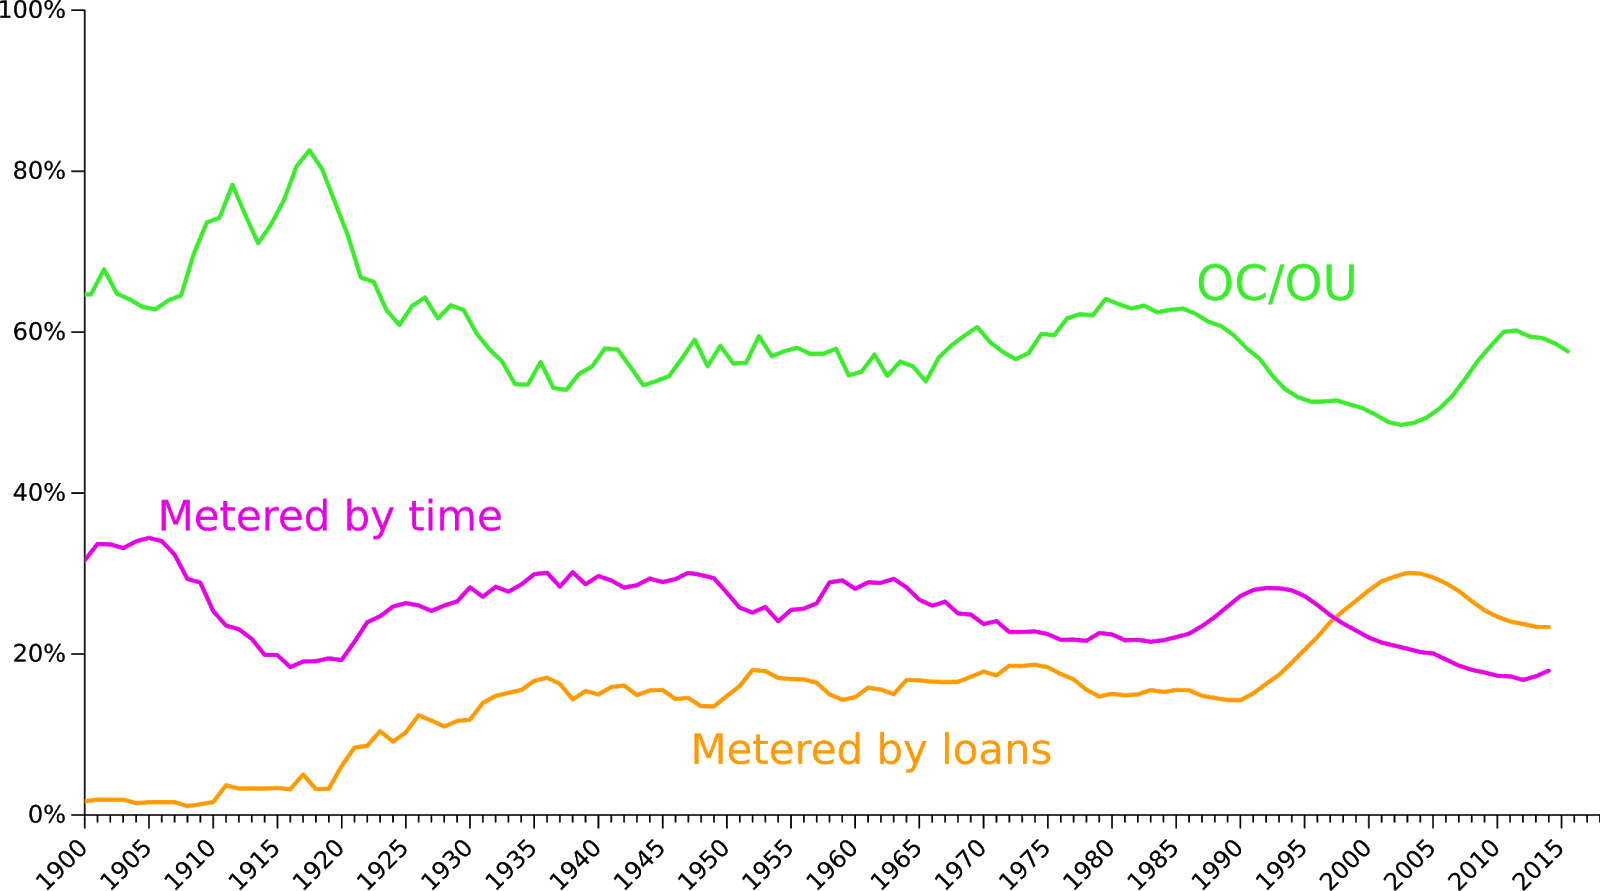
Figure 2: Proportions of licence type by year of publication
Interestingly, in the period up to about 1930, we see a higher ratio of one copy, one user (perpetual) licences to metered access. That correlates with copyright status, with books published before that point likely to be in the public domain & those published afterwards likely to be in copyright.
For books originally published after the 1930s however, the ratio between the licence types is stable. The only notable trend is the slight increase of the number of metered by loans licences which begins for titles published from the 1990s on. This suggests that, for in-copyright titles, title age does not influence publishers deciding which licence to attach to which books.
Pricing
We have shown that licence differences occur across jurisdictions considerably more often in the case of Big 5 publications than other publications; that older books likely to be out of copyright are more often offered on one copy, one user (perpetual) licences, but that age of a title, which can be treated as a proxy for the value of a title to a library, does not seem otherwise to affect licence choice.
In this section we report results of our pricing analyses. We examine how prices compare by jurisdiction, the number and magnitude of price differences on a title level & the relationship between price and original publication year. We then use machine learning to develop a more nuanced understanding of the main characteristics governing price.
How do prices compare by jurisdiction?
We were interested in understanding how price might differ between countries. For this first analysis, we studied the price per circulation of titles as a function of the number of circulations. This makes it possible to combine all the different licence types into a single analysis. For instance, if a title is lent out once, the cost per circulation equals the full licence price, regardless of whether the title is licensed on one copy, one user or metered access terms. For one copy, one user titles we determine the circulation cost by simply divided the entire licence price by the number of loans. For titles on metered licences, we do the same, while also factoring in the cost of additional licences upon expiry. For example, for a twenty-six checkout licence, the cost of twelve checkouts is the cost of purchasing one licence divided by twelve. The cost of twenty-seven checkouts is the cost of purchasing two licences divided by twenty-seven. See Appendix A for further details about how we calculated cost per circulation.
Figure 3 shows the median price per circulation for all titles available in all five countries as a function of the number of circulations. On this aggregate level we observe that, for the 94,328 titles that are available in every jurisdiction, per circulation prices are very similar across countries. The graph shows slight price bumps at twenty-seven and thirty-seven circulations, corresponding to the need to purchase additional licences for the twenty-six checkout and thirty-six checkout or twenty-four months licences.
At the thirteenth circulation, being the median number of circulations per title calculated using the checkout database (see the Methods section), Australia has the lowest price at $0.61, followed by New Zealand ($0.64), Canada ($0.65), the US ($0.69) and the UK ($0.70). When we limit the sample to the 62,044 titles available in all five countries, the difference narrows still further.The cost to libraries at the thirteenth circulation is $0.59 in Canada, $0.61 in Australia, New Zealand and the US & $0.65 in the UK.
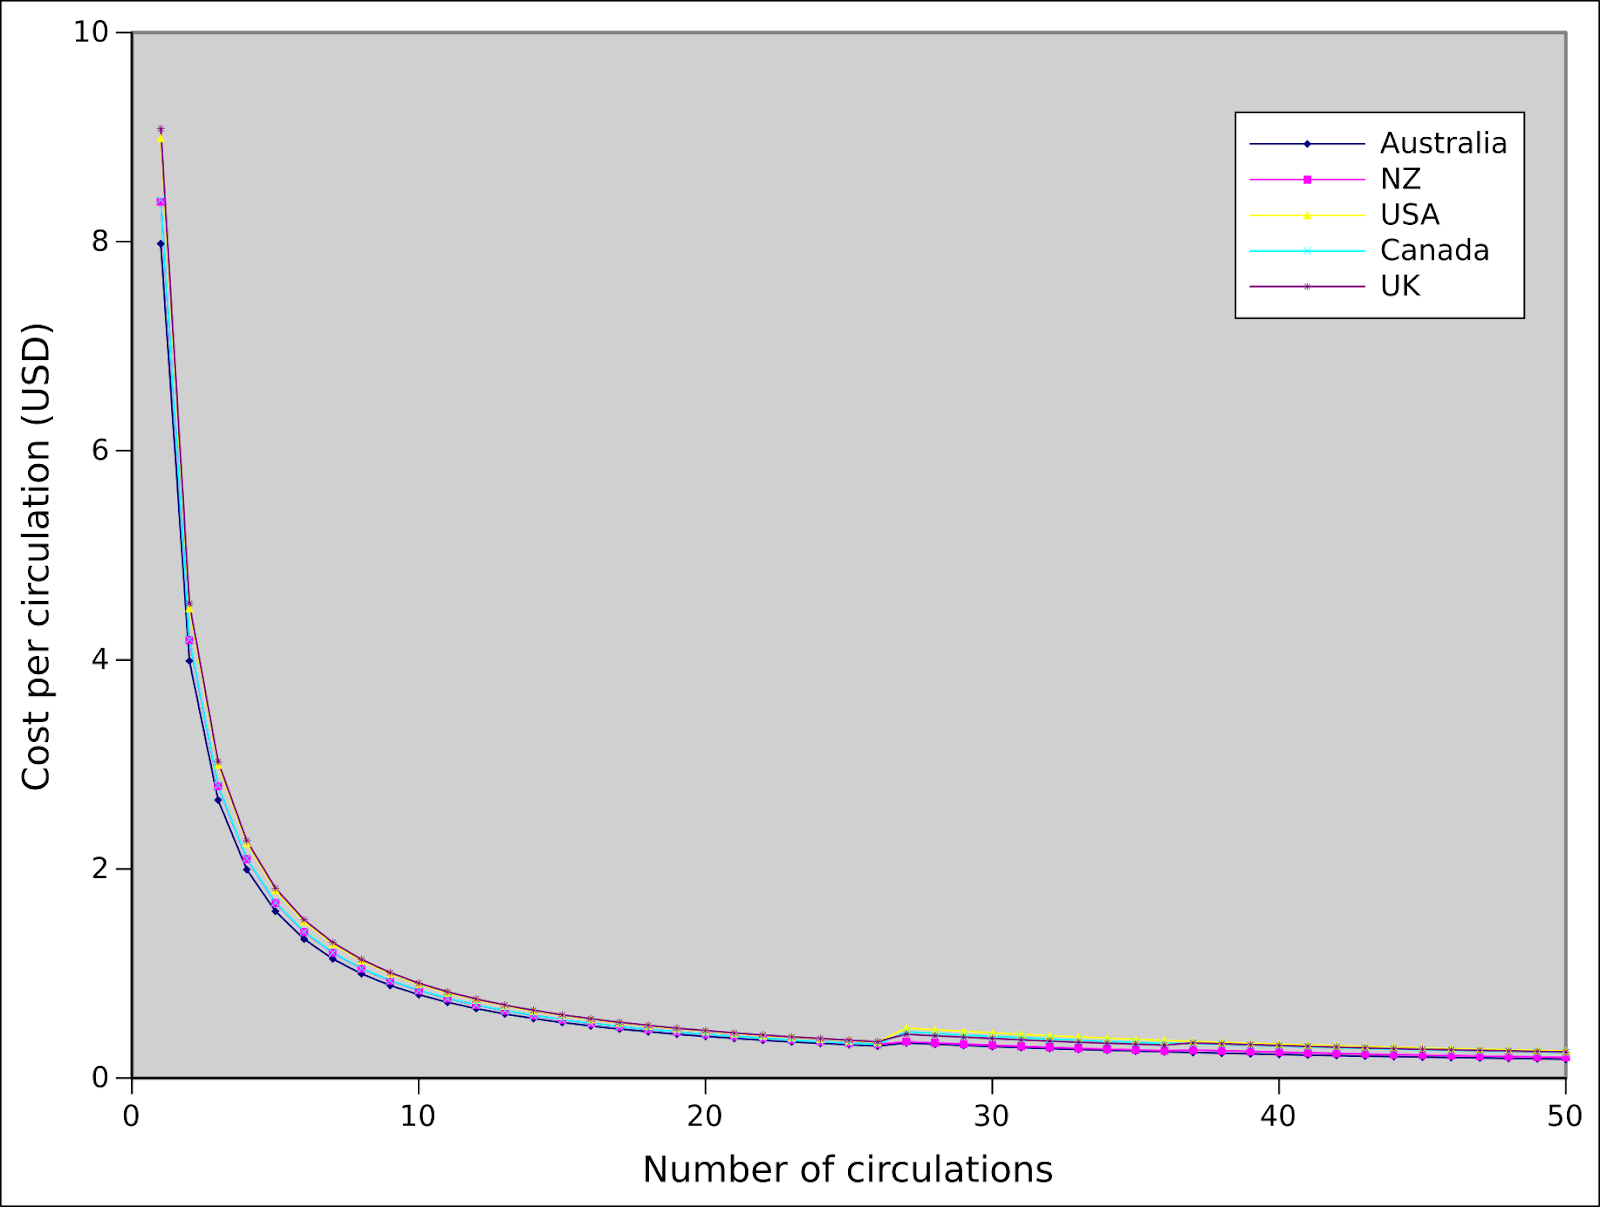
Figure 3: Median prices per circulation
For each combination (e.g., one copy, one user licensed titles published by the Big 5 in the UK) we calculated the median price. Figure 4 shows the results for each combination, separated first by publisher type, Big 5 on the left and other on the right.
For most licenses we observed titles by other publishers have virtually no price difference across countries. The one exception was for the fifty-two checkouts or twenty-four months licence, for which Australia and New Zealand had the highest prices.
We observed much greater variation across licences and countries for the Big 5. For any given licence the price in Australia and New Zealand was very close, except for one copy, one user where New Zealand titles were $US2.41 more expensive than in Australia. Price per licence was also very similar for Canada and the US, except for fifty-two checkouts or twenty-four months, for which the median US licence was $9.19 more expensive. More importantly, for one copy, one user and fifty-two checkouts or twenty-four months, books seemed much more expensive in the UK, Canada and the US than in Australia and New Zealand.
We also found that other publishers had less difference in price across licence types and jurisdiction. Their titles were licenced for a median price between $1.94 and $7.49 regardless of licence and jurisdiction, while the Big 5 had a median price of between $5.57 and $40 (in the US, for the fifty-two checkouts or twenty-four months licence).
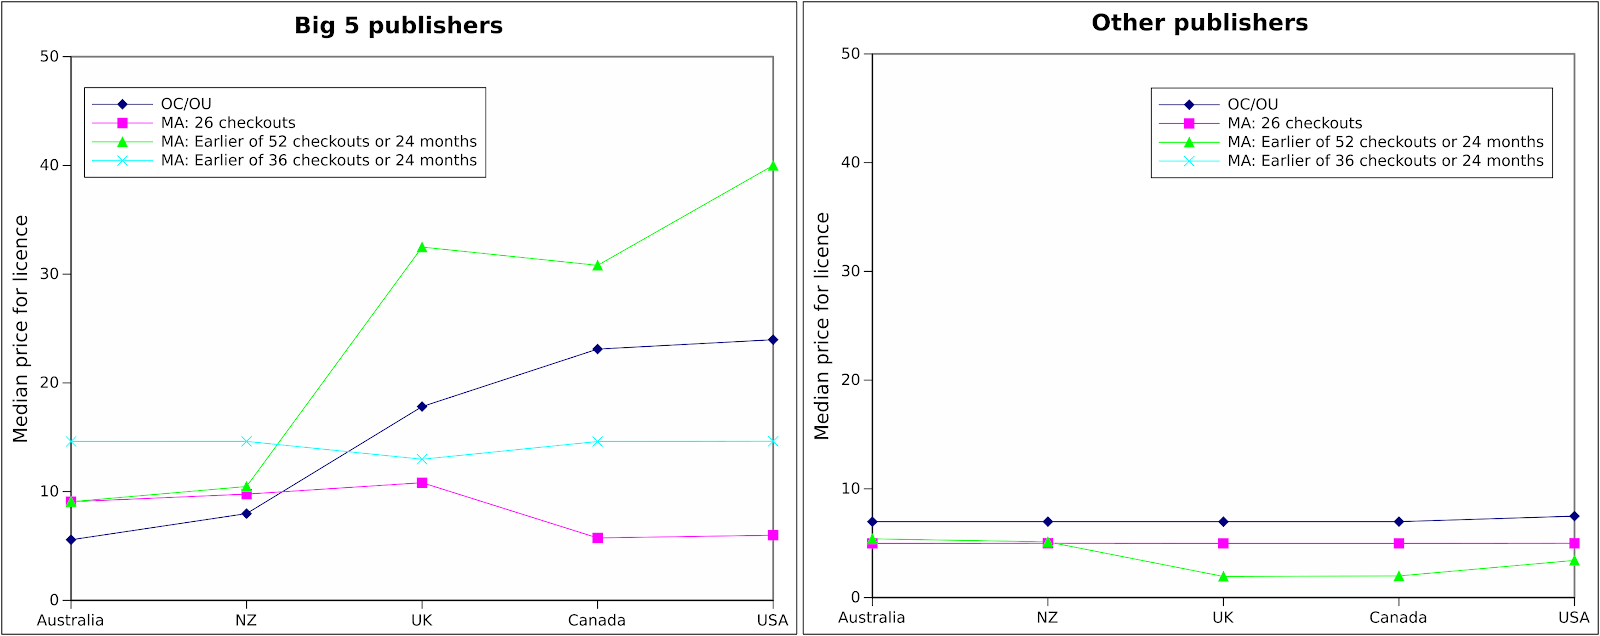
Figure 4: Median prices by publisher
How often are there price differences (and how big are they)?
Above, we found that other publishers had little price difference for their titles across jurisdictions, while the Big 5 diverged significantly. However, that aggregate level analysis does not tell us how often, for a given title, there may have been price differences, or quantify such differences.
To investigate those questions, we began with the filtered dataset of 57,663 titles that were available in all five jurisdictions & which always had the same parent publisher. We then filtered further to include only those titles that have identical licences in every jurisdiction (since we would expect to find price differences where licences are different). Thus refined, the dataset included licenses for 47,949 titles, 19,009 from the Big 5 and 28,940 from other publishers.
To determine whether and how prices varied across jurisdictions, we calculated the mean price for each title in every jurisdiction where it was available. Where we identified a price difference, we determined its size by calculating the percentage of the variation between the mean price and the price furthest from the mean (See Figure 5).
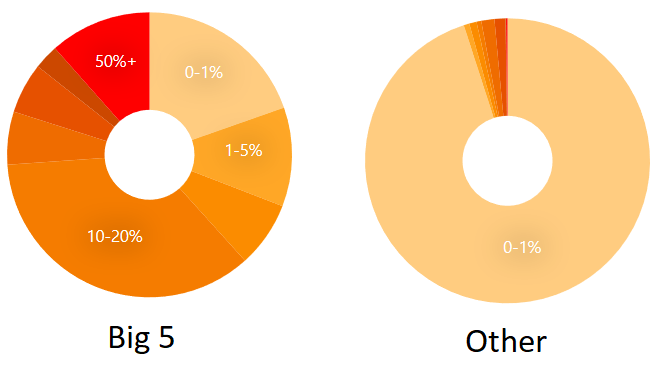
Figure 5: Price differences for identical licences across jurisdictions
As expected, given the results above, we found that almost all price differences across jurisdictions are attributable to Big 5 publishers. Usefully, these results additionally tell us how often differences occurred on a title level, as well as the magnitude of those differences.
Of the 19,009 Big 5 titles, just 19.6% had a price difference of 0-1%, while 35.6% had a difference of 10-20% & a further 26.1% a difference greater than 20%. In 2196 cases (11.6%), identically licensed titles, controlled by the same parent publisher, had a price difference across jurisdictions greater than 50%. Thus, for example, titles in Sue Grafton's beloved Kinsey Millhone detective series are made available by Macmillan in all five countries on identical fifty-two checkout or two-year licences, with prices varying from $6.97 (Australia) through $32.49 (UK) and up to $40 (US).
By contrast, fully 95% of the 28940 titles from other publishers had the smallest possible difference of 0% to 1% & just 2.9% had a difference greater than 20%. Again, these results may be explained by the fact that publishers outside the Big 5 are less likely to have different divisions in different countries each with their own e-lending policies and procedures.
How does price relate to original year of publication?
We found that, for books that are restricted by copyright, the original year of publication does not appear to impact the license terms. We then further interrogated the data to ascertain whether the publication year affects price.
Figure 6 charts the median price for all one copy, one user licences by estimated original year of publication. This is the most common form of licence in our sample, making up 222,810 of the total 388,045 licences. The chart shows a sudden sharp rise in the price of books at around 1930. Before that point, most books are likely to be in the public domain, while after that point they are likely to be restricted by copyright. The difference in copyright status correlates to a tripling or quadrupling of price.
These data also show that books published in the 1950s and 1960s are the most expensive, albeit from a much smaller number of titles in those years. When we investigated, we found that these titles were disproportionately published by Penguin Random House, which had a higher median price for its titles than publishers as a whole.
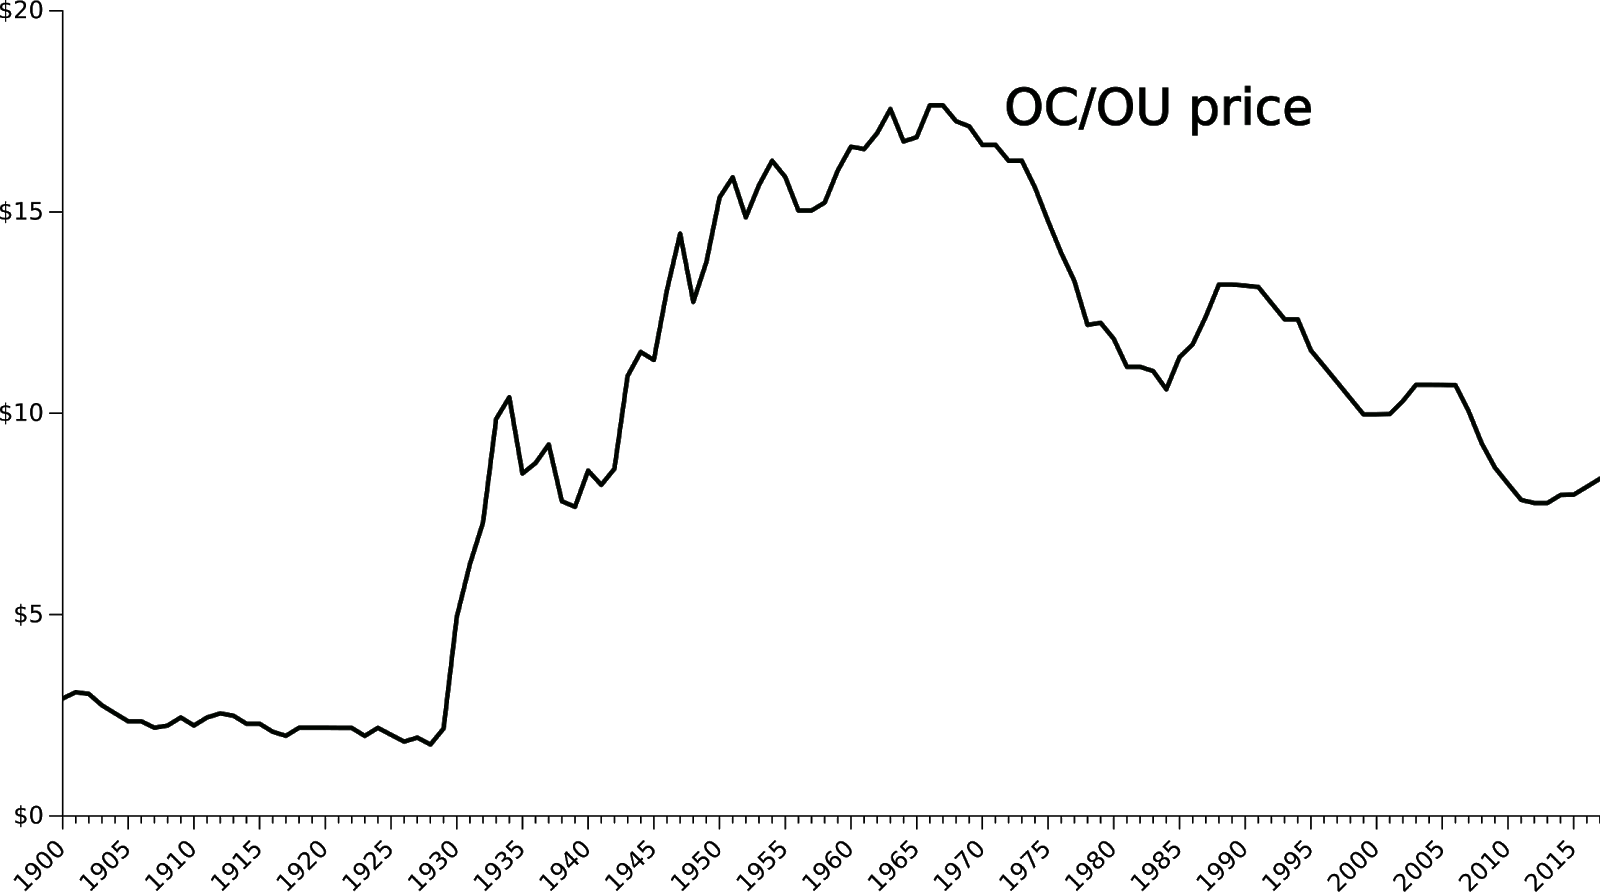
Figure 6: Median price for one copy, one user (OC/OU) licences by year of publication
Although there were insufficient data points to usefully chart the other main forms of licence for the entire data range, Figure 7 does so from 1980 on.
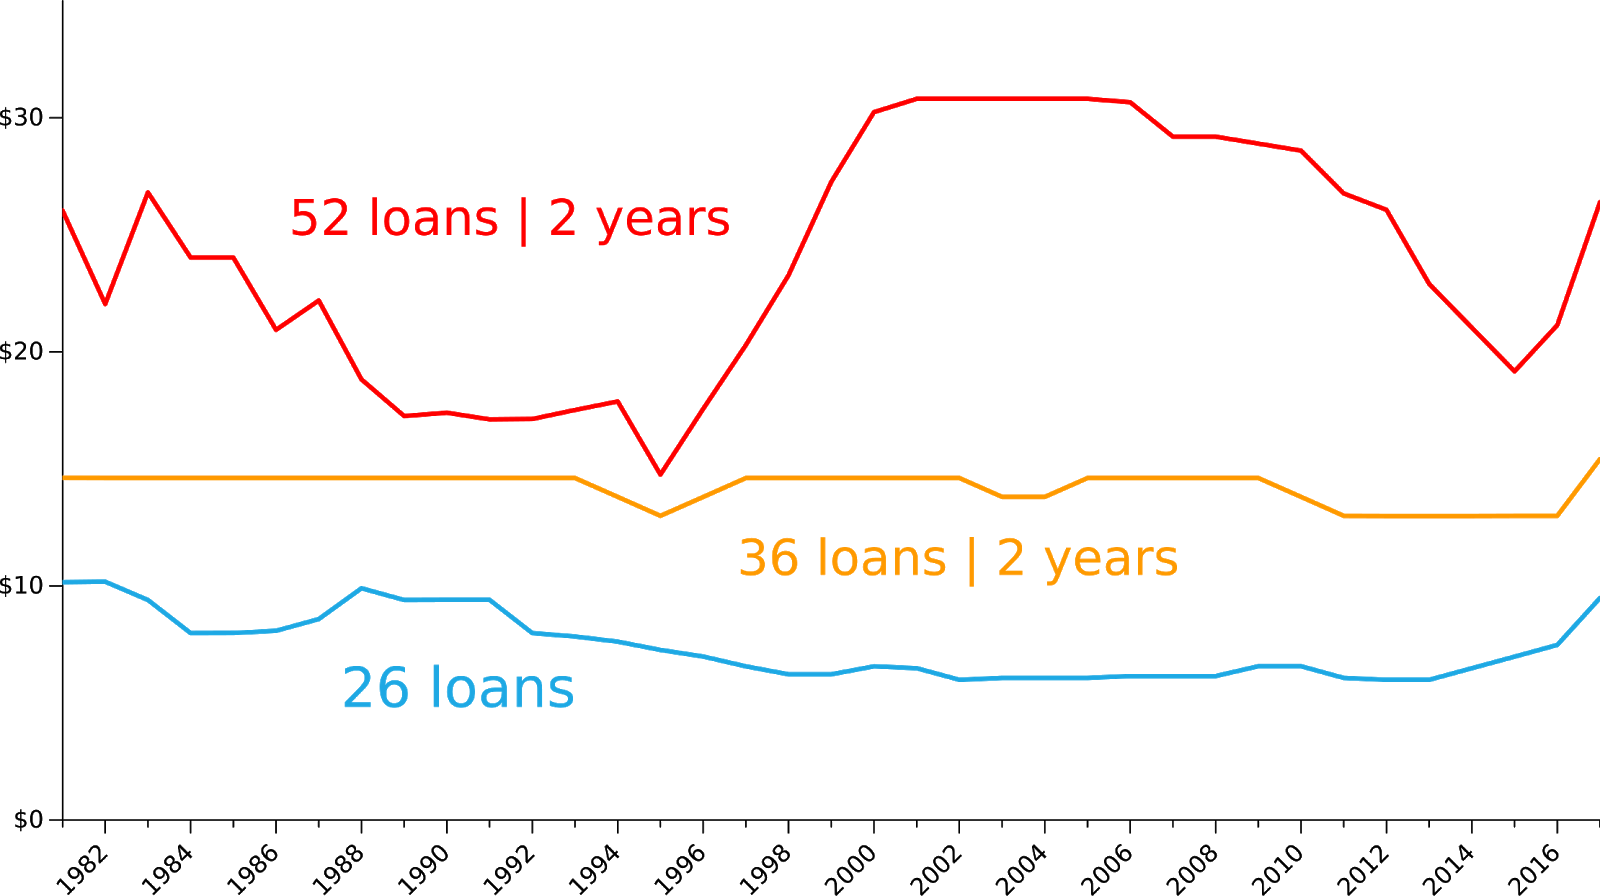
Figure 7: Median price for all licence types by year of publication from 1980 onwards
The twenty-six checkout licence has the most data points after one copy, one user (OC/OU), with 87,697 licences. The fifty-two checkout and thirty-six checkout licences have 29,597 and 22,390 data points respectively. The graph shows little difference in price for titles originally published between 1981 and 2017 and made available under twenty-six checkout and thirty-six loan or two year licences. There are more fluctuations for the fifty-two loan or two year licence. Overall however, given the relative amount of data for each licence, it appears that there is little relationship between title price and their original year of publication.
What can machine learning tell us about the main characteristics governing price?
Our analyses above identified two main elements that influence price: whether the book is in the public domain & whether it is published by a Big 5 publisher.
We were interested in knowing how strongly these elements influenced price relative to other potentially significant factors, such as the rights libraries get in exchange for the purchase price and the age of the book (of particular interest given books depreciate so quickly). We had already found that price does not change significantly relative to the age of the book, except for the very old titles that are in the public domain, but wanted to better understand how much of an influence the age of a title has on price, compared to other factors. We also wanted to drill down into whether pricing was consistent across the Big 5, or whether there were marked differences across those large publishing houses.
The size and complexity of the dataset limit the extent to which we can establish these relationships by manual analyses. Accordingly, we investigated these interrelationships by using machine learning to build a model predicting price for the 388,045 licences in our dataset. The aim was not to create an operational predictive model, but rather to harness the power of machine learning to extract the most informative combination of features that might govern price. The machine-learning software, the scikit-learn Python framework,learnt a regression tree with the optimisation function being the minimisation of the squared price difference between the predicted value and actual value. More simply, the model was trying to find clusters of licences that seemed to be governed by the same rules with regard to price. The features the model could learn from were the publisher, whether it was Big 5 or other, the length of licence in months and the number of checkouts permitted, the original year of publication & jurisdiction.
We have analysed the regression tree up to depth eighty. That image is too large to be viewed with standard software, but the tree to depth three is set out in Figure 8 by way of illustration.
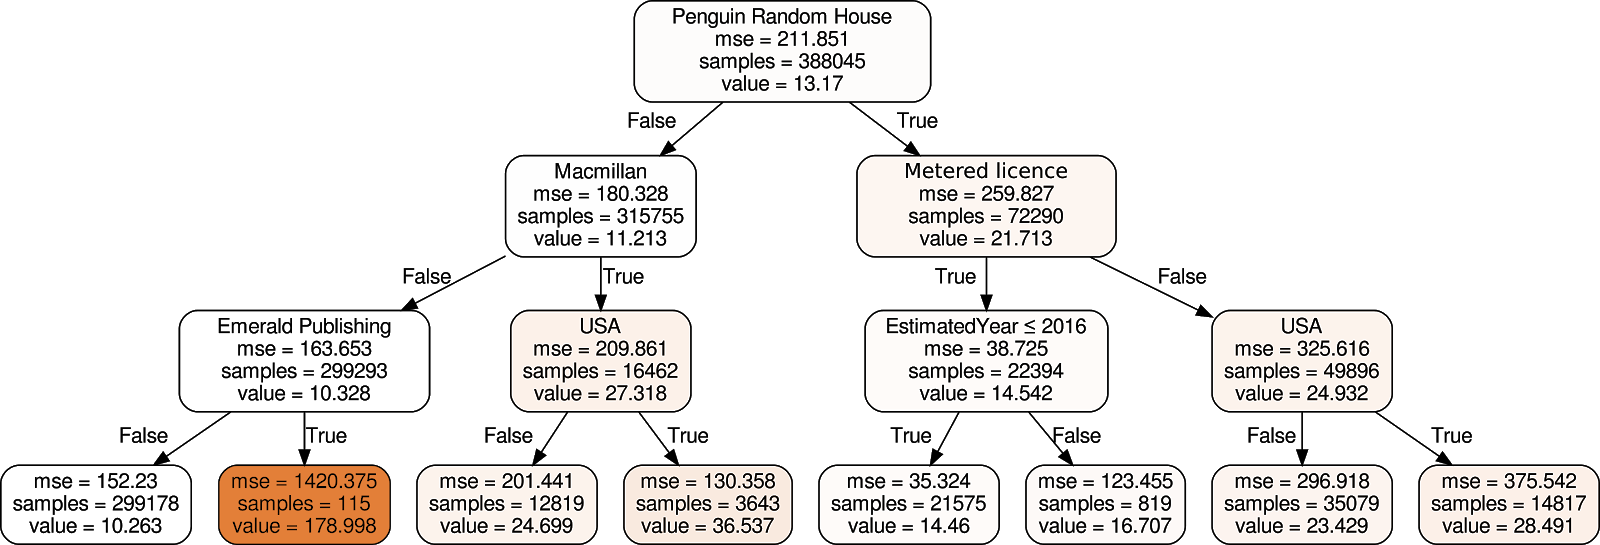
Figure 8: Regression tree to depth 3
The tree splits first on twelve individual publishers: Penguin Random House, Macmillan, Emerald Publishing, Hachette, Elsevier, Kogan Page Publishers, John Wiley & Sons, Princeton University Press, Bloomsbury, WW Norton, NBN International and Trajectory. This mix of large trade houses and academic presses appears to have the most marked patterns in their pricing. After these twelve publishers, the next most important predictor is whether the book was published before 1929 or after (effectively, whether or not it is in the public domain). For titles that are published from 1930, the model then splits on publisher another twelve times before finally finding something other than publisher to be the best predictor; this time whether or not the licence was in the UK. The model splits at this point because the average price for the licences in the UK (~45,000 remaining at this point) is $9.98 versus $8.35 for the other countries. For countries outside the UK, the algorithm then continues to find specific models for individual publishers.
Once the model splits on a publisher, it then uses a variety of different features to reach its final price predictions. For Penguin Random House titles, the next most important characteristic is licence type (whether published as one copy, one user or metered), for Macmillan, it is whether the licence is in the US (the model finds that books licenced by Macmillan in the US are on average licensed at $36.58 in the US compared to $24.70 in the other four jurisdictions). For John Wiley & Sons, by contrast, the first split is publication year: surprisingly, books published in 2007 or earlier are more expensive than newer titles, with an average price of $51.18, versus $33.92. Notably, the model rarely splits on publisher type (i.e., Big 5 or other) showing that individual publishers have more marked pricing features than the rest of their group.
It is striking that publisher is so often the most important predictor of price, ahead of even licence features (like duration and number of checkouts) which determine what libraries get in exchange for the purchase price. This suggests that licence characteristics are simply not high level features: in other words, that the rights libraries actually get have little relationship with the price paid for them.
Availability
We have studied the absolute availability of books for e-lending by jurisdiction and publisher type in our related work (Giblin et al., 2019). In this paper we examine relative availability, since to be included in the study a title had to be available in at least one of our five jurisdictions. Below, we compare availability across the five jurisdictions & then drill further into the relationships between availability, publisher type and jurisdiction.
What is the relative availability of books across the US, Canada, UK, Australia and New Zealand?
Across the five jurisdictions, our complete sample of 94,328 titles was available at rates ranging from 77.5% (UK) to a high of 88.2% (Canada) (see Figure 9). This means that, for instance, Canada had access to 88.2% of the titles that were available in at least one country. We found that 62,044 of the 94,328 sampled titles (65.7%) of sampled titles were available in all five countries. Just 4% appeared in only a single jurisdiction.
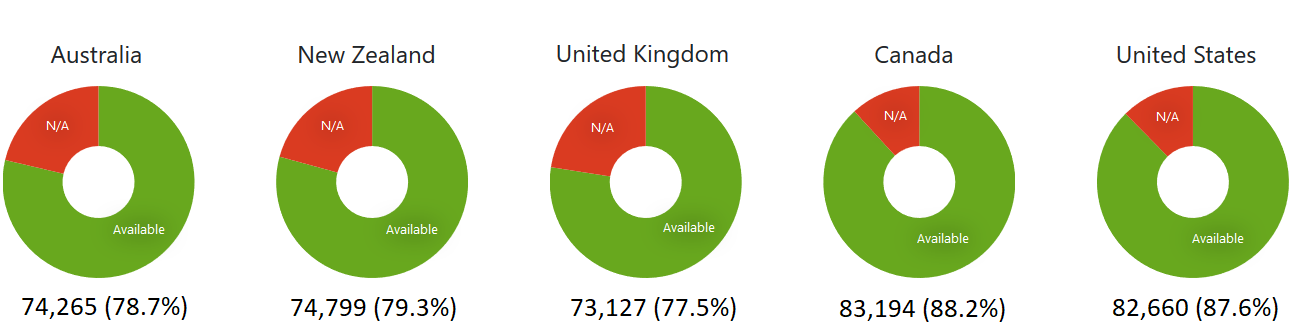
Figure 9: Relative availability of titles across jurisdictions
As described in the methods section, our sample was skewed towards the books that were most read in e-book form in Australian libraries. Thus, it is striking to see that Australia has the second worst availability of the countries studied, bettering only the UK, which has the worst availability. If a random sample of titles had been used, rather than the sample favouring Australian libraries, we would have expected Australia's availability to be still worse.
What are the relationships between availability, publisher type and jurisdiction?
We looked at the 32,284 titles that were available in four jurisdictions or fewer, to see if we could identify jurisdictional patterns to availability. We did this by selecting books that were not available in a given country and then studying where they were available. The results are set out in the contingency matrix given in Table 1, which details how often were titles available in country X (columns) while not available in country Y (rows). For instance, the second cell 4% (88%) is to be read as follows: out of the 20,063 titles that are not available in Australia (line), 4% of them were actually available in New Zealand (column), of that 4%, 88% were published by Big 5 publishers.
| Unavailable in... | Available in... | ||||
|---|---|---|---|---|---|
| Australia (54% published by Big 5) | New Zealand (54% published by Big 5) | United States (59% published by Big 5) | Canada (60% published by Big 5) | United Kingdom (55% published by Big 5) | |
| Australia (20,063) | — | 4% (88%) | 87% (88%) | 82% (91%) | 24% (96%) |
| New Zealand (19,529) | 1% (22%) | — | 87% (87%) | 81% (91%) | 25% (95%) |
| United States (11,668) | 78% (78%) | 78% (78%) | — | 21% (80%) | 69% (80%) |
| Canada (11,134) | 67% (77%) | 67% (78%) | 18% (52%) | — | 57% (79%) |
| United Kingdom (21,201) | 28% (78%) | 31% (80%) | 83% (85%) | 78% (88%) | — |
Two findings from this analysis are particularly striking. First, we find close availability pairings between Australia and New Zealand & between the United States and Canada. Thus, if a title was unavailable in Australia, it was highly likely to be unavailable in New Zealand too, but very likely to be available in both the US and Canada. Similarly, if a title was unavailable in the US it was also likely to be unavailable in Canada, but available in Australia and New Zealand.
Second, we find that, in the overwhelming majority of cases where books are not available in all five countries, they are published by Big 5 publishers in the countries where they are available. The top row sets out the percentage of available books published by the Big 5 for each country. We see, for example, that 87% of the books missing from Australia are available from the US & that 88% of those are published by a member of the Big 5. That is considerably higher than the overall percentage of Big 5 titles published within the US, which is 59%. This phenomenon is replicated in all countries, but starkest in the UK. Just 55% of the titles available there are published by the Big 5, but titles unavailable in other countries while available in the UK are from Big 5 publishers at rates ranging from 79% to 96%.
These availability patterns make sense given how book markets are set up. A contract might award North American rights to one publisher & rights to Australia and New Zealand (or even the entire English-speaking Commonwealth) to a separate division or another publisher altogether. They are also consistent with our findings that Big 5 publishers license titles on different terms across jurisdictions at far higher rates than other publishers, likely because they have the resources and infrastructure to do so.
Discussion and conclusions.
Our results shed new light on the pricing and licensing practices of book publishers in global English-language markets & the availability of titles for e-book lending.
Publishers are overwhelmingly offering titles on a one size fits all model rather than offering libraries a range of licence options to accommodate their different needs. That one size extends across jurisdictions, where we found little difference in licence or price. Where variation occurred, it largely originated with Big 5 publishers, who also offered a much smaller proportion of titles on a one copy, one user basis & more licences metered by time (i.e., licences that expire regardless whether a title has been borrowed or not). Most importantly, we found that licence terms were not affected by age, with older titles being licensed similarly to new releases.
The most important factor affecting the price of a title is who publishes it. Price varied relatively little by jurisdiction & is also largely independent of the book's age, unless it is in the public domain, or even the kind of licence applied. Relative availability was similar across jurisdictions, although somewhat better in North America (Canada and US) than in Australia and New Zealand, or the UK. Overall, the UK has the least attractive licence terms, the highest prices & the lowest availability.
These results are of interest because of the potential for these practices to affect the types of books that libraries are able to add to their e-lending collections & thus the culture to which their patrons have access. A library focused on maximising bang for its circulation buck is likely to hesitate before adding a fifty-year-old title on the same terms and for the same price as a brand new blockbuster release. Thus, by setting terms independent of the value to libraries of titles, publishers may disincentivise libraries from adding older and less-demanded books to their collections. In follow-up work we will test this hypothesis through a survey of public librarians to ascertain how the publisher licensing and pricing practices we have identified here impact library decision-making. We will then use the combined data from our related work, this study and the survey as a foundation for making recommendations for reform to domestic and international law and policy and practice.
Acknowledgements
This research was partially funded by the Australian Research Council through projects LP160100387, FT170100011 and DE170100037. It also benefited from cash and in-kind contributions from research partners: National and State Libraries Australia, the state libraries of Western Australia, South Australia and New South Wales, the Australian Library and Information Association, Yarra Plenty Regional Library, Gold Coast Libraries, Brisbane City Council Libraries, Auckland Council Libraries, Vancouver Public Library, St Mary's County Library and Hampshire Library Service.
About the authors
Rebecca Giblin is an Australian Research Council Future Fellow and Associate Professor in Monash University's Faculty of Law. Her primary research interests centre upon copyright, technology regulation & the regulation of culture (particularly how the law impacts the creation and dissemination of creative works). She can be contacted at rebecca.giblin@monash.edu.
Jenny Kennedy is a Postdoctoral Research Fellow at RMIT, Melbourne. Jenny's research interests cover media practices in everyday life, social discourses around technology use & material culture, especially in domestic contexts. She can be contacted at jenny.kennedy@rmit.edu.au.
Charlotte Pelletier is a Postdoctoral Research Fellow in Machine Learning at Monash University. Her research focuses on the classification of time series with applications dedicated to Earth's observation. She can be contacted at charlotte.pelletier@monash.edu.
Julian Thomas is a Professor of Media and Communication at RMIT. He is a researcher in digital media and the internet, including media, communications and information policy and the history of communications technologies. Julian's recent work includes the Australian Digital Inclusion Index (2016-2018), Internet on the Outstation (Institute of Network Cultures, 2016) & The Informal Media Economy (Polity, 2015). He can be contacted at julian.thomas@rmit.edu.au.
Kimberlee Weatherall is a Professor of Law at the University of Sydney Law School, teaching and researching across intellectual property law and the IP-technology nexus. Kimberlee has published extensively in leading Australian and international journals on issues ranging from digital copyright & bilateral and multilateral trade agreements and IP, to the conception of the consumer in trade mark law. She can be contacted at kimberlee.weatherall@sydney.edu.au.
François Petitjean is a Senior Research Fellow in Machine Learning at Monash University. His research interests include the modeling of high-dimensional data, time series analysis, statistical testing and their applications to environmental and social studies. He can be contacted at francois.petitjean@monash.edu.
References
- Albanese, A. (2018, September 4). Penguin Random House changes library e-book lending terms. Publishers Weekly. Retrieved from https://www.publishersweekly.com/pw/by-topic/industry-news/libraries/article/77904-penguin-random-house-changes-its-library-e-book-terms.html (Archived by WebCite® at http://www.webcitation.org/78axT3a6S)
- Alipour-Hafezi, M. & Khedmatgozar, H. (2016). E-lending in digital libraries: a systematic review. Interlending & Document Supply, 44(3), 108-114.
- Almossawi, A (2019). The Big 5 US trade book publishers. Retrieved from http://almossawi.com/big-five-publishers/ (Archived by WebCite® at http://www.webcitation.org/78axWnvMP)
- Ashcroft, L. (2011). Ebooks in libraries: an overview of the current situation. Library Management, 32(6/7), 398-407.
- Bergström, A., Höglund, L., Maceviciute, E., Nilsson, S.K., Wallin, B. & Wilson, T.D. (2017). Books on screens: players in the Swedish e-book market. Gothenburg, Sweden: Nordicom.
- Blackwell, M. (2017). Results of ReadersFirst e-content business models survey. ReadersFirst. Retrieved from http://www.readersfirst.org/news/2017/11/29/results-of-readersfirst-e-content-business-models-survey-2 (Archived by WebCite® at http://www.webcitation.org/72gm14oEk)
- Bryant, M. (1979). English language publication and the British traditional market agreement. The Library Quarterly, 49(4), 371-398.
- Giblin, R. & Weatherall, K. (2015). At the intersection of public service and the market: libraries and the future of lending. Australian Intellectual Property Journal,twenty-six(4). Retrieved from http://ssrn.com/abstract=2647705 (Archived by WebCite® at http://www.webcitation.org/78axpupHh)
- Giblin, R., Kennedy, J., Weatherall, K., Gilbert, D., Thomas, J. & Petitjean, F. (2019). Available – but not accessible? Investigating publisher e-lending licensing practices. Information Research, 24(3) paper 837 Retrieved from http://informationr.net/ir/24-3/paper837.html
- Giblin, R., Kennedy, J., Ngarmtrakulchol, W., Pelletier, C., Thomas, J., Weatherall, K. & Petitjean, F. (2018). What can 100,000 books tell us about the international public library e-lending landscape? (Dataset) Retrieved from http://elendingproject.org/large_full.html (Archived by WebCite® at http://www.webcitation.org/78axd2eGS)
- Girard, A. (2014). Reader's block: a systematic review of barriers to adoption, access and use in e-book user studies. Information Research, 19(2), paper 624. Retrieved from http://InformationR.net/ir/19-2/paper624.html (Archived by WebCite® at http://www.webcitation.org/78axjXPKf)
- Gorman, M.E. (2000). Our enduring values: librarianship in the 21st century. Chicago, IL: American Library Association Editions.
- Kumbhar, R. (2018). Trends in e-book research. Journal of Library & Information Technology, 38(3), 162-169.
- Martindale, G., Willett, P. & Jones, R. (2015). Use and perceptions of e-books in Derbyshire libraries. Library Review, 64(1/2), 2-20.
- OverDrive (2019). Public libraries achieve record-breaking ebook and audiobook usage in 2018. Cleveland, OH: OverDrive. Retrieved from https://company.overdrive.com/2019/01/08/public-libraries-achieve-record-breaking-ebook-and-audiobook-usage-in-2018/ (Archived by WebCite® at http://www.webcitation.org/76VmVEM5l)
- Sieghart W. (2013). An independent review of e-lending in public libraries in England. London: Department of Culture, Media and Sport. Retrieved from https://www.iow.gov.uk/azservices/documents/2791-E-Lending%20in%20Public%20Libraries.pdf (Archived by WebCite® at http://www.webcitation.org/76hm1t5r9)
- Thompson, J.B. (2005). Books in the digital age: the transformation of academic and higher education publishing in Britain and the United States. Cambridge: Polity Press.
- Thompson, J. (2010). Merchants of culture: the publishing business in the twenty-first century. London: Polity.
- Whitney, P. & Castell, C. (2017). Trade ebooks in libraries: the changing landscape. Berlin, Germany: Walter de Gruyter GmbH.
- Wilson, T.D. (2014). The e-book phenomenon: a disruptive technology. Information Research, 19(2), paper 612. Retrieved from http://www.informationr.net/ir/19-2/paper612.html (Archived by WebCite® at http://www.webcitation.org/78ay4wwx2)
- Yoonmo, S. (2017). The politics of ebooks. International Journal of Media & Cultural Politics, 13(3), 211-228.
- Zhang, M. & Senchyne, J. (2017). Libraries and publisher price control: the net price system (1901–1914) and contemporary e-book pricing. Libraries: Culture, History & Society, 1(2), 171-193.
How to cite this paper
Appendix A - Additional methodological detail
Aggregator data
Pricing data were originally in the local currency for each jurisdiction. We converted all prices to US dollars as of the last day of the month before collection (i.e., 30 June 2017). This was the date they were originally calculated by Overdrive, thus controlling for differences that could have been attributable to exchange rate fluctuations.
Matching records
The main rules used by the matching algorithm were to ignore case (e.g. 'a' was treated as identical to 'A'), equalise US and UK spellings & remove special characters such as brackets, slashes, dots and hyphens. For titles that were not matched after that, we looked for misplaced subtitles and removed stop words ('the', 'a', 'an'). To be sure that titles really were identical, we required all listed authors to match in each jurisdiction (which means that if two authors were listed in one record because one wrote a foreword, it would not be matched to another record unless it had the same two authors, even if the title was the same). Where there was no match, we also reduced author names to their first initial and last name and looked to match that name and title pairing in other jurisdictions.
To assess the accuracy of the linking process we randomly selected twenty-five records. A record is identified by its title, its authors & jurisdiction. We then tasked an independent researcher with linking those records to the same title in other countries, or to indicate no link where it was not available in a country. That resulted in 100 accurate, human-constructed links. We then checked those links against the algorithm-linked database, assessing which had been correctly identified (true positives), links correctly identified as missing (true negatives), links that were found where they should not have been (false positives) and links that were not have found but should have been (false negatives). Of the 100 tested links, ninety-five were detected as present by our researcher & five were absent. Our algorithm reached identical results, indicating zero errors out of a possible 100 showing there were no false negatives or false positives & it found the same true positives and true negatives. While this is not to say definitively that our algorithm has not made any matching errors on the full dataset of almost 100,000 books, it positions its accuracy to be below 0.5% (calculated by using Laplace smoothing with pseudo-count of 0.5). This gives high confidence in the validity of the results we present.
Choosing licences
In the 3% of cases where there were multiple licence options, we needed to reduce to a single ‘best’ licence to enable cross-jurisdictional comparison on a title-level. We did so by applying the following rules:
For licences metered by number of checkouts only, we divided prices by that number. Eg atwenty-six loan licence for $26 equated to a per loan cost of $1;
For licences metered by time only, we assumed titles would be checked outtwenty-six times per year and divided by that number. E.g. a 12 month licence for $20 equated to a per loan cost of $0.77.
For licences metered by both time and checkouts, we assumed that books would be checked out the maximum number of times permitted under the licence and divided by that. E.g. a book licenced on afifty-twoloan or 24 month licence for $30 equated to a per loan cost of $0.58.
For one copy, one user OC/OU licences, we assumed books would be checked out 78 times (26 times x 3 years) and so divided prices by 78.
Estimating publication years
Estimating each title’s original year of publication was a challenging exercise not only because of the sheer number of books in existence, but because identical titles often refer to multiple different works & because the same work can be re-published over many years.
Our publication year estimation method utilises the Goodreads Application Programming Interface (API). Our first request is by the book title and name of the first author. If the Goodreads API returned multiple responses, we then computed a similarity score based on the Levenshtein distance. The similarity score was the arithmetic average of an author similarity score and a book similarity score. The author similarity score was first computed between the first author name of the query and the first author name of each request result. If it was lower than 0.7, we estimated the author similarity score as the maximum similarity score between all the available author names of the query and the first author name of each request result. The book similarity score was computed between the title book of the query and the title of each request result. We then extracted the publication year of the result with the highest average similarity score for which the publication date were given by Goodreads.
Where the first Goodreads request on the book title and the first author name gave no results, we performed a second request by book title only. In that case the similarity score corresponds to the author similarity score. Where this second Goodreads request gave also no result, we performed a third request by only the name of the first author. The similarity score was then equal to the author similarity score.
Where the similarity score was less than 0.5, we had insufficient confidence in the result and declined to estimate a publication year. In addition to cases where the similarity score was too low, we also declined to make an estimate in two other main cases: where there was only one request result, but it did not contain a publication date & where the title could not be matched at all via the Goodreads API. Ultimately, we declined to estimate a publication year in 8% of cases. In all analyses involving estimated publication year, we have excluded the non-estimated books from the sample. An estimated publication year of 2020 is used to designate the titles for which we declined to make an estimate; this was chosen as a year that is not represented within the data.
We evaluated and tested this method on a random subsample of 100 books for which a researcher independently manually assessed original publication year. For this subsample, our algorithm declined to estimate a year for 6 titles and achieved a perfect estimation for 73. Overall, our accuracy rate was 77.7% & estimations were within ± five years in 91.5% of cases. As shown in Figure 10, where the publication year was estimated incorrectly, it was almost always underestimated. We found the method not to make robust estimations for titles that were subsequent editions of previously issued books with additional authors added. For example, our sample included the graphic novel edition of the Mancini Marriage Bargain, co-authored by Trish Morey and Ayumu Aso and published in 2015. Because our method primarily relies on the first author’s name, it estimated a publication date of 2005, which is when the original novel (authored by Trish Morey alone) was published. Nonetheless, we obtained better results with this method than when we attempted to match all author names.
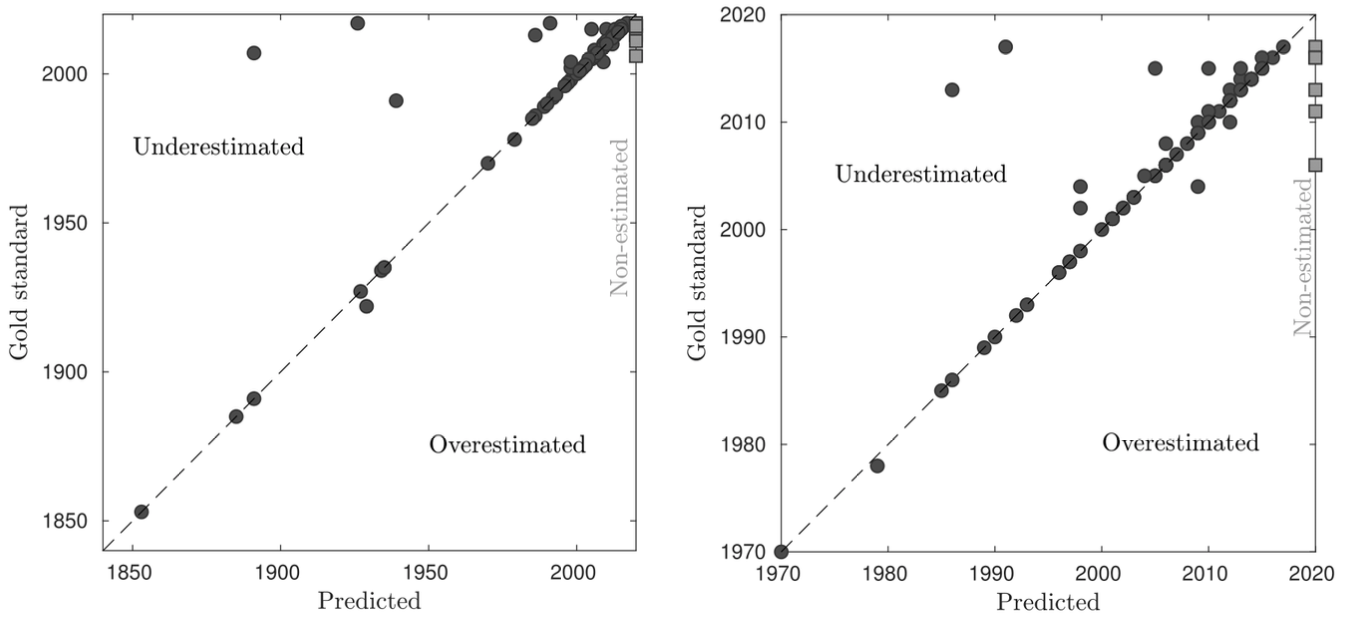
Figure 10: Results of publication year estimations
Calculating cost per circulation across jurisdictions
When licences were metered by time and/or by number of checkouts, we used the most conservative estimation (e.g., to give the highest potential value to libraries). For licences metered by time, we assumed they would be lent out constantly every two weeks for the entire term (i.e., twenty-six loans a year). For licences limited by time and loans, we assumed they would be lent out the maximum amount permitted, that is, thirty-six times for a thirty-six loan or two year licence.