Semantic structures of business analytics research: applying text mining methods
Mohammad Soltani Delgosha, Nastaran Hajiheydari, and Hamideh Saadatmanesh.
Introduction. Business analytics has grown exponentially over the last decade, combining technologies, systems, practices and applications. It has attracted both practitioners and academics based on its capabilities to analyse critical business data to gain new insights about business operations and the market. The research goal of this paper is to identify major research topics and trends using text mining techniques.
Method. We applied text mining methods such as co-word analysis and topic modelling to 1,024 published research documents in the business analytics field found in the Web of Science and Scopus databases.
Analysis. We used term co-occurrence maps and latent Dirichlet allocation to mine and visualise data.
Results. Findings showed that the knowledge structure of business analytics consists of three main themes: analytical methods, business analytics in practice, and business analytics value creation. Big data analytics, machine learning, and data science techniques are major topics. Further, business analytics research topics were identified and clustered into four thematic groups.
Conclusions. The findings present a context for business analytics research development. They show recent trends in the field, namely a predominant interest in big data analytics, social networks, business value, the health sector, and customer retention.
Introduction
Organisations always encounter business challenges such as limited resources, uncertain demands and unsustainable competitive advantages relative to competitors, barriers to new market entrants and disloyal customers or suppliers. However, the future looks more promising because of the increasingly sophisticated and widespread uses of data and analytics (Ward et al., 2014). Over the past decade, business analytics has been heavily used to drive better decision making for organisations, give value to data, and improve performance and outcomes (Mayhew et al., 2016). According to a study performed by IBM researchers, about 341 organisations actively use analytics and highly-performing organisations are 79% more likely to use analytics tools compared to other companies (Marshall et al., 2015).
The speedy growth of information technology has led to the growth in raw data production, which has ultimately led to more research opportunities in the areas of business intelligence and analytics. Business analytics is about leveraging value from data (Acito and Khatri, 2014), and it extensively has been used to examine and predict what has caused certain results (Reed and Dongarra, 2015). Currently, business analytics systems are an important strategic investment for many organisations and strongly establishing its capabilities is one of the main concerns of chief information officers (Cosic et al., 2012). Recently, it has become an important interdisciplinary field of business, computer science and information systems (Holsapple et al., 2014), which makes universities recruit experts with a firm, multidisciplinary orientation (Sun et al., 2017).
The concept of business analytics as the use of data to make decisions has a long history (Davenport and Harris, 2007). But in the last few years, based on a large number of books, articles, research reports, Webinars, and survey findings, it has become increasingly popular (Watson, 2011). Today’s conventional views of business analytics are centred on data examination, calculation, or inference operations (Holsapple et al., 2014). Ram and Delen (2018, p. 2) argue: ‘business analytics is the art and science of discovering insight – by using sophisticated mathematical, statistical, machine learning, and network science methods along with a variety of data and expert knowledge – to support better and faster/timely decision-making’. Davenport and Harris (2007, p. 7) define business analytics as ‘the extensive use of data, statistical and quantitative analysis, explanatory and predictive models, and fact based management to drive decisions and actions’.
Both the academic and practitioner-oriented literature is characterised by a strong focus on the opportunities that business analytics provides for organisations. Business analytics has various applications for more efficient and effective operations: marketing (Fan et al., 2015), production and manufacturing (Kohavi et al., 2002), finance (Acito and Khatri, 2014) human resources and research and development (Davenport and Harris, 2007; Hamm, 2009). Also, some studies indicate that business analytics has the capability to enhance organisational performance and effectiveness, and gain competitive advantages by enhancing the decision-making process (Chae et al., 2014; Chen et al., 2012; LaValle et al., 2011; Trkman et al., 2010). This process has been enhanced by the use of business analytics tools to help organisations find ways of achieving their goals more effectively or with fewer resources (Seddon et al., 2017). Business analytics initiatives enable businesses to draw meaningful insights from the growing volumes of data about transactions, products, inventories, customers and competitors generated by applications such as enterprise resource planning, customer relationship management, supply-chain management, knowledge management, collaborative computing and Web analytics (Lim et al., 2013).
In order to characterise business analytics by a simple taxonomy, Capgemini conducted a study to fully understand the multitude of factors related to making better and faster decisions (Ram and Delen, 2018). The study identified three main hierarchical but sometimes overlapping categories: descriptive, predictive, and prescriptive analytics (Delen, 2014). Descriptive analytics focuses on ‘what happened in the past and why’, while predictive analytics uses models to answer the question of ‘What will happen in future?’, and finally prescriptive analytics goes further to provide guidance by evaluating possible scenarios and answering ‘What course of action should we take?’. By applying these three levels of analytics, organisations gain the ability to understand the past, predict the future, and assess the possible trends more correctly (Ransbotham et al., 2015).
Business analytics is an emerging and fast-growing field (Skyrius et al., 2018) in both research and practice. A review of previous research in the field reveals an increasing rate and variety of published papers and extensive publicity regarding business analytics. This large amount of new information calls for a comprehensive and defined structure of business analytics knowledge and research. Despite the recent attention, business analytics is not fully understood and there are many incorrect, imprecise, and incomplete understandings of it (Watson, 2011). Therefore, building a systematic view of business analytics research to investigate knowledge structures, reveal hidden themes and identify emerging trends is essential.
For these purposes, some scholars have used different qualitative methods (Bayrak, 2015; Trieu, 2017) and quantitative ones (Liang and Liu, 2018; Moro et al., 2015). Qualitative methods like the systematic review of literature, instead of the traditional narrow, in-depth assessments, examine the relationships between topic areas and use some limited levels of quantification to sum up a large amount of information (Porter et al., 2002). However, because of the proliferation of textual information, it is difficult to analyse a large number of related documents and it requires enormous time and cost. Also, there are some difficulties in understanding topics in heterogeneous areas (Choi et al., 2017; Hull et al., 2008).
Therefore, some researchers have used quantitative methods such as data mining to analyse texts and examine knowledge structure (Barba-González et al., 2019), or topic modelling for topic discovery and semantic mining from unordered documents (Debortoli et al., 2016). Applying text mining analysis in the business analytics research field would provide a framework in which the researchers could easily understand trends and the importance of related issues. It also could be helpful for scientific conferences and journals at the time of call for papers, research funding agencies when planning the allocation of funds, and the public who like to know about current issues (Guo et al., 2011).
Furthermore, text mining provides better ways to visualise the concepts and structure of knowledge and hence, contributes toward understanding, planning for changes, and developing research (Linton, 2011). In this paper, text mining techniques have been applied to investigate, extract and visualise the semantic and intellectual structures of business analytics research and knowledge. These findings contribute to the understanding of using a data-driven method of analysis and text mining in this new and complex field of study. By providing an encyclopaedic and transparent structure of business analytics research literature, these findings will also improve the development of future research in the following ways: identifying and representing knowledge structure, recognizing hidden themes, detecting both older and emerging issues over time and modelling the topics of interest to the researchers.
Method
Since text mining has a mature technical basis in text classification, text clustering, automatic summarisation and association analysis (Glänzel and Thijs, 2017; Pang and Lee, 2008), it has been applied in this paper to obtain a more intuitive and comprehensive knowledge structure of business analytics. In this study, two text mining methods were used to analyse content from Scopus and Web of Science. Co-word analysis was used to calculate relationships among terms based on co-occurrence statistics, and topic modelling was used to identify the main topics based on the latent Dirichlet allocation model. The research approach is summarised in Figure 1.
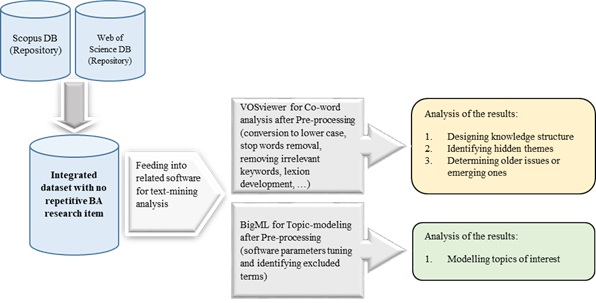
Figure 1: Research approach
Data collection and integration
In order to have a more comprehensive profile of business analytics, research documents from Scopus and Web of Science databases that include the term ‘business analytics’ in their title, abstract, or keywords without setting any search filters. We thus retrieved all English language papers containing ‘business analytics’ in their topic and published before the 15 September, 2018. After merging the retrieved items and removing the duplicates, 1,024 documents remained. These documents included papers, editorial material, literature reviews, book reviews, meeting abstracts and proceedings papers. The final documents have three different attributes (title, abstract, keywords), which were used for both co-word analysis and topic modelling.
Before doing the mining process, the 18,145 words of the 1,024 documents were prepared for text mining to present better results and make correct and coherent judgments. To clean the data in this study, we performed several pre-process steps including conversion to lower case, removal of stop words such as ‘of’ and ‘the’, stemming to reduce similar words to their roots to be counted as the same words (Miller, 2014; Weiss et al., 2015), removing irrelevant keywords with no semantic meaning, merging abbreviations and their full terms into popular forms and very long terms into more abbreviated forms, and standardising terms by converting British spellings to US English ones. After data preparation and software parameters tuning, final texts were fed into the mentioned models for analysis.
Data analysis
Text mining is a statistical and quantitative method used in the field of information science (Liang and Liu, 2018). Useful information can effectively be extracted from unstructured or semi-structured data sets, such as text documents, by using text mining, which is rooted in data mining technology (Zeng et al., 2012; Fan et al., 2006). Delen and Crossland (2008) proposed the application of text mining for analysing the literature and deriving novel information, such as associations, hypotheses, and identifying research trends, to help researchers in conducting state-of-the-art reviews on a research subject. In this study, text mining techniques including co-word analysis and topic modelling have been applied to published documents analyse the conceptual structure of the field, create a knowledge map and detect the different themes in the field of business analytics research.
Co-word analysis
A literature review of a set of articles is the starting point for researchers and enables them to analyse a given subject and identify trends of research and potential gaps that can lead to building new frameworks, enhanced insights and discoveries (Levy and Ellis, 2006). The relationships between the building blocks of literature can also be examined in what is called the ‘science of science’ (Goldsmith and Mackay, 1964, p. 518), reverting to bibliometrics to reveal the structure of knowledge in a specific field (Samiee and Chabowski, 2012).
Co-word analysis is based on two important assumptions: 1) the words used in the paper are good representatives for the reflection of its content and 2) the co-occurrence of the two words in various papers indicates their relation so that if the co-occurrence of the keywords is more, their relation is closer (Feng et al., 2017). Bibliometric maps based on co-word analyses, as in the current study, can serve as a forecasting tool by researchers to visualise different subfields and their relationships and thus detect future trends (Garfield, 1994).
Although many programs are available for analysing texts, VOSviewer’s purpose is to mine and visualise scientific texts (Van Eck and Waltman, 2010). VOSviewer uses text mining functions to identify related noun phrases, along with a clustering approach to examine the co-occurrence of the words. Interactive functionality of the software provides an accessible method for examining bibliometric data networks, such as citation counts and co-occurrence relationships between keywords (Van Eck and Waltman, 2011; Waltman et al., 2010). The co-occurrence map created by VOSviewer shows that the distance between two terms can be interpreted as an indication of the relatedness of the terms. VOSviewer applies a distance-based mapping technique referred to as visualisation of similarities (VOS), which improves multidimensional scaling (Boyack et al., 2005), by locating terms closer to their ideal coordinates on the map and by giving weight to indirect similarities (Van Eck and Waltman, 2007). Creating a term co-occurrence map in VOSviewer involves three steps: first, a similarity matrix is calculated based on the co-occurrence matrix using a probabilistic affinity index (Zitt et al., 2000) as the association strength (Van Eck et al., 2006). VOSviewer calculates the similarity S(i,j) between two terms i and j as:
S(i,j) = ci,j/wiwj (1)
where ci,j denotes the number of co-occurrences of term i and term j and wi ; wj signifies the total number of occurrences of terms i and j correspondingly. In the second step, the VOSviewer builds clusters based on a kind of weighted variant of modularity-based clustering (Newman and Girvan, 2004) and uses a unified framework for mapping and clustering (Van Eck and Waltman, 2010). By adding a smart local moving algorithm, it improves the accuracy (Waltman and Van Eck, 2013) and adjusts the number of clusters by tuning the resolution parameter γ in the modularity function (Yan et al., 2012). ti,j is the number of co-occurrence links between terms i and j (ti,j= tj,i≥0). Si,j represents the association strength of terms i and j (Van Eck and Waltman, 2009) and is given by:
Si,j = 2mti,j/titj (2)
where ti,j is the total number of links of term I and m denotes the total number of links,
ti = Σj≠itij and m = ½Σiti (3)
The main objective function in VOSviewer is to minimise a weighted sum of the squared Euclidean distances between all pairs of terms (Van Eck and Waltman, 2007).
V(x1, ... ,xn) = Σi<jsij ||xi — xj||2 (4)
The vector xi = (xi1, . . . , xim) ∈ Rm denotes the ith row of X and contains the coordinates of term i and ||•|| represents the Euclidean norm.
Finally, to obtain consistent results or simply always produce the same map, VOSviewer transforms the solution. It applies a translation in which the solution becomes centred at the origin. By using principal component analysis, it rotates the solution to maximise the variance on the horizontal dimension and it reflects the result based on the median value of the location of the terms. If the median is larger than 0, the solution is reflected in the vertical axis. If it is less than 0, the solution is reflected in the horizontal axis.
To fully understand how the VOSviewer software works and how it uses co-word analysis and association strength, the explanations provided by Van Eck and Waltman (2009); Van Eck and Waltman (2010); Waltman and Van Eck (2013) are recommended.
Topic modelling
Research topics can be extracted from scientific texts using text mining algorithms (Fang et al., 2018). Latent Dirichlet allocation, a popular technique for content analysis, is designed to organize massive volumes of documents based on topics (Teh et al., 2007). It can be an alternative approach for recognizing topics from any text corpus (McCallum, 2002). Although statistical validation of topic modelling is still under review (Chang et al., 2009; DiMaggio et al., 2013; Ramirez et al., 2012), it can be a valuable tool in any large scale content analysis project (Jacobi et al., 2016).
Lancichinetti et al. (2015) indicated that a latent Dirichlet allocation model based on network approach could be used for topic analysis to determine the optimum amount of topics. The topic modelling technique, through statistical and probabilistic modelling, attempts to discover hidden topics in an unstructured text corpus and model detected topics with the Bayesian probabilistic network. This technique assumes that each document is a probable distribution of the number of topics that are fixed and predefined, while each topic is a possible distribution of words (Blei et al., 2010; Blei et al., 2003; Griffiths and Steyvers, 2004; Kinsman et al., 2010). Blei et al. (2003) argued that in Latent Dirichlet Allocation, which is a three-level Bayesian hierarchical model, each item is modelled as a finite mixture over the underlying set of topics. As an unsupervised generative probabilistic method, it assumes that each document can be represented as a probabilistic distribution over latent topics, and that topic distribution in all documents share a common Dirichlet prior (Jelodar et al. 2017). It can be thought of as a model that tries to find a combination of topics for each document. For example, P(z | d) stands for each topic described by terms following another probability distribution, e.g., P(t | z). This can be formalised as
P(ti|d) = Σzj=1P(ti|zi = j)P(zi = j|d) (5)
where P(ti | d) denotes the probability of the ith term in a given document d and zi is the latent topic. P(ti | zi = j) is the probability of ti within topic j. P(zi = j | d) is the probability of picking a term from topic j in the document. The number of latent topics Z has to be defined in advance and can be adjusted to suit the degree of specialisation of the latent topics.
Jacobi et al. (2016) concluded that researchers should examine the topics produced in the model manually to decide whether they can be interpreted and in what specific document and at what period they took place.
In order to identify and model business analytics topics, BigML was adopted. BigML is a machine learning platform that provides sophisticated tools for statistical natural language processing and uses efficient approaches for topic hyper-parameter optimisation and tools inferring topics of documents using the trained models.
Analysis and results
Co-word analysis network
Figure 2 shows a co-word analysis network of high-frequency keywords related to business analytics research, illustrating how common business analytics knowledge domains are related to each other. Business analytics is at the middle of the map because it is the search term for retrieving the documents. This network contains 146 keywords with at least fifteen frequencies in our dataset. After some experimenting, we decided to set the resolution parameter γ equal to 2. This yielded three clusters of the total 1,024 keywords: red (fifty unique keywords), green (forty-nine unique keywords) and blue (forty-seven unique keywords). Important keywords are marked with a larger font, and each word is marked with the colour of the cluster to which it belongs.
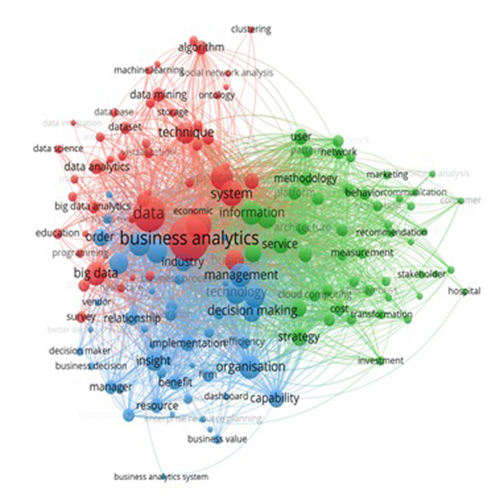
Figure 2: Network visualisation
Based on the text analysis, twenty of the most relevant repetitive words with a minimum frequency rate of 131 are shown in Table 1.
| Cluster 1 (red) | Cluster 2 (green) | Cluster 3 (blue) | |||
|---|---|---|---|---|---|
| Keyword | Frequency | Keyword | Frequency | Keyword | Frequency |
| Business analytics | 735 | Information | 209 | Organisation | 210 |
| Data | 480 | Modelling | 173 | Management | 209 |
| Analytics | 302 | Knowledge | 131 | Tool | 204 |
| System | 248 | Processing | 197 | ||
| Application | 229 | Technology | 197 | ||
| Big data | 191 | Performance | 185 | ||
| Business | 172 | Decision making | 175 | ||
| Technique | 163 | Business intelligence | 171 | ||
| Insight | 145 | ||||
Cluster 1: analytical methods
Most of the keywords in cluster 1 (coloured red in Figure 2) are related to analytical methods such as technical approaches, tools and data analysis. Terms such as data mining, text-mining, algorithms, statistics, machine learning, social network analysis and programming in this cluster show the use of data mining, statistical tools and techniques for analysing data. We thus labelled the first sub-cluster as ‘data analytics tool and techniques’. Social network analysis refers to analysing social networks based on how the graph nodes are connected or unconnected to other nodes through various links (Borgatti et al., 2018). Programming encompasses data analysis tools, including two types of linear programming and integer programming.
Keywords such as data integration, classification, pictive analytics, trends, optimisation, visualisation, forecasting, and clustering are grouped into ‘data analytics tasks’ sub-cluster. By using data analysis techniques such as clustering, regression and classification, patterns between huge volumes of data can be detected and these patterns can be used for future predictions and optimisation. The application of optimisation methods is not exclusively limited to the business purpose, as it is reported to be effective in humanitarian movements and for altruistic purposes as well (Hajiheydari et al., 2018). Clustering is not only used as a dimension reduction tool when a data set has hundreds of attributes but has also been used for unsupervised categorisation. Keywords such as dataset, database, data warehouse, Internet and Web form a ‘data analytics infrastructures’ sub-cluster.
In summary, cluster 1 represents what business analytics is, the main tools and techniques for collecting and storing data, and how data can be analysed to extract knowledge, discover hidden patterns to predict future behaviour, and optimise decisions.
Cluster 2: business analytics in practice
Cluster 2 (coloured green in Figure 2) contains keywords related to the different domains and functions of business analytics. Generally, this cluster contains different domains and functions of business analytics in five groups: information technology, marketing, strategic management, behavioural analytics and health. Terms such as hospital and patient represent the use of business analytics in the health sector, which produces massive amounts of data that can be analysed to inform diagnoses and prescribing medication. Algorithms can also prevent human errors, help to avoid misdiagnosis, drug interactions and incorrect dosages. Business analytics can help healthcare organisations in using available data to enhance clinical operations, better examining the performance, pattern recognition, and disease prediction.
Other terms such as service, customer, consumer and marketplace indicate the application of business analytics in customer management and marketing. Looking more closely, important terms such as cloud computing, platform, social network and information system represent business analytics functions in the field of information technology. Again, the presence of words such as sentiment analysis, recommendation and social network in this cluster is associated with using sentiment analysis as one of the data mining tools in social networks to extract valuable insights. Data mining has proven its capabilities in understanding users’ behaviour in different domains and especially in social networks (Sharifian et al., 2017). Other related terms in this cluster such as behaviour, knowledge, learning, perspective, interaction and pattern are grouped into the behavioural analytics sub-cluster. Increased consumers’ behavioural data from sensors and other sources such as the Internet of Things leads to better policy pricing and risk assessment. Recent research reports on business analytics techniques’ ability to harness and extract hidden knowledge from big data generated through sensors for creating business value in different industries (Hajiheydari et al., 2019).
Cluster 3: business analytics expected value
Keywords in the cluster 3 (coloured blue in Figure 2) are associated with the values, contributions and benefits of business analytics. One of the hidden themes of this cluster is related to the ‘consequences’ of business analytics, which is distinguished from the terms such as decision support system, business intelligence, better decision-making, insight, efficiency and productivity. The decision support system area remains important, as such systems are essential in providing information for the decision-making process. Terms related to the ‘impact’ of business analytics in the fields of operations, logistics and supply chains, such as planning, decision making, supply chain, business performance, business value and business user form another sub-cluster. Words such as business analytics system, enterprise resource planning and dashboard form a sub-cluster related to ‘business analytics implementation’. Overall, the semantic structure of business analytics studies associated with its organisational capabilities is modelled in this cluster. Keywords are related to types of research that investigate how to use business analytics to create value and gain competitive advantages.
The main themes of business analytics and their sub-clusters can be seen in Table 2. There are some overlaps in these clusters and they do not have completely distinct boundaries.
| Cluster 1: Analytical methods | |
|---|---|
| Data analytics tools and techniques (Sub-cluster 1) | algorithms, data mining, machine learning, programming, social network analysis, statistics, text mining, business analytics, analytics, technique |
| Data analytics tasks (Sub-cluster 2) | classification, clustering, data integration, forecasting, optimisation, predictive analytics, predictive modelling, reporting, trend, visualisation, big data analytics, data analytics, survey, conceptual modelling |
| Data analytics infrastructure (Sub-cluster 3) | data base, data warehouse, dataset, internet, machine, source, system, storage, data, application, big data, web, unstructured data |
| Cluster 2: Business analytics in practice | |
| Information technology implementation (Sub-cluster 1) | cloud computing, information system, platform, recommendation, sentiment analysis, simulation, social network, software, information, knowledge, enterprise application, standardisation, communication, knowledge management, Information technology, intelligence, architecture, user, modeling |
| Marketing (Sub-cluster 2) | consumer, customer, marketplace, service, marketing |
| Strategic management (Sub-cluster 3) | business model, collaboration, exploration, innovation, stakeholder, sustainability, risk, decision support, investment, evaluation, measurement, effectiveness, cost, strategy |
| Behavioural analytics (Sub-cluster 4) | behaviour, knowledge, learning, perspective, interaction, pattern |
| Health (Sub-cluster 5) | hospital, patient |
| Cluster 3: Business analytics expected value | |
| Business analytics consequences (Sub-cluster 1) | better decision making, business intelligence, competitive advantage, decision support system, efficiency, insight, productivity, benefit, advantage |
| Business analytics impact (Sub-cluster 2) | business decision, business performance, business process, business user, business value, decision making, operation, performance, planning, supply chain, industry, order, decision maker, vendor, supply chain management |
| Business analytics implementation (Sub-cluster 3) | analytics tool, business analytics system, dashboard, enterprise resource planning, resource, technology, tool, processing, integration, design methodology approach, execution, deployment, business analytics application |
By examining Figure 2 from another point of view, it can also be deduced that other relationships between keywords also exist, regardless of the clusters they belong to, as the shorter the distance between two words, the greater their co-occurrences. In this paper, there is not enough space to examine all or even most of these co-occurrences, therefore, only some examples are mentioned below.
The words such as storage, data mining and technique are adjacent, perhaps because mining massive amounts of data necessitates looking for new storage methods and techniques. However, there may be other connections between these words, and their co-examination may yield valuable new research opportunities. Keywords like education, data analytics, large data analytics, and data science are near to each other in the network, maybe reflecting the importance of data science in the big data era. The proximity of other network nodes such as technology, decision making and management is related to the use of business analytics technology in management decisions. Keywords such as organisation, firm, benefit, dashboard and business value point to the application of management dashboards to create more value and competitive advantage for organisations in the decision-making process. It is discussed that managers with different styles of decision-making use business intelligence capacities in their own ways to make managerial decisions (Mohammadi and Hajiheydari, 2012).
Innovation and gaining a competitive advantage in today's digital world is mainly achievable by collecting, storing, processing, and analysing big data for extracting knowledge, algorithm and insight. This explains the high repetition of the term data and the close relationship between business analytics tools and data in the co-word analysis network. Moreover, the word China in the red cluster might indicate high use of analytics in this country or more cases in China rather than the other countries.
Co-word analysis network considering timestamp
Using the ‘overlay visualisation’ tab in VOSviewer software, the main topics of recent research in business analytics field, the rising and fading trends were identified. It was thereby possible to see what clusters are among the most recent topics in business analytics, and which are less current. In the cluster 1 (red in Figure 2), terms such as data science, big data analytics, big data, analytics, predictive analytic and machine learning are among the most recent topics in business analytics research. Compared with clusters 2 (green) and 3 (blue), cluster 1 contains newer issues in this field. Data science and big data analytics are two topics that have emerged as trends since mid-2016. Machine learning is another trending topic which has appeared since mid-2015. It appears, along with the terms algorithm and social network analysis, near the word data mining, which means that more recent data mining techniques have used machine learning algorithms, specifically in social network analytics. The timing frame also shows that business analytics has been used in healthcare, economics and businesses to generate value and gain competitive advantage since around 2015, and for reporting and forecasting since 2013.
Cluster 2 (green) has the oldest issues compared to other two clusters, and includes keywords such as information system, management, knowledge management and enterprise resource planning. However, collaboration, effectiveness and productivity are some newer concepts that represent a more recent tendency in business analytics research. The terms social network and behaviour also represent other recent topics, which appear beginning in mid-2015. This emphasises the business analytics applicability in gaining insights from customer behaviour and analysing social networks. Risk analysis has been a trend since 2015, and sentiment analysis has been used in marketing since mid-2014.
In cluster 3 (blue), predictive modelling, supply chain, supply chain management and operation are the most recent topics. It can be concluded that this cluster represents the trends of using business analytics to develop dashboards to acquire perspective, knowledge and insights for better decision making. Managerial dashboards are now in place as efficient data visualisation tools that display the status of key performance indicators, business analytics metrics, and important data points for an organisation, department, and their objectives. Business analytics has been further used in marketplace and supply chain operations since 2015, while preliminary applications such as business analytics systems and applications and enterprise resource planning have been present since 2012.
Topic modelling
Topic modelling as an automated method for content analysis uses statistical algorithms to analyse words of a textual collection and generate a representation of the latent topics discussed in the documents and thereby organize and summarise the corpus (Blei et al., 2003). Each instance of the dataset is a document and the input fields for each row are the terms in the document that converted to a bag of words. Latent Dirichlet Allocation represents topics by word probabilities and estimates the topic–term distribution and the document–topic distribution from the corpus of documents using Dirichlet priors for the distributions and a fixed number of topics. Various methods have been proposed to estimate these parameters (Jelodar et al., 2017). In this study, we used the BigML variational Expectation-Maximisation (EM) algorithm based on the method for parameter estimation proposed by Blei et al. (2003). The goal of this algorithm is to find parameters, which maximise the likelihood when the data model depends on certain latent variables.
Seventeen topics were identified by setting various parameters of the BigML topic model several times, examining the results of each repetition, and then deciding on the appropriate excluded terms. Figure 4 shows this topic modelling, and the terms that appeared in each topic are shown in Table 3.
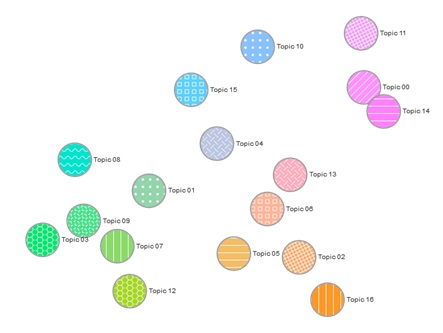
Figure 3: Topic model
The distance between the topics (circles in Figure 4) indicates the semantic relevance of the topics. When at least two of the topics are placed in proximity, it means that they contain relevant words and/or have appeared in more related documents concurrently. Placement of each word in each topic is ordered based on the probability of the existence of a word in the topic.
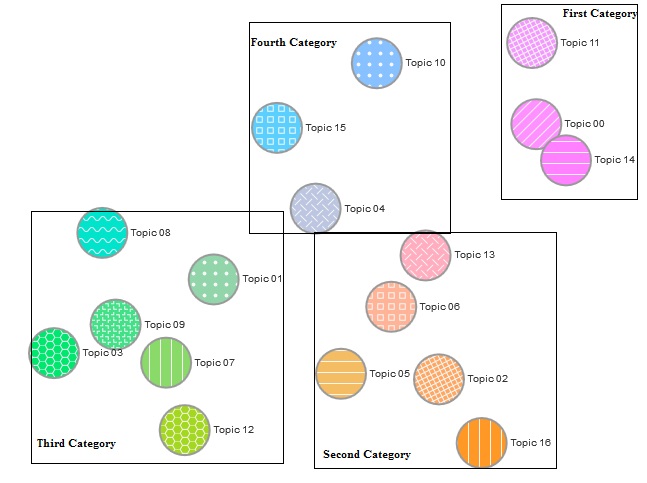
It is worthwhile noting that the titles of the topics have been named not only based on the criteria of the most likely word appearing in the topic, but also by the subjective judgment of the authors. Identified topics (Figure 3) can be divided into four general clusters (shown in Figure 4) based on the colours, distances between them and their locations in the map. Considering the main words in each topic and the connections between the topics in each cluster, some grouping can be implemented and new findings are obtained (Table 3).
| Topic no. | Major terms | Underlying theme |
|---|---|---|
| First category | ||
| Topic 11 | social networks, network analysis, social network analysis, feature selection, service providers, churn prediction, support vector machine, Bayesian networks | Social network analysis Healthcare analytics Customer analytics |
| Topic 00 | social media, software development, social networks, system development, topics include, healthcare organisations, sentiment analysis, project management | |
| Topic 14 | social media, data science, sentiment analysis, social media analytics, media analytics, health care, healthcare contexts, clinical decision | |
| Second category | ||
| Topic 13 | business process, conceptual modelling, analytics systems, process model, analytics capabilities, business analytics systems, data processing, business analytics capabilities | Business analytics business values Supply chain and operation analytics Business process analytics |
| Topic 06 | process management, business process management, balanced scorecard, learning analytics, advanced analytics, operational efficiency, cost effectiveness, study examines | |
| Topic 05 | supply chain, supply chain management, predictive analytics, supply chain performance, supply chain analytics, human resources, driven decision, human resources analytics | |
| Topic 02 | text mining, analytics programs, decision sciences, business analytics programs, regression models, logistic regression, management systems, genetic algorithm | |
| Topic 16 | competitive advantage, performance management, data quality, business models, organisational performance, quality management, firm performance, dynamic capabilities | |
| Third category | ||
| Topic 12 | data mining, data analysis, machine learning, predictive modelling, knowledge discovery, association rules, dynamic data analysis, support vector machine | Business analytic process Big data analytics Business analytics infrastructure |
| Topic 07 | unstructured data, big data analytics applications, business analytics applications, regular expression, cloud computing, strategic management, enterprise applications, physical visualisation | |
| Topic 03 | data warehouse, data management, data model, data integration, data warehousing, Web services, data sources, semantic Web | |
| Topic 09 | decision makers, data sets, decision tree, risk management, decision support systems, cloud computing, neural network, sensitivity analysis | |
| Topic 01 | business performance, maturity model, administrative office, healthcare processes, sensor data, performance indicators, proposed model, dynamic pricing | |
| Topic 08 | business decisions, analytics tools, prescriptive analytics, customer relationship, resource planning, enterprise resource, business analytics tools, enterprise resource planning | |
| Fourth category | ||
| Topic 0 | data visualisation, visual analytics, stock market, digital technologies, business data, performance dashboard, complex data, analytics techniques | Business Intelligence Knowledge management |
| Topic 15 | business intelligence, enterprise architecture, operational data, intelligence systems, decision support systems, support decision, virtual organisations, business intelligence systems | |
| Topic 10 | data analytics, knowledge management, analytics service, competitive intelligence, business strategy, economic analysis, data scientists, data business analytics | |
The first theme: social networks, healthcare and customer analytics
The first category is the purple one (upper right corner of Figure 5) that includes topics 11, 00 and 14. Major topics in this section are: social networks, social media and data science. The theme of this section is the application of business analytics on social networks analytics. By using social network analysis, sentiment analysis and other analytical techniques, the structures of the social networks are identified and their users’ expressed opinions are investigated (e.g., businesses can recognise their customers’ brand attitude).
This section provides mixed support for the applications of machine learning and data science such as churn prediction, support vector machine and Bayesian networks. Churn prediction is one of the business analytics applications, which is helpful for market analysis and customer relationship management in industries such as banking (Cheng et al., 2019). It also is used for customer retention management as shown by Ascarza et al., 2018. Support vector machine is a supervised learning model used to analyse data used for classification and regression analysis by associated learning algorithms. For example it is used with logistic regression by Kumar et al., (2018) for anomaly detection in user posts and online reviews. Bayesian network, as a probabilistic statistical and graphical model, represents the conditional dependencies between model variables (Srihari, 2014). For instance, it can be used in the healthcare sector for diagnostics issues (Pinheiro et al., 2018), and making decisions under uncertainties.
The topics like healthcare organisation, health care, healthcare contexts and clinical decision illustrate the relationship between the health sector and business analytics. They may refer to the area of health care analytics based on the huge amount of data produced and the importance of accurate analysis. Therefore, new business analytics solutions are expected to extract hidden insights in the healthcare area.
The second theme: supply chain, operations, and business values analytics
The second category examined in this section is the orange one (bottom right corner of Figure 5), which contains topics 13, 06, 05, 02 and 16. The focus of this section is business processes, competitive advantage, supply chain and relevant data mining tools. Terms such as text mining, regression models, logistic regression, genetic algorithm and predictive analytics are clustered. Regression models, logistic regression and genetic algorithm are used for predictive analytics, including market research estimations. Genetic algorithms are heuristic search methods, and regression models (linear or nonlinear statistical procedure) examine and describe the relationships of variables. Regression models can adopt genetic algorithms for parameter estimation and selection of relevant features of big datasets to enhance the decision-making process and performance. These relationships are also proved in the work of other researchers (Paterlini and Minerva, 2010; Iqbal et al., 2013; Zhang et al., 2015).
The main theme of this section is the semantic structure of business analytics research in supply chain management to create a competitive advantage. Business analytics and genetic algorithms can be used to evaluate the material and goods flows and managing the supply chains. These types of applications are studied by Mahajan, Garg and Sharma, 2014; and Min, 2015. Business analytics can result in more efficient and effective operations by optimizing value and supply chains, setting the most profitable price for products and services, selecting the right people for certain tasks and jobs, minimizing wastes and quality problems and improving customer relationships (Chen et al., 2012; McAfee and Brynjolfsson, 2012) and all of these benefits are possible by logically analysing the related data.
Terms such as decision science, management system, data driven decision, process management, business process management, balanced scorecard, operational efficiency, cost effectiveness, business process, process model, competitive advantage, performance management and organisational performance point to the important role of business analytics in an efficient decision making and gaining competitiveness. Data strategy enables data-driven decision making using technology and applications that help a business achieves its strategic imperatives. The balanced scorecard also is a strategic planning and management system that helps organisations to easily communicate what they are trying to accomplish and measure and monitor the progress towards strategic targets. It could be strongly rooted in organisational performance data, business processes’ data and performance targets, and be a strong base for managerial decision-making, as well as trend analysis.
The third theme: big data and business analytics infrastructure
The third category is the green section (bottom left corner of Figure 5), containing topics 12, 07, 03, 09, 01and 08. The main focus of the topics in this section is data sets, data warehouse, data mining and data analytics, and thereupon it is perceived that the core of this section is related to data collection, data storage, data integration, data analysis and knowledge extraction.
This segment also refers to solutions and tools such as cloud computing, physical visualisation, decision tree, neural network, sensitivity analysis, data mining, association rules, support vector machines (SVM) and machine learning all representing trending terms. Physical visualisation is one of the earliest kinds of data visualisations techniques, while cloud computing is a new way of storing unlimited amounts of big data, and provides different levels of services such as Open Data Framework, analytics and visualisation. The related concepts are studied by Ashariet al., 2016; Khan et al., 2017; Lnenicka and Komarkova, 2015; and Yang et al., 2017. Big data can be mined through algorithms such as association rules or decision trees. Association rules explore big data for common patterns and use criteria support and confidence for recognizing the most important relationships in big data. Used in classification and regression models, decision trees (a nonparametric supervised learning algorithm) provide a framework to measure values of consequences and probabilities of achieving them. In neural network models, clustering is usually done before data mining, then these clusters are used as inputs. For interpreting neural network models, sensitivity analysis is applied for translating the weights into a compact set of decision rules. These issues are widely discussed by Larose, 2005.
The terms enterprise resource planning and decision support systems represent the semantic structure of business analytics research related to the applications of business analytics in businesses. Due to the increasing value and volume of organisations’ data resources, business analytics has adopted enterprise capability instead of narrow decision support applications.
The fourth theme: business intelligence and knowledge analytics
The fourth and the final category is the blue one (centre of the image and the top corner) comprising topics 04, 15 and 10. This section is actively linking data analytics and business intelligence and knowledge management issues. Business intelligence uses techniques and technologies which use a consistent set of metrics for measuring past performance to guide business planning. Loshin (2012, p. 6) defines it as ‘the processes, technologies and tools needed to turn data into information, information into knowledge, and knowledge into plans that drive profitable business actions’. Business intelligence and business analytics are the optimal use of data analytics tools to provide a better understanding of the competitive landscape of the market (Lim et al., 2013). Topic 10, which encompasses the highly frequent keyword, has a similar semantic structure to topic 12 (from the previous category), which contains a high frequency of data mining and data analytics. A detailed look at the keywords which appeared in this category revealed that the topics of this category are in association with the subjects of the previous categories, and their intersection is obvious.
Conclusion
The aim of this computational literature analysis was to identify the knowledge structure, review the main and influential trends and reveal hidden themes in the field of business analytics research. Text mining methods including co-word analysis and topic modelling were used to analyse published documents in the Scopus and Web of Science databases. This study investigated the semantic structure of business analytics by analysing 1,024 related research documents published up until 15 September 2018. A large number of collected documents makes the text mining an appropriate method for a thorough assessment of the literature. In traditional review methods, approximately thirty to 150 papers (Cosic et al., 2015; Rikhardsson and Yigitbasioglu, 2018) are studied by qualitative methods, whereas the method in this paper uses a rigorous quantitative analysis of all related published documents indexed in two important scientific databases.
The map of the co-occurrence terms and extracted business analytics themes show that, although the research interest in business analytics is relatively contemporary, the studied subjects cover a wide variety of knowledge areas. Our findings indicate that the knowledge structure of business analytics mainly consists of three themes, each with subcategories: analytical methods, business Analytics in practice and business analytics value creation. Examining the publication date associated with the keywords in the co-word analysis network showed that topics related to big data analytics, machine learning and data science have become more popular.
Using latent Dirichlet allocation, seventeen topics were identified that could be clustered in four different areas: social networks analytics, especially in the health and customer retention sectors; applying predictive models such as logistic regressions and genetic algorithms in business and supply chain management; big data analytics; and data visualisation, dashboards, and knowledge management.
This research has a few constraints, as it is limited to two databases, Scopus and Web of Science. The analysis also is limited to using only abstract, title and author keyword searches of retrieved documents and may not be capable of extracting very deep knowledge of the specified context.
As the business analytics knowledge area is in its infancy stage, the keywords used in related studies are not yet standardised. Therefore, for a more complete understanding of this new area, researchers and practitioners might use search terms such as business intelligence and analy*, business analy*, big data analy*, data analy* and data mining without caring about the uppercase or lowercase or the spaces within the terms retrieving documents from various databases as they may be used interchangeably by our search term, ‘business analytics’. Considerably more could be done with this type of data, including a deeper analysis of the co-words’ characteristics in the field, such as in which areas they related and why they become popular or obsolete. Future studies can use complementary bibliometric techniques (e.g., co-citation analysis, co-author analysis and bibliographic coupling) to give special attention to authors who provide links between the major knowledge groups would also be of interest, such as the kinds of work these links represent and the questions they address.
About the authors
Dr Mohammad Soltani Delgosha is a Senior Lecturer in business and information systems, University of the West of England, Business School, UK. His research is concentrated on digital innovation and his executive background in digital platform business drives his recent studies on multisided markets. His contact address is mohammad.soltanidelgosha@uwe.ac.uk
Dr Nastaran Hajiheydari (Corresponding Author) is a University Teacher in Information and Operations Management at Sheffield University Management School. Her research focuses on ‘Digitalisation and Business Issues of Emerging Technologies’, with a concentration on strategic business value. She can be contacted at n.hajiheydari@sheffield.ac.uk
Ms Hamideh Saadatmanesh has an Executive Master's degree in business administration from the University of Isfahan, and a background in software engineering. Her principal research interest in business analytics, which she intends to pursue intensively. She can be contacted at hamideh.saadatmanesh@alumni.ut.ac.ir
References
Note: A link from the title is to an open access document. A link from the DOI is to the publisher's page for the document.
- Acito, F., & Khatri, V. (2014). Business analytics: why now and what next? Business Horizons, 57(5), 565–570. https://doi.org/10.1016/j.bushor.2014.06.001
- Ascarza, E., Neslin, S. A., Netzer, O., Anderson, Z., Fader, P. S., Gupta, S., Hardie, B. G. S., Lemmens, A., Libai, B., Neal, D., Provost, F., & Schrift, R. (2018). In pursuit of enhanced customer retention management: review, key issues, and future directions. Customer Needs and Solutions, 5 (1–2), 65–81. https://doi.org/10.1007/s40547-017-0080-0
- Ashari, A., Tjoa, A. M., & Riasetiawan, M. (2016). Cloud-based processing for data science visualisation. International Journal of Advanced Computer Science and Applications, 7(2), 449–454. https://doi.org/10.14569/IJACSA.2016.070260 (https://bit.ly/2zPcMgo - Archived by the Internet Archive at https://bit.ly/2ylUbs4
- Barba-González, C., García-Nieto, J., del Mar Roldán-García, M., Navas-Delgado, I., Nebro, A. J., & Aldana-Montes, J. F. (2019). BIGOWL: knowledge centered big data analytics. Expert Systems with Applications, 115, 543–556. https://doi.org/10.1016/j.eswa.2018.08.026
- Bayrak, T. (2015). A review of business analytics: a business enabler or another passing fad. Procedia-Social and Behavioral Sciences, 195, 230–239. https://doi.org/10.1016/j.sbspro.2015.06.354
- Blei, D. M., Ng, A. Y., & Jordan, M. I. (2003). Latent Dirichlet allocation. Journal of Machine Learning Research, 3, 993–1022. http://www.jmlr.org/papers/volume3/blei03a/blei03a.pdf (Archived by the Internet Archive at https://bit.ly/2ZkKGEo)
- Blei, D., Carin, L., & Dunson, D. (2010). Probabilistic Topic Models: A focus on graphical model design and applications to document and image analysis. IEEE Signal Process Magazine, 27(6), 55–65. https://doi.org/10.1109/MSP.2010.938079.
- Borgatti, S. P., Everett, M. G., & Johnson, J. C. (2018). Analyzing social networks. Sage Publications.
- Boyack, K. W., Klavans, R., & Borner, K. (2005). Mapping the backbone of science. Scientometrics, 64(3), 351–374. https://doi.org/10.1007/s11192-005-0255-6
- Chae, B. K., Yang, C., Olson, D., & Sheu, C. (2014). The impact of advanced analytics and data accuracy on operational performance: a contingent resource based theory (RBT) perspective. Decision Support Systems, 59, 119–126. https://doi.org/10.1016/j.dss.2013.10.012
- Chang, J., Gerrish, S., Wang, C., Boyd-Graber, J. L., & Blei, D. M. (2009). Reading tea leaves: how humans interpret topic models. In Y. Bengio, D. Schuurmans, J.D. Lafferty, C.K.I. Williams, & A. Culotta. Advances in Neural Information Processing Systems 22 (NIPS 2009) (9 p.). Neural Information Processing Systems Foundation, Inc. http://papers.nips.cc/paper/3700-reading-tea-leaves-how-humans-interpret-topic-models.pdf Archived by the Internet Archive at https://bit.ly/3cY5bKY
- Chen, H., Chiang, R. H., & Storey, V. C. (2012). Business intelligence and analytics: from big data to big impact. MIS quarterly, 36(4). 1165-1188. https://doi.org/10.2307/41703503
- Cheng, L. C., Wu, C.-C., & Chen, C.-Y. (2019). Behavior analysis of customer churn for a customer relationship system: an empirical case study. Journal of Global Information Management (JGIM), 27(1), 111–127. https://doi.org/10.4018/JGIM.2019010106
- Choi, H.S., Lee, W.S., &Sohn, S.Y.(2017). Analyzing research trends in personal information privacy using topic modeling. Computer and Security, 67, 244–253. https://doi.org/10.1016/j.cose.2017.03.007
- Cosic, R., Shanks, G., & Maynard, S. (2012). Towards a business analytics capability maturity model. In ACIS 2012: Location, Location, Location: Proceedings of the 23rd Australasian Conference on Information Systems Geelong, Victoria, Australia, 3-5 December, 2012. (11 p.) Association for Information Systems. https://aisel.aisnet.org/cgi/viewcontent.cgi?article=1013&context=acis2012 (Archived by the Internet Archive at https://bit.ly/36fe1BR)
- Cosic, R., Shanks, G., & Maynard, S. B. (2015). A business analytics capability framework. Australasian Journal of Information Systems, 19, S5-S19. https://doi.org/10.3127/ajis.v19i0.1150 (Archived by the Internet Archive at https://bit.ly/2XgvWDQ)
- Davenport, T., & Harris, J. (2007). Competing on analytics: the new science of winning. Harvard Business School Press
- Debortoli, S., Müller, O., Junglas, I., &Vom Brocke, J. (2016). Text mining for information systems researchers: an annotated topic modeling tutorial. Communications of the Association for Information Systems. 39, 110–135. https://doi.org/10.17705/1CAIS.03907
- Delen, D. & Crossland, M.D. (2008). Seeding the survey and analysis of research literature with text mining. Expert Systems with Applications, 34(3), 1707–1720. https://doi.org/10.1016/j.eswa.2007.01.035
- Delen, D. (2014). Real-world data mining: applied business analytics and decision making. FT Press.
- DiMaggio, P., Nag, M., & Blei, D. (2013). Exploiting affinities between topic modeling and the sociological perspective on culture: application to newspaper coverage of US government arts funding. Poetics, 41(6), 570–606. https://doi.org/10.1016/j.poetic.2013.08.004
- Fan, W., Wallace, L., Rich, S. & Zhang, Z. (2006). Tapping the power of text mining. Communications of the ACM, 49(9), 77–82. https://doi.org/10.1145/1151030.1151032
- Fan, S., Lau, R.Y., &Zhao, J.L.(2015). Demystifying big data analytics for business intelligence through the lens of marketing mix. Big Data Research, 2, 28–32. https://doi.org/10.1016/j.bdr.2015.02.006
- Fang, D., Yang, H., Gao, B., & Li, X. (2018). Discovering research topics from library electronic references using latent Dirichlet allocation. Library Hi Tech, 36(3), 400–410. https://doi.org/10.1108/LHT-06-2017-0132
- Feng, J., Zhang, Y. Q., & Zhang, H. (2017). Improving the co-word analysis method based on semantic distance. Scientometrics, 111(3), 1521–1531. https://doi.org/10.1007/s11192-017-2286-1
- Garfield, E. (1994). Scientography: mapping the tracks of science. Current Contents: Social & Behavioural Sciences, 7(45), 5–10. https://clarivate.com/webofsciencegroup/essays/scientography-mapping-the-tracks-of-science/ (Archived by the Internet Archive at https://bit.ly/3cQWAtG)
- Glänzel, W., & Thijs, B. (2017). Using hybrid methods and ‘core documents’ for the representation of clusters and topics: the astronomy dataset. Scientometrics, 111(2), 1071–1087. https://doi.org/10.1007/s11192-017-2301-6
- Griffiths, T. L., & Steyvers, M. (2004). Finding scientific topics. Proceedings of the National Academy of Sciences, 101(Suppl. 1), 5228–5235. https://doi.org/10.1073/pnas.0307752101
- Goldsmith, M. & McKay, A., (1964). The science of science. Penguin Books.
- Guo, H., Weingart, S., & Börner, K. (2011). Mixed-indicators model for identifying emerging research areas. Scientometrics, 89(1), 421–435. https://doi.org/10.1007/s11192-011-0433-7
- Hajiheydari, N., Salehi, M., & Goudarzi, A. (2018). Optimizing humanitarian aids: formulating influencer advertisement in social networks. In L. Camarinha-Matos, H. Afsarmanesh, & Y. Rezgui, (Eds.)/ Proceedings, Collaborative Networks of Cognitive Systems. PRO-VE 2018. Cardiff, UK, September 17-19, 2018 (pp. 101-110). Springer. https://doi.org/10.1007/978-3-319-99127-6_9
- Hajiheydari, N., Talafidaryani, M., & Khabiri, S. (2019). IoT big data value map: how to generate value from IoT data. In ICSLT 2019: Proceedings of the 2019 the 5th International Conference on e-Society, e-Learning and e-Technologies, Vienna, Austria, January 2019. (pp. 98-103). https://doi.org/10.1145/3312714.3312728
- Hamm, S. (2009, April 14). IBM roars into business consulting. Bloomberg. https://bit.ly/2ZktDCk.
- Holsapple, C., Lee-Post, A., & Pakath, R. (2014). A unified foundation for business analytics. Decision Support Systems, 64, 130–141. https://doi.org/10.1016/j.dss.2014.05.013
- Hull, D., Pettifer, S. R., & Kell, D. B. (2008). Defrosting the digital library: bibliographic tools for the next generation Web. PLoS Computational Biology, 4(10), e1000204. https://dx.doi.org/10.1371%2Fjournal.pcbi.1000204
- Iqbal, R., Azmi Murad, M.A., Mustapha, A., Panahy, S., Hassany, P., Khanahmadliravi, N. (2013). An experimental study of classification algorithms for crime prediction. Indian Journal of Science & Technology 6(3), Article 8. https://bit.ly/3dUM7h0 (Archived by the Internet Archive at https://bit.ly/2X9x3oW)
- Jacobi, C., Van Atteveldt, W., & Welbers, K. (2016). Quantitative analysis of large amounts of journalistic texts using topic modelling. Digital Journalism, 4(1), 89–106. https://doi.org/10.1080/21670811.2015.1093271
- Jelodar, H., Wang, Y., Yuan, C., & Feng, X. (2017). Latent Dirichlet allocation (LDA) and topic modeling: models, applications, a survey. Multimedia Tools and Applications, 78, 15169–15211. https://doi.org/10.1007/s11042-018-6894-4
- Khan, S., Shakil, K. A., & Alam, M. (2017). Big data computing using cloud-based technologies, challenges and future perspectives. arXiv. https://arxiv.org/pdf/1712.05233.pdf
- Kinsman, L., Rotter, T., James, E., Snow, P., & Willis, J. (2010). What is a clinical pathway? Development of a definition to inform the debate. BMC medicine, 8(1), Article 31. https://doi.org/10.1186/1741-7015-8-31
- Kohavi, R., Rothleder, N. J., & Simoudis, E. (2002). Emerging trends in business analytics. Communications of the ACM, 45(8), 45–48. https://dl.acm.org/doi/fullHtml/10.1145/545151.545177
- Kumar, N., Venugopal, D., Qiu, L., & Kumar, S. (2018). Detecting review manipulation on online platforms with hierarchical supervised learning. Journal of Management Information Systems, 35(1), 350–380. https://doi.org/10.1080/07421222.2018.1440758
- Lancichinetti, A., Sirer, M. I., Wang, J. X., Acuna, D., Körding, K., & Amaral, L. A. N. (2015). High-reproducibility and high-accuracy method for automated topic classification. Physical Review X, 5(1), 011007. https://doi.org/10.1103/PhysRevX.5.011007. https://journals.aps.org/prx/pdf/10.1103/PhysRevX.5.011007
- Larose, D. T. (2005). Discovering knowledge in data. An introduction to data mining.. John Wiley & Sons.
- LaValle, S., Lesser, E., Shockley, R., Hopkins, M. S., & Kruschwitz, N. (2011). Big data, analytics and the path from insights to value. MIT Sloan Management Review, 52(2), 21-31. https://sloanreview.mit.edu/article/big-data-analytics-and-the-path-from-insights-to-value/ (Archived by the Internet Archive at https://bit.ly/2TrF5Zo)
- Levy, Y., & Ellis, T. J. (2006). A systems approach to conduct an effective literature review in support of information systems research. Informing Science. International Journal of an Emerging Transdiscipline, 9, 181–212. https://doi.org/10.28945/479
- Liang, T.-P., & Liu, Y.-H. (2018). Research landscape of business intelligence and big data analytics: a bibliometrics study. Expert Systems with Applications, 111, 2–10. https://doi.org/10.1016/j.eswa.2018.05.018
- Lim, E.-P., Chen, H., & Chen, G. (2013). Business intelligence and analytics: research directions. ACM Transactions on Management Information Systems, 3(4), Article 17. https://doi.org/10.1145/2407740.2407741
- Linton, J. (2011). What does journal fit and focus look like: a visual representation. Technovation, 31(12), 613–614. https://doi.org/10.1016/j.technovation.2011.10.001
- Lnenicka, M., & Komarkova, J. (2015). The impact of cloud computing and open (big) data on the enterprise architecture framework. In Proceedings of the 26th International Business Information Management Association Conference, Madrid, Spain (pp. 1679-1683). International Business Information Management Association.
- Loshin, D. (2012). Business intelligence: the savvy manager's guide. Newnes.
- Mahajan, R., Garg, S., & Sharma, P. (2014). An illustration of logistic regression technique: a case of processed food sector. International Journal of Business Excellence, 7(5), 659–676. https://doi.org/10.1504/IJBEX.2014.064563
- Marshall, A., Mueck, S., & Shockley, R. (2015). How leading organizations use big data and analytics to innovate. Strategy and Leadership, 43(5), 32–39. https://doi.org/10.1108/SL-06-2015-0054
- Mayhew, H., Saleh, T., & Williams, S. (2016). Making data analytics work for you—instead of the other way around. McKinsey Quarterly October, 4, 29–41. https://www.mckinsey.com/business-functions/mckinsey-digital/our-insights/making-data-analytics-work-for-you-instead-of-the-other-way-around# (Archived by the Internet Archive at https://bit.ly/2WLkYr8)
- McAfee, A., & Brynjolfsson, E. (2012). Big data: the management revolution. Harvard Business Review, 90(10), 60–66, 68, 128. https://wiki.uib.no/info310/images/4/4c/McAfeeBrynjolfsson2012-BigData-TheManagementRevolution-HBR.pdf (Archived by the Internet Archive at https://bit.ly/3bSvwZz)
- McCallum, A. K. (2002). Mallet: a machine learning for language toolkit. University of Massachusetts. http://mallet.cs.umass.edu
- Miller, T. W. (2014). Modeling techniques in predictive analytics with Python and R: a guide to data science. FT Press.
- Min, H. (2015). Genetic algorithm for supply chain modelling: basic concepts and applications. International Journal of Services and Operations Management, 22(2), 143–164. http://dx.doi.org/10.1504/IJSOM.2015.071527
- Mohammadi, F., & Hajiheydari, N. (2012). How business intelligence capabilities contributed managerial decision making styles. International Journal of e-Education, e-Business, e-Management and e-Learning, 2(1), 28-33. http://ijeeee.org/Papers/076-Z00059F00024.pdf (Archived by the Internet Archive at https://bit.ly/2ZygWnV)
- Moro, S., Cortez, P., & Rita, P. (2015). Business intelligence in banking: a literature analysis from 2002 to 2013 using text mining and latent Dirichlet allocation. Expert Systems with Applications, 42(3), 1314–1324. https://doi.org/10.1016/j.eswa.2014.09.024
- Newman, M. E., & Girvan, M. (2004). Finding and evaluating community structure in networks. Physical Review. E, Statistical, Nonlinear, and Soft Matter Physics, 69(2), 026113. https://doi.org/10.1103/PhysRevE.69.026113
- Pang, B., & Lee, L. (2008). Opinion mining and sentiment analysis. Foundations and Trends in Information Retrieval, 2(1–2), 1–135. https://doi.org/10.1561/1500000011
- Paterlini, S., & Minerva, T. (2010). Regression model selection using genetic algorithms. In Proceedings of the 11th WSEAS International Conference on Nural Networks and 11th WSEAS International Conference on Evolutionary Computing and 11th WSEAS International Conference on Fuzzy Systems, (pp. 19–27). World Scientific and Engineering Academy and Society.
- Pinheiro, P. R., Pinheiro, M. C. D., Damasceno, V. C., Marques, M. C., Araújo, R. S. B., & Branco, L. M. G. C. (2018). Applying Bayesian networks in the early diagnosis of bulimia and anorexia nervosa in adolescents: applying Bayesian networks in early diagnosis in adolescents. In M.D. Lytras & P. Papadopoulou, (Eds.). Applying big data analytics in bioinformatics and medicine (pp. 364-379). IGI Global. https://doi.org/10.4018/978-1-5225-2607-0.ch015
- Porter, A., Kongthon, A., & Lu, J.-C. (2002). Research profiling: improving the literature review. Scientometrics, 53(3), 351–370. https://doi.org/10.1023/A:1014873029258
- Ram, S., & Delen, D. (2018). Introduction to the inaugural issue of Journal of Business Analytics. Journal of Business Analytics, 1(1), 1.
- Ramirez, E. H., Brena, R., Magatti, D., & Stella, F. (2012). Topic model validation. Neurocomputing, 76(1), 125–133. https://doi.org/10.1016/j.neucom.2011.04.032
- Ransbotham, S., Kiron, D., Prentice,&P.K. (2015). Minding the analytics gap. MIT Sloan Managment Review, 56(3), 63-68. https://sloanreview.mit.edu/article/minding-the-analytics-gap/ (https://bit.ly/3gdXvGT - Archived by the Internet Archive at https://bit.ly/2LLttvS)
- Reed, D. A., & Dongarra, J. (2015). Exascale computing and big data. Communications of the ACM, 58(7), 56–68. http://dx.doi.org/10.1145/2699414
- Rikhardsson, P., & Yigitbasioglu, O. (2018). Business intelligence & analytics in management accounting research: status and future focus. International Journal of Accounting Information Systems, 29, 37–58. https://doi.org/10.1016/j.accinf.2018.03.001
- Samiee, S., & Chabowski, B. R. (2012). Knowledge structure in international marketing: a multi-method bibliometric analysis. Journal of the Academy of Marketing Science, 40(2), 364–386. https://doi.org/10.1007/s11747-011-0296-8
- Seddon, P. B., Constantinidis, D., Tamm, T., & Dod, H. (2017). How does business analytics contribute to business value? Information Systems Journal, 27(3), 237–269. https://doi.org/10.1111/isj.12101
- Sharifian, H., Ashtiani, M. M. D., & Hajiheydari, N. (2017). Applying data mining method for marketing purpose in social networks: case of Tebyan. International Journal of Electronic Marketing and Retailing, 8(2), 116-135. https://doi.org/10.1504/ijemr.2017.10006396
- Skyrius, R., Nemitko, S., & Talocka, G. (2018). The emerging role of business intelligence culture. Information Research, 23(4), paper 806. Retrieved from http://InformationR.net/ir/23- 4/paper806.html (Archived by WebCite® at http://www.webcitation.org/74R3WPMMy)/li>
- Srihari, S. N. (2014). Probabilistic graphical models. In R. Alhajj & J. Rokne, (Eds.). Encyclopedia of Social Network Analysis and Mining (pp. 1388–1402). Springer. https://doi.org/10.1007/978-1-4614-7163-9_156-1.
- Sun, Z., Strang, K., & Firmin, S. (2017). Business analytics-based enterprise information systems. Journal of Computer Information Systems, 57(2), 169–178. https://doi.org/10.1080/08874417.2016.1183977
- Teh, Y. W., Newman, D., & Welling, M. (2007). A collapsed variational bayesian inference algorithm for latent Dirichlet allocation. Advances in Neural Information Processing Systems, 20, 1353–1360. https://bit.ly/2WLjAEN (Archived by the Internet Archive at https://bit.ly/3bQ0dPl)
- Trieu, V.-H. (2017). Getting value from business Intelligence systems: a review and research agenda. Decision Support Systems, 93, 111–124. https://doi.org/10.1016/j.dss.2016.09.019
- Trkman, P., McCormack, K., De Oliveira, M. P. V., & Ladeira, M. B. (2010). The impact of business analytics on supply chain performance. Decision Support Systems, 49(3), 318–327. https://doi.org/10.1016/j.dss.2010.03.007
- Van Eck, N. J., Waltman, L., Van den Berg, J., & Kaymak, U. (2006). Visualizing the computational intelligence field. IEEE Computational Intelligence Magazine, 1(4), 6–10. https://doi.org/10.1109/MCI.2006.329702
- Van Eck, N. J., & Waltman, L. (2007). VOS: A new method for visualizing similarities between objects. In H.-J. Lenz, & R. Decker (Eds.). Advances in Data Analysis: Proceedings of the 30th Annual Conference of the German Classification Society (pp. 299–306). Springer. https://doi.org/10.1007/978-3-540-70981-7_34
- Van Eck, N., & Waltman, L. (2009). VOSviewer: a computer program for bibliometric mapping. SSRN. (ERIM Report Series Reference No. ERS-2009-005-LIS). https://papers.ssrn.com/sol3/Delivery.cfm/14841.pdf?abstractid=1346848&mirid=1
- Van Eck, N. J., & Waltman, L. (2010). Software survey: VOSviewer, a computer program for bibliometric mapping. Scientometrics, 84(2), 523–538. https://doi.org/10.1007/s11192-009-0146-3
- Van Eck, N. J., & Waltman, L. (2011). Text mining and visualisation using VOSviewer. arXiv https://arxiv.org/pdf/1109.2058
- Van Eck, N. J., & Waltman, L. (2014). Visualizing bibliometric networks. In Y. Ding, R. Rousseau, & D. Wolfram (Eds.). Measuring scholarly impact. (pp. 285-320). Springer.
- Waltman, L., & Van Eck, N. J. (2013). A smart local moving algorithm for large-scale modularity-based community detection. The European Physical Journal B, 86(11), Article 471. https://doi.org/10.1140/epjb/e2013-40829-0
- Waltman, L., Van Eck, N. J., & Noyons, E. C. (2010). A unified approach to mapping and clustering of bibliometric networks. Journal of Informetrics, 4(4), 629–635. https://doi.org/10.1016/j.joi.2010.07.002
- Ward, M. J., Marsolo, K. A., & Froehle, C. M. (2014). Applications of business analytics in healthcare. Business Horizons, 57(5), 571–582. https://doi.org/10.1016/j.bushor.2014.06.003
- Watson, H. (2011). Business analytics insight: hype or here to stay. Business Intelligence Journal, 16(1), 4–8.
- Weiss, S. M., Indurkhya, N., & Zhang, T. (2015). Fundamentals of predictive text mining. Springer.
- Yan, E., Ding, Y., & Jacob, E. K. (2012). Overlaying communities and topics: an analysis on publication networks. Scientometrics, 90(2), 499–513. https://doi.org/10.1007/s11192-011-0531-6
- Yang, C., Huang, Q., Li, Z., Liu, K., & Hu, F. (2017). Big data and cloud computing: innovation opportunities and challenges. International Journal of Digital Earth, 10(1), 13–53. https://doi.org/10.1080/17538947.2016.1239771
- Zeng, L., Li, L., Duan, L., Lu, K., Shi, Z., Wang, M., Wu, W., & Luo, P. (2012). Distributed data mining: a survey. Information Technology and Management, 13(4), 403–409. https://doi.org/10.1007/s10799-012-0124-y
- Zhang, W., Yang, X., Lui, S., Meng, Y., Yao, L., Xiao, Y., Deng, W., Zhang, W., & Gong, Q. (2015). Diagnostic prediction for social anxiety disorder via multivariate pattern analysis of the regional homogeneity. BioMed research international. https://doi.org/10.1155/2015/763965
- Zitt, M., Bassecoulard, E., & Okubo, Y. (2000). Shadows of the past in international cooperation: collaboration profiles of the top five producers of science. Scientometrics, 47(3), 627–657. https://doi.org/10.1023/A:1005632319799