An analysis of use statistics of electronic papers in a Korean scholarly information repository
Jayhoon Kim, Su-yeong Bae, Hyekyong Hwang, and Sung-Seok Ko.
Introduction. This study aimed to analyse the current use status of Korean scholarly papers accessible in the repository of the Korea Institute of Science and Technology Information in order to assess the economic validity of the maintenance and operation of the repository.
Method. This study used the modified historical cost method and performed regression analysis on the use of Korean scholarly papers by year and subject area.
Analysis. The development cost of the repository and the use volumes were analysed based on 1,154,549 Korean scholarly papers deposited in the Institute repository.
Results. Approximately 86% of the deposited papers were downloaded at least once and on average, a paper was downloaded over twenty-six times. Regression analysis showed that the ratio of use of currently deposited papers is likely to decrease by 7.6% annually, as new ones are added.
Conclusions. The need to manage currently deposited papers for at least thirteen years into the future and provide empirical proof that the repository has contributed to Korean researchers conducting research and development in the fields of science and technology. The benefit-cost ratio was above nineteen, confirming the economic validity of the repository.
DOI: https://doi.org/10.47989/irpaper892
Introduction
Recent advances in information technology have facilitated the sharing of and access to scholarly papers in digital format. However, researchers’ free access to scholarly papers is still limited due to commercial publishers charging for their content. The open-access initiative emerged as an alternative to overcome the paradox in the academic environment. This initiative aims to facilitate the sharing of information between researchers and users such that anyone can freely access and utilise information without legal, financial, and technical barriers (Suber, 2005). Open access refers to the removal of sharing and free access limitations posed by existing commercial publishers and the return of the academic environment to its original aspirations of sharing and communication. Specific open access strategies include gold open access, where an author often pays an article processing charge to publish their paper in an open access journal. The journal then allows everyone to freely view academic papers. Green open access is where an author publishes their paper in any journal and then self-archives a copy in a freely accessible institutional or specialist online archive (a repository or a Website).
Repositories are important sources of easy access to the scholarly information needed in academic research and practice. It is a model that allows free use of copyrighted scholarly publications (even for publications whose free access is limited by commercial publishers) and offers a new direction for scholarly information management systems (Bhardwaj, 2014). The first repository launched in 1991 was the physics repository now known as arXiv, which started as a server for articles on theoretical physics and included other areas of physics, mathematics and computer science as the Internet developed. Other early repositories include EconPapers, CogPrints and PubMed Central.
As in many countries, Korea has witnessed an increasing number of institutional repositories being developed by universities and research institutes, making a major contribution to vital scholarly exchanges. Among these, the oldest and largest repository of science and technology scholarly papers was established by the Korea Institute of Science and Technology Information (hereafter, the Institute), an institution that has provided scholarly information services since 1962. The repository is made available in Korea through the National Digital Science Library, a science and technology information service platform developed to foster scientific and technological innovations in the country by providing high-quality information to industry and academic research collaborators. The platform offers a content search function consisting of approximately 100 million records of diverse scholarly information such as scholarly papers, patent information and technical reports, as well as a specialised search service by type of content. As of March 2020, the Institute repository of scholarly papers had 100 million entries of metadata and full text of scholarly papers published inside and outside Korea. For scholarly papers published overseas, typically, only the metadata are deposited and a link to the full paper is provided. For papers published in Korea, original texts and metadata are stored in the repository, as the Institute has signed agreements with Korean academic institutions in the fields of science, technology, interdisciplinary convergence and integration. The Institute increases the quality of scholarly information in the repository through several curation processes, including author identification, institution identification, funding organisation identification, personal information processing, encryption, digital object identifier registration, reference extraction and quantitative analysis. The Institute also processes the original texts of papers provided by academic institutions, in addition to developing metadata and making them freely accessible in a timely manner. Yoon and Tibbo (2012) verified that the Institute repository has been effective according to several criteria, by enabling reuse through content curation, storing and maintaining original data, developing ways to use even more data in future projects, and enhancing the ability to verify research findings to promote the use of data in education.
However, a considerable amount of resources is necessary for the development and maintenance of a repository. In addition, continuous investment in a repository requires the assessment of its economic validity. The value of offline academic libraries handling scholarly information has been evaluated in many studies, among which Oakleaf (2010) stands out for having summarised years of work on the value of academic libraries.
With regards to the economic assessment of online-based repositories, Houghton and Beagrie’s research (2012) is a representative example. They conducted a fully developed quantified economic impact study on one of the UK Data Archives, the Economic and Social Data Service (ESDS), and found that quantifiable benefits and returns significantly exceeded the value of the funding invested in the platform. The study predicted a range of values, moving from those focusing on minimum values towards methods measuring some of the broader impacts, and, simultaneously performed qualitative analysis, such as case studies and the Keep Research Data Safe (KRDS) benefit framework. The KRDS benefit framework is intended to identify, assess and communicate the benefits of investing resources in the curation and long-term preservation of research data (Beagrie, 2011). The authors conducted a study on the Archaeology Data Service (ADS) by applying the framework used in the evaluation of ESDS (Beagrie and Houghton, 2013), and further proceeded to conduct a study which compared three data centre services, including the British Atmospheric Data Centre (BADC) (Beagrie and Houghton 2014). In these studies, qualitative assessment was conducted using the contingent value method (CVM) mainly based on surveys and interviews. The contingent value of a non-market good or service refers to the amount that users are willing to pay for it and/or willing to accept in return for it.
The value of scholarly information stored in a repository can be assessed from a data or information perspective. This valuation methodology is largely based on asset valuation methods on exchange value and use value. However, it is not easy to evaluate the exchange value of scholarly information as the market is not fully developed. Regarding the use value, it is not easy to estimate the economic effect through use. Moody and Walsh (1999) argued that information has seven unique attributes, distinguished from conventional tangible or intangible assets, and suggested the modified historical cost method, which takes the unique attributes into account. According to this method, data producers are very rational, which leads them to invest based on the assumption that the future economic value will be greater than the current investment. However, the value of the data ranges from potentially no value to enormous value. For example, sometimes data are never used and are only an overhead. At the other end of the spectrum, data can be used in crucial decision-making processes. In this sense, the method adjusts for the value of the data based on their unique attributes, such as its quality and the potential for an infinite number of users, in addition to considering data duplication. The most prominent feature of the modified historical cost method is that it relies heavily on statistical data on the current status of information use. Because statistical data can be easily obtained from information systems and the modified historical cost method is based on objective data, this method is advantageous in comparison to others in that assumptions and subjective viewpoints are removed.
This study aimed to analyse the current use of Korean scholarly papers available in the Institute repository in order to assess the economic validity – benefit-cost (B/C) ratio – of the maintenance and operation of the repository. To this end, this study was based on the modified historical cost method and analysed the use of Korean scholarly articles by year and by subject area adopting regression analysis to show the economic validity of the repository and provide basic data to be used in the development of operational strategies.
The remainder of this article is as follows: the methods section provides a description of the data used in the study and the methodological approach; the results section presents the results of the overall analysis and of the specific analysis by year and by subject area. In the discussion section, economic validity and future operational strategies are described and the analysis of the results is presented in the results section. The final section presents the conclusions of the study.
Methods
Dataset
The data used in this study were the numbers of full-text scholarly papers published in Korean academic journals deposited in the Institute repository between 2007 and 2019 and their corresponding use. For the period considered, 1,154,549 Korean scholarly papers across twenty-six subject areas were identified with their respective information on years of deposit, years of publication and subject area, as well as general information (including descriptive metadata on publication). The details of the deposited papers, that is the numbers of papers by year of deposit and year of publication, are summarised in Tables 6 and 7 in the Appendix, respectively.
The use volume through the National Digital Science Library was defined as the number of downloads of Korean scholarly articles between 2013 and November 29, 2019. Papers published outside Korea were excluded from this study because their full texts were not deposited in the repository, and this is often a gateway for overseas publishers. Prior to conducting the main analysis, abnormal use values were examined during data cleansing. Several papers showed an abnormally high number of downloads, albeit not very many. After a review of citation information and the contents of the papers, three papers were excluded from the study as it was concluded that they displayed over 10,000 downloads per year due to a system error or an abnormal phenomenon. In the final dataset, it was observed that during the study period, 996,151 articles were downloaded at least once and 26,164,642 downloads occurred in total.
Procedure
This study is based on the modified historical cost method suggested by Moody and Walsh (1999). They propose the following modifications to the historical cost method for valuing information, which incorporates the unique attributes of information.
- Cost of information collection is used as the baseline for the value of information and this cost needs to be standardised by using a standard information cost for each item.
- The cost of the information management system should be considered based on the cost of the processes used to extract the data from the information repository
- Redundant information has zero value to avoid double counting
- Unused information also has zero value.
- The number of users and number of accesses to the information are used to multiply the value of the information. The first time information is used, it is valued as the cost of information collection and maintenance. This value is added to each additional use.
- Moody and Walsh’s (1999) key idea is that the historical cost of information should be modified in light of its use in practice and reflects the cumulative nature of its value across different users.
- The value of information depreciates based on its retention period.
- The value of inaccurate information is discounted by relative acceptability.
This method consists of three parts: the cost of data collection, the quality of the data collected and the use of the data. However, in this study, we are mainly concerned with the use of data.
First, due to the confidentiality of the cost data, it is not appropriate to provide a detailed view of the cost of data collection. Two types of cost data, however, were considered in this study: labour cost and repository system operating cost. Labour cost and system operating cost consist of acquisition cost and maintenance cost, respectively. Taking into account all these costs, we have obtained the value of each deposited product. Second, the quality of the collected data is guaranteed by the well-established Institute data acquisition and standardised data management processes.
Therefore, to apply the modified historical cost method in this paper, we analysed the use of the collected papers. The use of papers tends to decrease over time, but since a collected paper will continue to be used in the future, we estimate the total use through regression analysis of current and future use.
Results
Basic statistics
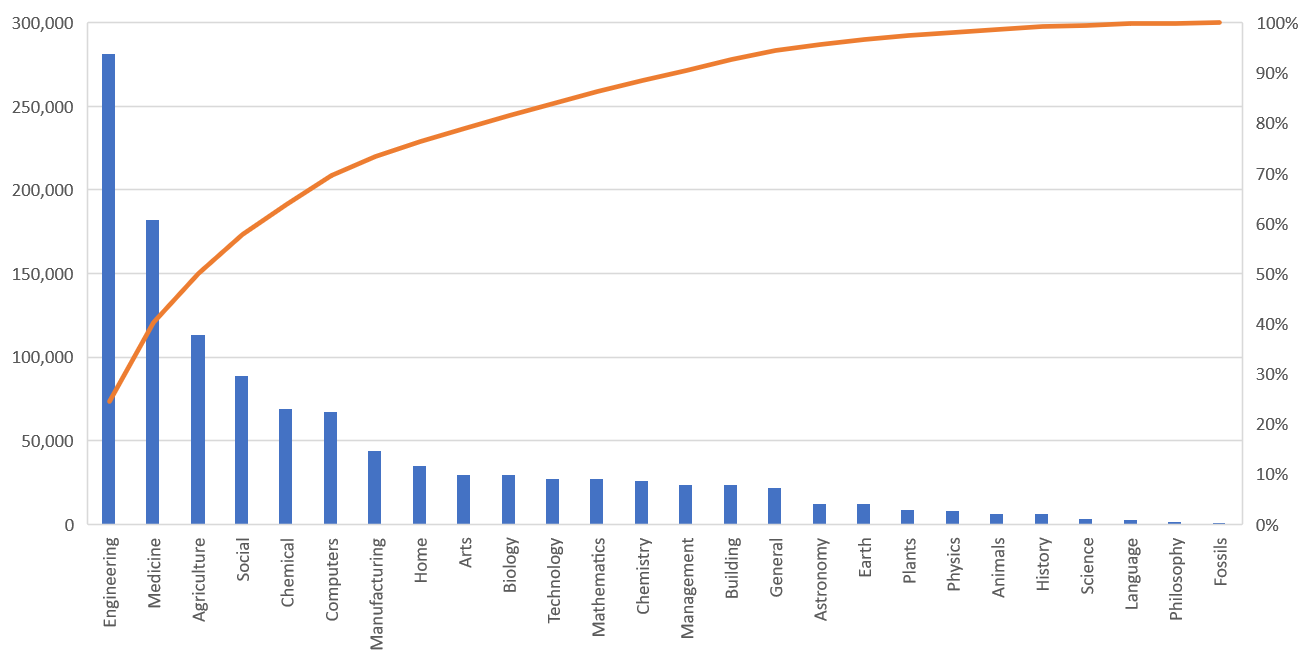
As shown in Figure 1, a Pareto analysis was performed to examine the total number of deposited papers by subject area, as classified by the Korean Institute of Science and Technology Information (full names are given in Table 5 of the Appendix). Engineering accounted for 25% of all deposited papers. Although areas such as chemical were listed separately, it is speculated that engineering still encompasses numerous subareas with many academic journals and papers produced each year. The subject area with the second-highest number of deposited papers was medicine, comprising 15.8% of the total. As many academic journals and research papers are produced in medicine, as in engineering; however, a large number of them are published in overseas academic journals and, thus, the number of papers published in Korean academic journals is smaller compared to engineering. With the addition of agriculture, the top three areas accounted for 50% of all deposited papers. In addition, the upper half of the subject areas represented approximately 90% of all deposited papers, showing a bias towards particular subject areas. This phenomenon is believed to be due more to the distinctive general features of scholarly information rather than to a feature of Korean academic policy.
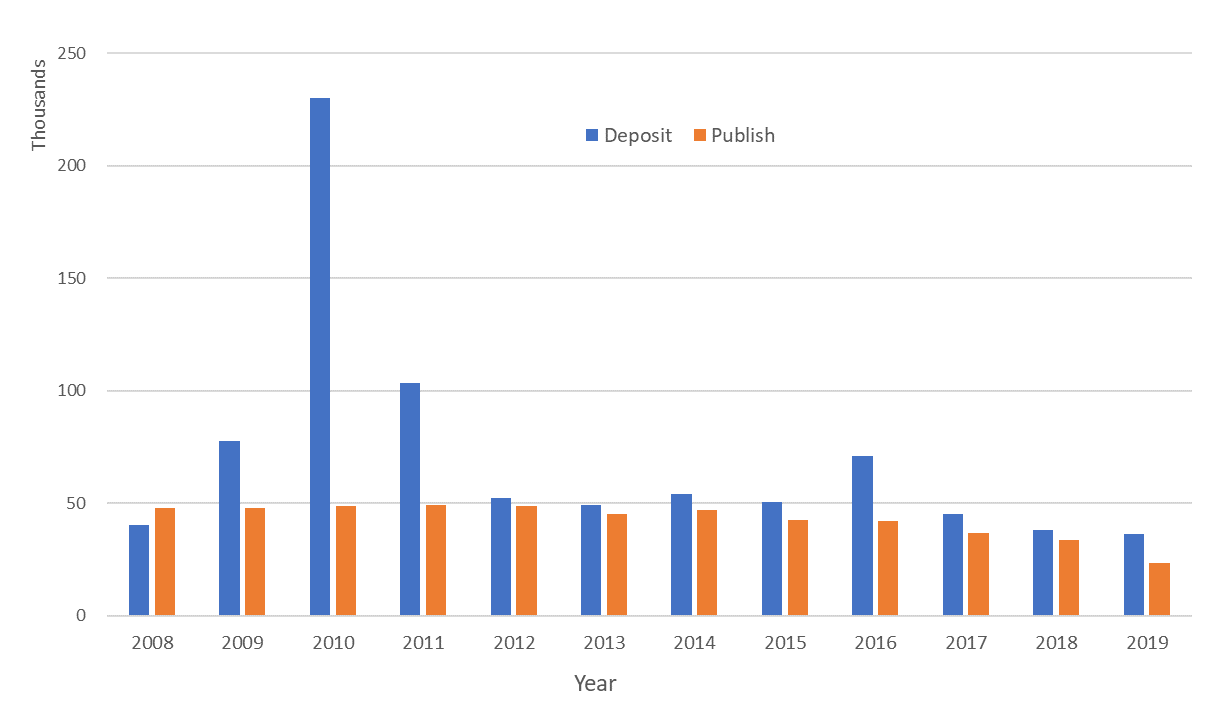
Data comparing the volumes of papers deposited and published each year are presented in Figure 2.
The yearly volume of deposited papers varied considerably over the study period. In 2010, 230,000 papers were deposited, while only approximately 36,000 papers were deposited in 2019. The number of papers in 2010 was relatively high because, in that year, several scholarly databases were integrated into the repository. Thereafter, a similar number of papers were deposited each year with the exception of 2016, suggesting a steady acquisition of scholarly papers.
In comparison with article deposits, the yearly volume of publications was strongly constant. However, the number of deposited papers is decreasing in more recent years, which seems to be due to the difference between the years of publication and deposit and an embargo period on academic publishing.
Data on the use volumes of the papers are summarised in Table 1. From 2013 through 2019, annually, approximately 574,000 papers were downloaded at least once and a total of 996,151 papers were downloaded during the same period. Thus, approximately 86% of all deposited papers were downloaded at least once. This rate is considered significantly high, given that researchers can download papers not only from NDSL, but also through various other routes, such as publisher homepages and portals. Except for 2016, the number of papers downloaded did not vary greatly, which suggests the presence of a stratum of fixed users.
Nevertheless, the number of downloads fluctuated over time. With the exception of 2017, when articles were downloaded 2.9 million times, the annual number of downloads was over three million. Over the past three years, both the number of downloads and the number of deposited papers has been on an increasing trend. However, such an increase has occurred only recently, and it is therefore difficult to determine whether the number of downloads would increase in the long run.
| Year | Number of papers | Total number of downloads | Average number of downloads per paper |
|---|---|---|---|
| 2013 | 518,777 | 4,199,139 | 8.09 |
| 2014 | 582,475 | 4,512,645 | 7.75 |
| 2015 | 547,646 | 3,856,069 | 7.04 |
| 2016 | 752,429 | 3,902,914 | 5.19 |
| 2017 | 530,040 | 2,959,242 | 5.58 |
| 2018 | 536,067 | 3,221,081 | 6.01 |
| 2019 | 550,863 | 3,513,552 | 6.38 |
| Mean | 574,042 | 3,737,806 | 6.58 |
| Total | 996,151 | 26,164,642 | 26.27 |
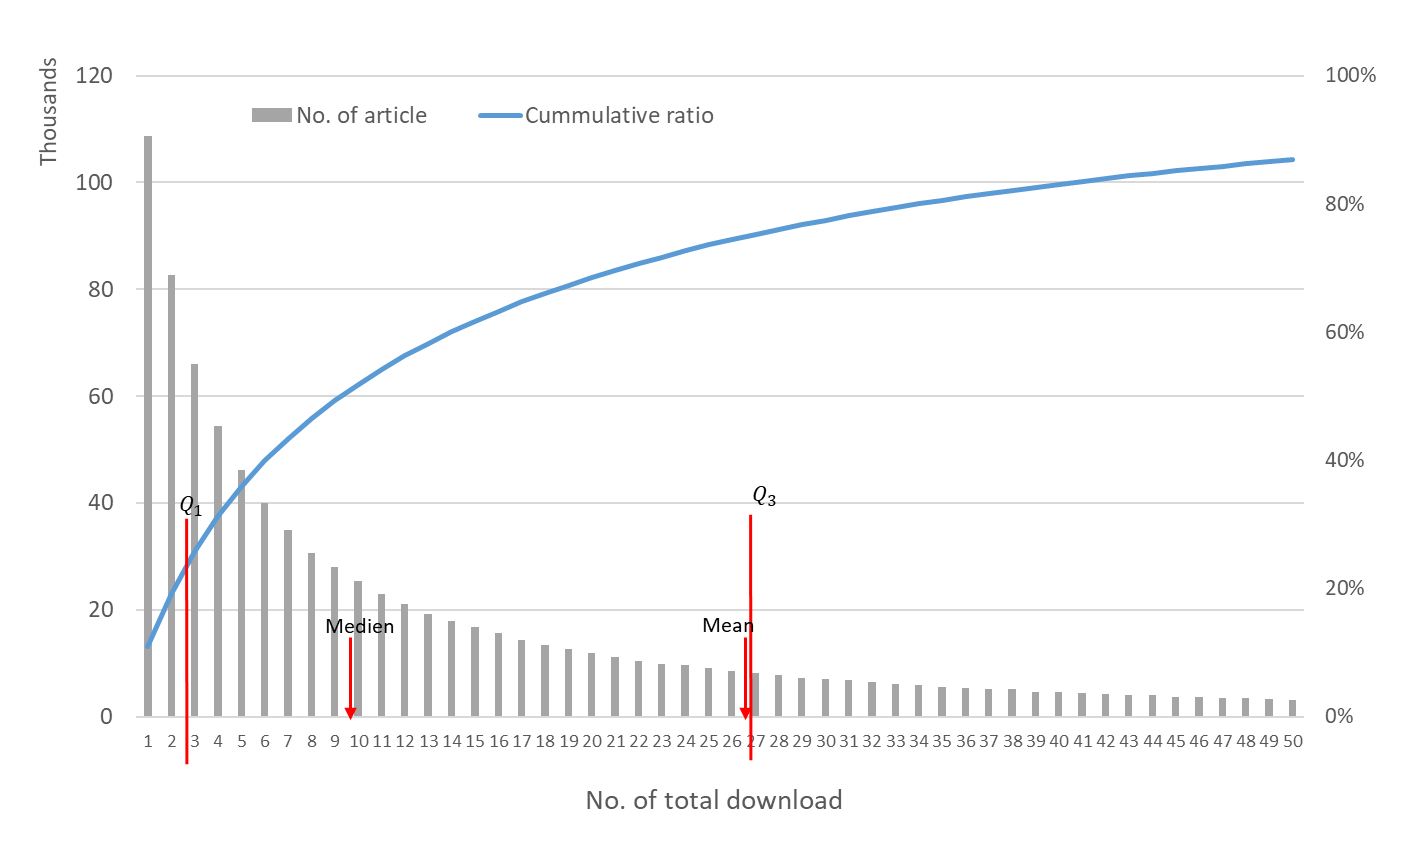
During the study period, a paper was downloaded 26.27 times on average and a total of approximately 26 million downloads occurred. However, the number of times each article was downloaded varied considerably, as shown by the Pareto analysis presented in Figure 3. According to Figure 3, 10.91% of the papers were downloaded only once and the number of papers decreased exponentially as the number of downloads increased. Overall, however, Figure 3 reveals that the long tail principle, rather than the Pareto principle, was at work. This means that not many papers were downloaded numerous times, but such papers did exist. Due to this phenomenon, although the mean was 26.27, the first and the third quartiles were three and twenty-seven, respectively, and the median was ten; that is, 50% of all deposited papers were downloaded ten or fewer times during the study period (2013-2019), with a yearly average of 1.5 or fewer times.
Use statistics by subject area
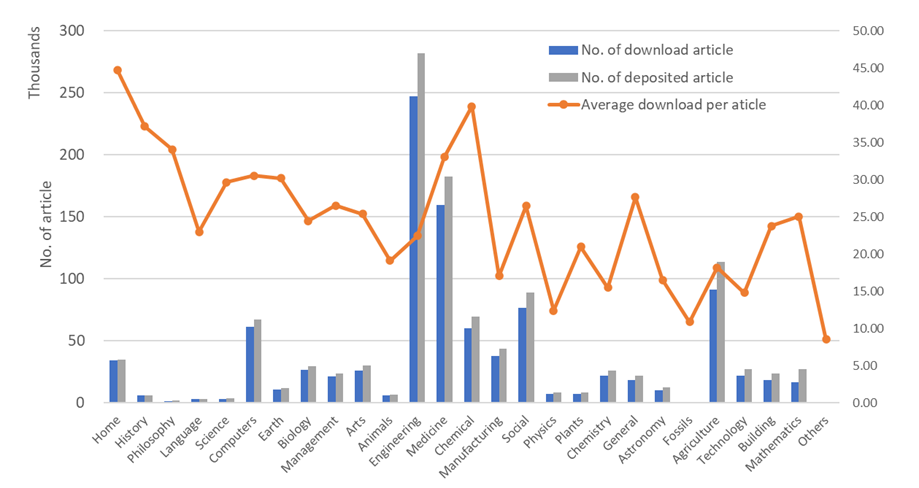
Figure 4 shows the number of downloaded papers, the number of deposited papers, and the average number of downloads per paper for each subject area. In general, the number of deposited papers was high in subject areas with a high number of downloads. Hence, it is believed that the subject areas of the deposited papers have been properly chosen. Among the subject areas, mathematics showed a ratio of downloaded to deposited articles of 61.25%, while the corresponding ratio was 77.58% for building & construction and 79.59% for technology. With the exception of these three subject areas, the remaining twenty-three areas showed a ratio above 80%. Hence, the ratio of use was very high. Although the number of articles was on the low side, in home & family management and history, the ratios were above 95%, clearly showing that almost all of the deposited papers in these subject areas were used. This finding can be interpreted as a demonstration that the characteristics of academic areas were highly influential, and it seemed that the influence of a handful of papers raising issues from a socio-environmental perspective was significant.
However, the average number of downloads per article varied widely by subject area. In home & family management and history (subject areas with very high use ratios), the average number of downloads per article was the highest (forty-five and thirty-seven, respectively), while in the subject areas with low use ratios (such as fossils & prehistoric life and technology), the average number of downloads per paper was also low. The correlation between the use ratio and the average number of downloads per paper was positive, with a coefficient of ρ=0.48.
Based on their amount of use and the use trends, the subject areas were divided into three groups: heavy use subject area, medium use subject area, and light use subject area. The summary statistics for each group are presented in Table 2.
The heavy use group consisted of two subject areas, engineering and medicine, which showed ratios slightly over 40%. When this group and the medium use group were combined, a total of seven subject areas showed ratios higher than 70%. Given the comparability between the ratios of deposited articles and usage, it is believed that the scholarly information deposited in the repository adequately reflects the usage volume.
| Group | Subject | Ratio of deposited papers | Ratio of downloaded papers | Download ratio |
|---|---|---|---|---|
| Heavy use | Engineering, Medicine | 40.2% | 40.8% | 41.3% |
| Medium usage | Agriculture, Chemical, Computers, Home, Social | 32.4% | 32.5% | 36.3% |
| Light usage | Others | 27.4% | 26.7% | 22.4% |
Use statistics by year
Table 8 in the Appendix presents the annual number of downloaded papers by year of publication. The column shows the year of download and the row shows the year of publication. For example, in 2013, 518,777 papers were downloaded, of which 330,184 were published in or before 2007, while 31,240 were published in 2008.
Although the specific values shown in the table are meaningful in themselves, the overall trend is even more significant. In each column, the values continuously increase up to the most recent one or two years, showing that the most recently published papers were downloaded more frequently. However, the most recently published papers don’t follow this trend, apparently because the volume of recently deposited papers is not very high and because more time should pass for papers to be exposed to researchers.
An examination of the values in each row showed that the number of downloaded papers decreased, except for in 2016 (the year when the number of downloads was higher compared with other years), suggesting a steady demand for the most recent papers. However, the number did not drop abruptly indicating that the demand for papers published in the past did not decrease suddenly. This finding is consistent with what Starr and Williams (2008) reported and demonstrates the need to continue managing papers deposited in the past, as well as recent publications.
Table 9 in Appendix shows the yearly volume of downloads by the paper’s year of publication. The column lists the year of the download and the rows list the years of publication. The trend in the volume of downloads is the same as the result of the analysis conducted using the data in Table 8.
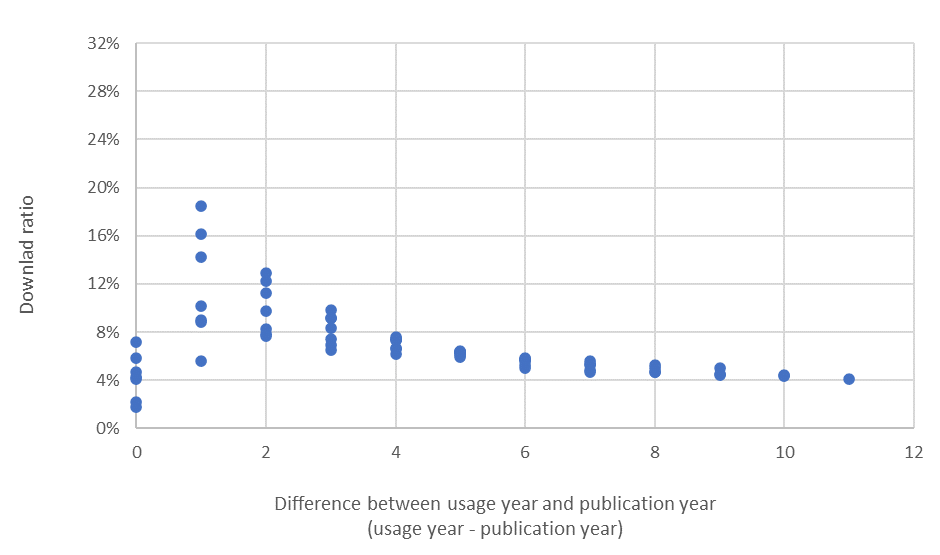
For a more detailed analysis, the data in Table 9 were manipulated to obtain the results shown in Figure 5. In Figure 5, the x-axis shows the difference in years between publication and download, while the y-axis shows the ratio of number of downloads of papers published in a given year to the total number of downloads in that year. For example, in 2016, the number of downloads of papers published in 2010 was 219,404, representing 5.62 % of the total use volume in 2016 (219,404/3,902,914 = 5.62%). This data point is the fourth of the six points corresponding to the x value of 6 (2016-2010) in Figure 5.
The graph reveals the trend of downloads according to the number of years passed since publication, which also has a bearing on the lifespan of the deposited papers. That is, the trend of the data points in Figure 5 is that the ratio of downloads is gradually decreasing, and the rate of decrease appears to be non-linear, indicating that the number of downloads decreases over time. Accordingly, although it is crucial to acquire new papers to meet information needs, it is also important to manage those already deposited. Another trend that can be seen in the graph is that the volatility in the ratio of downloads decreases over time. This finding could be interpreted as convergence over time; however, there is a limitation in conducting statistical analysis because, as the number of years between publication and download increased, the size of available data was small.
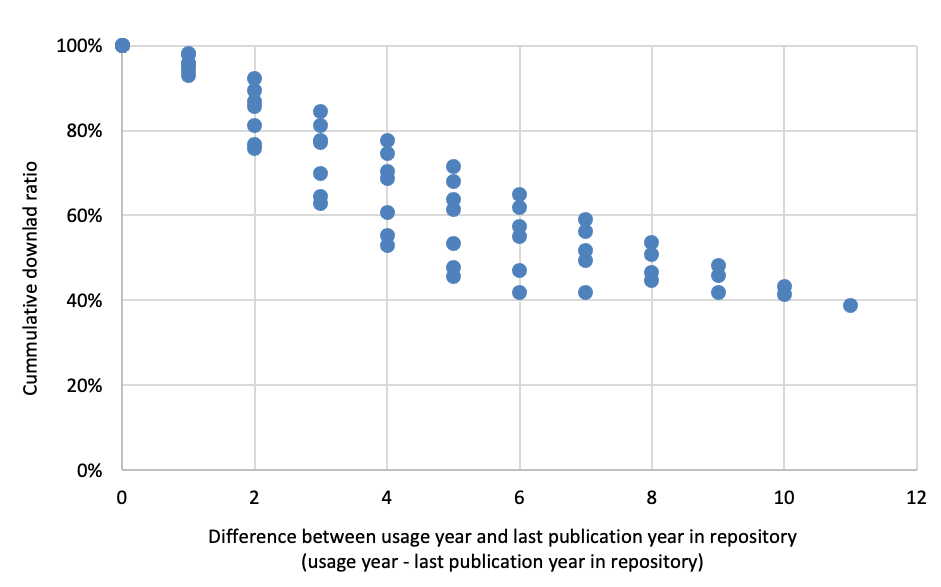
In addition to the ratio of papers by year of publication, it is also crucial to examine cumulative ratios. The cumulative ratio enables the prediction of the lifespan of the papers currently deposited, which can be strategically used in the management of the information deposited in the repository. Cumulative download ratios are shown in Figure 6. For example, in 2016, the number of downloads of papers published before 2014 was 3,399,951 representing 86.88% of the total use volume in 2016 (3,399,951/3,902,914 = 86.88%). This data point is the third one of the six points corresponding to the x value of 2 (2016-2014) in Figure 6. This figure presents useful information to identify the use trends of the information currently deposited, as it provides information on future use levels. According to Figure 6, the cumulative ratios are gradually decreasing. Regression analysis was conducted to statistically confirm the observation.
The response variable, Y, was the cumulative download ratio and the independent variable, X, was the difference between use year and publication year. Cases with X≥8 were excluded due to lack of data and a total of fifty-three data points were submitted to regression analysis. The results are presented in Table 3 below.
| df | SS | MS | F | Significance F | |
|---|---|---|---|---|---|
| Regression | 1 | 1.510 | 1.510 | 271.480 | 0.000 |
| Residual | 51 | 0.284 | 0.006 | ||
| Total | 52 | 1.794 |
| Coefficients | Standard error | t Star | P-value | |
|---|---|---|---|---|
| Intercept | 0.995 | 0.018 | 53.977 | 0.000 |
| Difference | -0.076 | 0.005 | -16.477 | 0.000 |
The explanatory power of the model, R2=0.84, was sufficiently high. The equation was as follows:
Y=0.995-0.076 X
indicating that the use ratio for articles currently deposited decreases by 7.6% per year. This finding shows that the download ratio is likely to reach 0% after approximately thirteen years (that is, the lifespan of the papers currently deposited) and, thereafter, the most downloaded papers will be those deposited after the current point in time. This means that the average lifespan of deposited papers is thirteen years or more. Therefore, it is necessary to set the minimum period for the management of papers at above thirteen years. As there are wide variations in scholarly articles, it is reasonable to set the management period to be much longer than thirteen years. In addition, as stated in Kryder’s Law that information storage costs continue to decrease (Rosenthal, 2017), the costs of storing and managing already deposited articles are relatively low compared to the cost of acquiring new papers, and the unit cost continuously becomes cheaper. Therefore, it would not be difficult to plan for a management period longer than the average lifespan.
Table 4 shows the ratio of downloaded papers to deposited papers. The data after 2008 show that at least 50% of the deposited papers were downloaded. In other words, more than half of the deposited papers were downloaded at least once in a given year. The numbers in each column indicate a trend of more recent papers having higher download ratios. However, the ratios of download in the same year of publication are somewhat low because not enough time has passed for the papers to be exposed to researchers. An examination of the numbers in each row (except in 2016, a year that showed abnormally high download ratios) clearly confirms the aforementioned finding that the download ratio decreased over time, although the rate of decrease was not high.
| Pub Year | 2013 | 2014 | 2015 | 2016 | 2017 | 2018 | 2019 |
|---|---|---|---|---|---|---|---|
| ~2007 | 52% | 55% | 49% | 65% | 42% | 41% | 40% |
| 2008 | 65% | 66% | 58% | 73% | 51% | 49% | 51% |
| 2009 | 67% | 68% | 60% | 75% | 52% | 50% | 53% |
| 2010 | 70% | 72% | 65% | 79% | 55% | 53% | 56% |
| 2011 | 73% | 73% | 65% | 80% | 56% | 54% | 56% |
| 2012 | 77% | 78% | 69% | 86% | 57% | 55% | 56% |
| 2013 | 37% | 79% | 72% | 91% | 62% | 59% | 59% |
| 2014 | - | 49% | 72% | 89% | 63% | 59% | 58% |
| 2015 | - | - | 32% | 96% | 66% | 62% | 62% |
| 2016 | - | - | - | 55% | 68% | 75% | 62% |
| 2017 | - | - | - | - | 44% | 71% | 66% |
| 2018 | - | - | - | - | - | 31% | 61% |
| 2019 | - | - | - | - | - | - | 49% |
| Total | 56% | 60% | 54% | 71% | 48% | 47% | 48% |
Discussion
This study examined the current use status of the Korea Institute of Science and Technology Information repository of Korean scholarly papers by year and by subject area. The findings indicate various implications for the repository’s economic validity and efficient operation.
First, over the past eight years, approximately 50,000 papers per year were deposited in the Institute's repository and the average number of downloads per year was 3.7 million. On average, the number of downloads was approximately seventy-five times higher than the number of deposited papers, indicating that the repository has been actively used. Second, approximately 86% of the deposited papers were downloaded at least once, which demonstrates that the scholarly information stored in the repository is useful. This finding also justifies the need to continue operating the National Digital Science Library (NDSL). Third, the twenty-six subject areas identified were categorised into three use groups: heavy, medium and light. This classification was applied to the current status of both the use and deposit of papers, showing that the NDSL operational strategy adequately reflects the needs of researchers. Lastly, in general, the older the publications, the lower the use ratio. The rate of decrease was analysed in a linear relationship and the lifespan of the articles currently deposited was estimated at thirteen years. Thus, the deposited papers should be managed for at least thirteen years in order to support researchers’ academic activities.
The analysis of the current use status of the Institute's repository of Korean scholarly papers showed that, currently, the papers deposited in the repository have been used properly. This finding means that the current operational strategy is working well and suggests the need to acquire scholarly articles more proactively. In addition, the economic validity of the repository can be evaluated based on the modified historical cost method, as follows.
First, cleansed data were used in the study, which allows one to assume that problems such as data quality and duplication had been resolved. Therefore, from the perspective of the benefit to cost ratio (BCR), the value of scholarly information stored in the Institute's repository of Korean scholarly papers can be assessed by defining benefit as the total number of uses per paper and total investment cost as the sum of the costs for deposit (acquisition) and storage per paper.
By assigning a value of one to acquisition cost and assuming that the annual management cost is 10% (a conventional estimate used in Korea) with a decrease rate of 50% per year on the basis of Kryder’s Law (Rosenthal, et al., 2012), the cost per paper is estimated to be 1.2. As shown in Table 3, a paper was downloaded on average of 26.27 times and approximately 86% of the deposited papers were downloaded. Therefore, the average number of downloads per paper among the downloaded papers is 26.27 ×0.86= 22.6; accordingly, B/C=22.6/1.2=18.8. This indicates that the acquisition and operation of the repository is estimated to have a benefit approximately nineteen times greater than the investment.
Conclusion
In this study, the current use status of the Institute's repository of Korean scholarly papers was examined to provide basic data for economic validity analysis and operational strategy development for continuous operation of the repository. Specifically, the status of the papers deposited in the repository as at 2019 and the use status of deposited articles from 2013 through 2019 were analysed from a variety of viewpoints (including by subject area and by year).
According to the analysis, it was found that approximately 86% of all deposited papers have been used and that each paper was downloaded on average twenty-six times. Approximately 50,000 papers were deposited per year and the annual number of downloads was 3.5 million, a number seventy times higher than the volume of deposited papers, suggesting that the repository has been actively used. Regarding the economic validity of the repository, the benefit:cost ratio was estimated to be 18.8 on the basis of the concept of the modified historical cost method, demonstrating that benefit was much greater compared to investment.
This research was initiated to evaluate the economic value of the Institute's repository of Korean scholarly papers. However, given the intrinsic attributes of the research, there was a limitation in conducting accurate cost analysis, and the valuation was performed in a simplified manner due to a lack of holistic methods to evaluate the economic value of scholarly papers.
Hence, this study mainly focused on quantitative analysis on the use of deposited papers. However, it is important to develop an effective holistic methodology for evaluating the development and operation of institutional repositories of scholarly papers that should consider both economic and social values including qualitative analysis of the user's benefit or scenario. It is also necessary to consider the characteristics of the domestic academic situation in each subject area.
Acknowledgement
This research was supported by Korea Institute of Science and Technology Information.
About the authors
Jayhoon Kim is a Principal Researcher at the Korea Institute of Science and Technology Information, Daejeon, Korea. He is a Ph.D. candidate in Library and Information Science at the Chungnam National University. His research focuses on digital curation of scholarly information. He can be contacted at jay.kim@kisti.re.kr
Su-yeong Bae is a Research Engineer at the Korea Institute of Science and Technology Information, Daejeon, Korea. He received his MS degree in Computer Engineering from Hongik University. His research focuses on scholarly information service. He can be contacted at sybae@kisti.re.kr
Hyekyong Hwang is a Principal Researcher, Director of Content Curation Center at the Korea Institute of Science and Technology Information, Daejeon, Korea. She received her Ph.D.degree in Library and Information Science from Yonsei University, Korea. Her research areas are Content Curation of the Scholarly Communication, Open Access, Citizen Science, and AI Services. She can be contacted at hkhwang@kisti.re.kr
Sung-Seok Ko (Corresponding author) is a Professor in the Department of Industrial Engineering, Konkuk University, Seoul, Korea. He received his Ph.D. degree in Industrial and Systems Engineering from Georgia Institute of Technology, USA. His areas of research interests include Operations Research, Stochastic Process and Data Science. He can be contacted at ssko@konkuk.ac.kr
References
- Beagrie, C. (2011). User guide for keeping research data safe. Assessing costs/benefits of research data management, preservation and re-use. Charles Beagrie Ltd. https://beagrie.com/static/resource/KeepingResearchDataSafe_UserGuide_v2.pdf (Archived by the Internet Archive at https://bit.ly/37rtq3y)
- Beagrie, N. & Houghton, J. (2013). The value and impact of the Archaeology Data Service: a study and methods for enhancing sustainability. Charles Beagrie Ltd. http://repository.jisc.ac.uk/5509/1/ADSReport_final.pdf (Archived by the Internet Archive at https://bit.ly/2ZwXW7G)
- Beagrie, N. & Houghton, J. (2014). The value and impact of data sharing and curation. A synthesis of three recent studies of UK research data centres. JISC. http://repository.jisc.ac.uk/5568/1/iDF308-DigitalInfrastructureDirectionsReport, Jan14v1-04. pdf. (Archived by the Internet Archive at https://bit.ly/3s7oHMw)
- Beagrie, N. & Houghton, J. (2016). The value and impact of the European Bioinformatics Institute. Charles Beagrie Ltd. https://beagrie.com/static/resource/EBI-impact-summary.pdf (Archived by the Internet Archive at https://bit.ly/2NgEIAM)
- Bhardwaj, R. K. (2014). Institutional repository literature: a bibliometric analysis. Science & Technology Libraries, 33(2), 185-202. https://doi.org/10.1080/0194262X.2014.906018
- Houghton, J. & Beagrie, N. (2012). Economic impact evaluation of the economic and social data service. Economic & Social Research Council. https://esrc.ukri.org/files/research/research-and-impact-evaluation/economic-impact-evaluation-of-the-economic-and-social-data-service/
- Kejser, U. B. (2014). Evaluation of cost models and needs & gaps analysis. 4C Project. https://www.4cproject.eu/documents/D3.1_final_report_10May2014-v1.02.pdf (Archived by the Internet Archive at https://bit.ly/3bowPl8)
- Moody, D. L. & Walsh, P. (1999). Measuring the value of information-an asset valuation approach. In J. Pries-Heje, C.U. Ciborra, K. Kautz, J. Valor, E. Christiaanse, D.E. Avison, C. Heje, (Eds.), Proceedings, European Conference on Information Systems (ECIS’99) Copenhagen Business School, Copenhagen, Denmark 23-25 June 1999 (pp. 496-512). Copenhagen Business School. http://si.deis.unical.it/zumpano/2004-2005/PSI/lezione2/ValueOfInformation.pdf (Archived by the Internet Archive at https://bit.ly/3dqRzv6)
- Oakleaf, M. (2010). The value of academic libraries: a comprehensive research review and report. Association of College and Research Libraries.
- Rosenthal, D. S., Rosenthal, D. C., Miller, E. L., Adams, I. F., Storer, M. W. & Zadok, E. (2012). The economics of long-term digital storage. In L. Duranti and E. Shaffer, (Eds.). The Memory of the World in the Digital Age: Digitization and Preservation. 26-28 September 2012, Vancouver, British Columbia, Canada. (pp. 1330-1350). Unesco. https://www.ssrc.ucsc.edu/pub/rosenthal-unesco12.html (Archived by the Internet Archive at https://bit.ly/2ZsZRdC)
- Rosenthal, D. S. H. (2017). The medium-term prospects for long-term storage systems. Library Hi Tech. 35(1), 11-31. https://doi.org/10.1108/LHT-11-2016-0128
- Starr, S. & Williams, J. (2008). The long tail: a use analysis of pre-1993 print biomedical journal literature. Journal of the Medical Library Association, 96(1), 20-27. https://doi.org/10.3163/1536-5050.96.1.20
- Stemper, J. A. & Jaguszewski, J. M. (2003). Usage statistics for electronic journals: an analysis of local and vendor counts. Collection Management. 28(4), 3-22. https://doi.org/10.1300/J105v28n04_02
- Suber, P. (2005). Open access overview. Peter Suber. https://legacy.earlham.edu/~peters/fos/overview.htm (Archived by the Internet Archived at https://bit.ly/2Zy6qMa)
- Yoon, A. & Tibbo, H. (2012). Examination of data deposit practices in repositories with the OAIS model. IASSIST Quarterly, 35(4), 6-13. https://doi.org/10.29173/iq892 https://iassistquarterly.com/public/pdfs/iqvol35_tibbo.pdf (Archived by the Internet Archive at https://bit.ly/2OK3Y2K)
How to cite this paper
Appendices
| Subject | Subject full name |
|---|---|
| Agriculture | Agriculture |
| Animals | Animals (zoology) |
| Arts | Arts & sports, entertainment |
| Astronomy | Astronomy |
| Biology | Biology & life sciences |
| Building | Building & construction |
| Chemical | Chemical engineering |
| Chemistry | Chemistry |
| Computers | Computers, Internet & systems |
| Earth | Earth sciences & geology |
| Engineering | Engineering |
| Fossils | Fossils & prehistoric life |
| General | General reference, library & information science |
| History | History & geography |
| Home | Home & family management |
| Language | Language and literature |
| Management | Management & public relations |
| Manufacturing | Manufacturing (specific products) |
| Mathematics | Mathematics |
| Medicine | Medicine |
| Philosophy | Philosophy, psychology, religion |
| Physics | Physics |
| Plants | Plants (botany) |
| Science | Science |
| Social | Social sciences |
| Technology | Technology |
| Subject | ~ 2007 | 2008 | 2009 | 2010 | 2011 | 2012 | 2013 | 2014 | 2015 | 2016 | 2017 | 2018 | 2019 | Total |
|---|---|---|---|---|---|---|---|---|---|---|---|---|---|---|
| Agriculture | 21,048 | 2,223 | 4,781 | 39,245 | 8,745 | 4,420 | 4,807 | 4,354 | 8,399 | 7,067 | 3,554 | 2,473 | 2,317 | 113,433 |
| Animals | 2,953 | 217 | 422 | 553 | 349 | 384 | 284 | 421 | 142 | 249 | 255 | 153 | 274 | 6,656 |
| Arts | 4,698 | 549 | 1,126 | 13,087 | 1,156 | 1,035 | 619 | 1,018 | 790 | 2,623 | 954 | 809 | 1,493 | 29,957 |
| Astronomy | 3,806 | 394 | 1,662 | 1,480 | 499 | 615 | 759 | 502 | 508 | 956 | 581 | 365 | 119 | 12,246 |
| Biology | 12,332 | 1,156 | 2,528 | 2,842 | 2,070 | 1,252 | 930 | 1,189 | 826 | 1,302 | 1,134 | 954 | 985 | 29,500 |
| Building | 3,281 | 665 | 1,066 | 6,267 | 1,299 | 1,535 | 1,522 | 1,527 | 1,447 | 1,567 | 1,289 | 1,003 | 1,037 | 23,505 |
| Chemical | 19,959 | 2,323 | 4,225 | 18,795 | 2,851 | 2,561 | 2,465 | 3,697 | 2,107 | 3,872 | 2,381 | 1,993 | 2,213 | 69,442 |
| Chemistry | 5,413 | 973 | 1,322 | 3,387 | 7,463 | 1,447 | 1,294 | 1,273 | 1,971 | 406 | 380 | 595 | 236 | 26,160 |
| Computers | 20,474 | 2,515 | 5,218 | 6,748 | 3,359 | 4,484 | 3,240 | 4,084 | 2,526 | 4,596 | 3,860 | 3,347 | 2,791 | 67,242 |
| Earth | 3,604 | 626 | 937 | 511 | 678 | 650 | 765 | 676 | 1,247 | 807 | 553 | 548 | 512 | 12,114 |
| Engineering | 88,436 | 10,165 | 17,809 | 41,076 | 24,414 | 13,235 | 13,275 | 14,856 | 11,280 | 17,357 | 12,580 | 9,391 | 7,795 | 281,669 |
| Fossils | 0 | 0 | 0 | 0 | 0 | 0 | 0 | 0 | 60 | 370 | 78 | 108 | 96 | 712 |
| General | 2,164 | 421 | 669 | 14,645 | 550 | 318 | 270 | 525 | 235 | 594 | 386 | 370 | 876 | 22,023 |
| History | 1,226 | 95 | 1,246 | 646 | 271 | 275 | 951 | 302 | 294 | 336 | 229 | 142 | 130 | 6,143 |
| Home | 16,079 | 1,075 | 2,954 | 3,672 | 1,494 | 1,592 | 1,341 | 1,487 | 958 | 1,619 | 1,313 | 750 | 520 | 34,854 |
| Language | 1,611 | 81 | 170 | 81 | 457 | 88 | 184 | 84 | 63 | 116 | 48 | 44 | 48 | 3,075 |
| Management | 6,789 | 1,322 | 2,214 | 1,422 | 2,235 | 1,246 | 1,129 | 995 | 835 | 2,332 | 1,254 | 924 | 1,102 | 23,799 |
| Manufacturing | 11,301 | 1,333 | 3,770 | 10,658 | 2,140 | 3,021 | 2,307 | 1,950 | 1,232 | 2,305 | 1,591 | 1,167 | 1,053 | 43,828 |
| Mathematics | 8,884 | 1,266 | 1,704 | 1,100 | 1,306 | 1,038 | 1,187 | 1,693 | 2,654 | 1,671 | 1,657 | 1,428 | 1,845 | 27,433 |
| Medicine | 47,409 | 10,323 | 15,435 | 33,901 | 9,903 | 8,333 | 7,524 | 9,255 | 8,371 | 12,792 | 7,137 | 5,049 | 6,876 | 182,308 |
| Philosophy | 561 | 34 | 219 | 88 | 128 | 122 | 69 | 49 | 99 | 115 | 98 | 76 | 57 | 1,715 |
| Physics | 3,734 | 284 | 471 | 1644 | 270 | 267 | 247 | 283 | 193 | 299 | 252 | 176 | 198 | 8,318 |
| Plants | 4,175 | 219 | 387 | 267 | 401 | 393 | 359 | 272 | 369 | 620 | 332 | 427 | 470 | 8,691 |
| Science | 10 | 11 | 1,235 | 691 | 114 | 122 | 376 | 146 | 114 | 307 | 181 | 128 | 92 | 3,527 |
| Social | 14,588 | 2,018 | 6,076 | 22,291 | 14,378 | 3,478 | 2,795 | 3,385 | 3,357 | 6,035 | 3,183 | 4,137 | 3,026 | 88,747 |
| Technology | 1,093 | 150 | 261 | 4,950 | 16,858 | 456 | 404 | 338 | 438 | 606 | 247 | 1,440 | 211 | 27,452 |
| Total | 305,628 | 40,438 | 77,907 | 230,047 | 103,388 | 52,367 | 49,103 | 54,361 | 50,515 | 70,919 | 45,507 | 37,997 | 36,372 | 1,154,549 |
| Subject | ~ 2007 | 2008 | 2009 | 2010 | 2011 | 2012 | 2013 | 2014 | 2015 | 2016 | 2017 | 2018 | 2019 | Total |
|---|---|---|---|---|---|---|---|---|---|---|---|---|---|---|
| Agriculture | 70,813 | 4,423 | 4,066 | 4,411 | 4,467 | 4,157 | 3,906 | 3,814 | 3,502 | 3,096 | 2,826 | 2,379 | 1,611 | 113,471 |
| Animals | 3,746 | 275 | 312 | 306 | 314 | 351 | 259 | 318 | 182 | 218 | 128 | 158 | 89 | 6,656 |
| Arts | 18,311 | 1,128 | 1,019 | 1,144 | 1,176 | 1,123 | 1,039 | 1,020 | 930 | 862 | 880 | 799 | 526 | 29,957 |
| Astronomy | 5,786 | 574 | 720 | 542 | 577 | 817 | 471 | 512 | 717 | 540 | 593 | 315 | 86 | 12,250 |
| Biology | 17,145 | 997 | 1,076 | 1,288 | 1,283 | 1,149 | 890 | 1,000 | 960 | 1,048 | 891 | 970 | 710 | 29,407 |
| Building | 9,870 | 1,191 | 859 | 1,368 | 1,689 | 1,336 | 1,047 | 1,336 | 1,040 | 957 | 1,056 | 994 | 764 | 23,507 |
| Chemical | 40,850 | 2,702 | 2,966 | 2,901 | 2,797 | 2,762 | 2,298 | 2,640 | 2,165 | 2,478 | 1,953 | 1,857 | 1,122 | 69,491 |
| Chemistry | 14,846 | 1,094 | 1,501 | 1,472 | 1,483 | 1,508 | 1,273 | 1,150 | 404 | 413 | 240 | 587 | 189 | 26,160 |
| Computers | 27,185 | 3,168 | 3,504 | 3,532 | 3,490 | 3,624 | 3,565 | 3,570 | 3,385 | 3,515 | 3,592 | 3,050 | 2,182 | 67,362 |
| Earth | 5,889 | 560 | 487 | 502 | 523 | 548 | 552 | 590 | 516 | 514 | 531 | 524 | 378 | 12,114 |
| Engineering | 143,792 | 12,042 | 12,403 | 13,121 | 13,107 | 13,097 | 12,555 | 12,906 | 11,976 | 12,219 | 10,221 | 8,715 | 5,715 | 281,869 |
| Fossils | 0 | 46 | 49 | 42 | 45 | 33 | 42 | 34 | 73 | 84 | 79 | 115 | 70 | 712 |
| General | 17,087 | 588 | 482 | 408 | 426 | 421 | 376 | 388 | 360 | 442 | 398 | 369 | 278 | 22,023 |
| History | 2,926 | 365 | 392 | 320 | 325 | 311 | 306 | 309 | 265 | 239 | 153 | 149 | 91 | 6,151 |
| Home | 19,529 | 1,703 | 1,778 | 1,666 | 1,497 | 1,409 | 1,309 | 1,321 | 1,294 | 1,214 | 1,042 | 680 | 412 | 34,854 |
| Language | 2,019 | 101 | 158 | 127 | 129 | 103 | 68 | 84 | 100 | 62 | 53 | 47 | 24 | 3,075 |
| Management | 11,206 | 972 | 1,033 | 1,054 | 1,067 | 1,242 | 1,109 | 1,180 | 1,138 | 1,145 | 1,065 | 898 | 713 | 23,822 |
| Manufacturing | 25,424 | 1,884 | 1,707 | 1,649 | 1,743 | 1,736 | 1,682 | 1,869 | 1,689 | 1,447 | 1,114 | 1,106 | 791 | 43,841 |
| Mathematics | 12,632 | 1,128 | 1,230 | 1,237 | 1,183 | 1,036 | 1,168 | 1,149 | 1,238 | 1,248 | 1,466 | 1,509 | 1,267 | 27,491 |
| Medicine | 104,940 | 7,262 | 7,006 | 7,038 | 6,972 | 7,372 | 6,966 | 7,309 | 6,831 | 6,478 | 4,997 | 4,939 | 3,991 | 182,101 |
| Philosophy | 725 | 90 | 87 | 117 | 99 | 88 | 79 | 81 | 74 | 79 | 82 | 75 | 39 | 1,715 |
| Physics | 5,318 | 316 | 318 | 271 | 254 | 274 | 240 | 290 | 236 | 255 | 220 | 186 | 140 | 8,318 |
| Plants | 4,747 | 312 | 362 | 333 | 375 | 385 | 294 | 292 | 260 | 381 | 324 | 341 | 269 | 8,675 |
| Science | 1,643 | 181 | 175 | 165 | 169 | 190 | 166 | 145 | 178 | 164 | 165 | 124 | 62 | 3,527 |
| Social | 52,296 | 3,850 | 3,684 | 3,322 | 3,554 | 3,494 | 3,132 | 3,202 | 2,585 | 2,666 | 2,587 | 2,526 | 1,897 | 88,795 |
| Technology | 22,406 | 947 | 495 | 525 | 681 | 399 | 458 | 411 | 318 | 252 | 254 | 205 | 101 | 27,452 |
| Total | 641,131 | 47,899 | 47,869 | 48,861 | 49,425 | 48,965 | 45,250 | 46,920 | 42,416 | 42,016 | 36,910 | 33,617 | 23,517 | 1,154,796 |
| Publication year | 2013 | 2014 | 2015 | 2016 | 2017 | 2018 | 2019 |
|---|---|---|---|---|---|---|---|
| ~ 2007 | 330,184 | 350,596 | 313,362 | 414,519 | 267,845 | 260,056 | 256,773 |
| 2008 | 31,240 | 31,606 | 27,948 | 34,950 | 24,491 | 23,557 | 24,429 |
| 2009 | 32,266 | 32,516 | 28,728 | 35,774 | 25,070 | 24,111 | 25,250 |
| 2010 | 34,421 | 35,211 | 31,668 | 38,697 | 26,834 | 25,866 | 27,168 |
| 2011 | 35,860 | 35,992 | 32,247 | 39,738 | 27,623 | 26,749 | 27,659 |
| 2012 | 37,884 | 38,070 | 33,679 | 42,318 | 28,137 | 27,044 | 27,242 |
| 2013 | 16,922 | 35,676 | 32,613 | 41,055 | 28,076 | 26,697 | 26,517 |
| 2014 | - | 22,808 | 33,708 | 41,705 | 29,334 | 27,627 | 27,436 |
| 2015 | - | - | 13,693 | 40,680 | 28,025 | 26,368 | 26,276 |
| 2016 | - | - | - | 22,993 | 28,499 | 31,376 | 25,845 |
| 2017 | - | - | - | - | 16,106 | 26,273 | 24,397 |
| 2018 | - | - | - | - | - | 10,343 | 20,413 |
| 2019 | - | - | - | - | - | - | 11,458 |
| Total | 518,777 | 582,475 | 547,646 | 752,429 | 530,040 | 536,067 | 550,863 |
| Publication year | 2013 | 2014 | 2015 | 2016 | 2017 | 2018 | 2019 |
|---|---|---|---|---|---|---|---|
| ~ 2007 | 1,651,968 | 1,650,208 | 1,438,021 | 1,562,802 | 1,106,106 | 1,190,678 | 1,220,344 |
| 2008 | 265,423 | 235,737 | 180,322 | 181,331 | 133,517 | 140,258 | 143,452 |
| 2009 | 306,449 | 266,183 | 193,681 | 187,956 | 137,771 | 143,742 | 156,207 |
| 2010 | 413,542 | 342,658 | 244,966 | 219,404 | 154,967 | 161,171 | 176,295 |
| 2011 | 540,514 | 414,261 | 282,368 | 242,929 | 166,755 | 171,919 | 185,519 |
| 2012 | 775,769 | 553,519 | 354,334 | 289,999 | 187,297 | 186,720 | 197,336 |
| 2013 | 245,474 | 727,886 | 434,797 | 326,353 | 195,773 | 195,745 | 206,652 |
| 2014 | - | 322,193 | 548,561 | 380,177 | 218,628 | 214,444 | 224,528 |
| 2015 | - | - | 179,019 | 351,403 | 231,353 | 208,643 | 218,254 |
| 2016 | - | - | - | 160,560 | 300,144 | 266,684 | 243,099 |
| 2017 | - | - | - | - | 126,931 | 283,524 | 268,429 |
| 2018 | - | - | - | - | - | 57,553 | 196,597 |
| 2019 | - | - | - | - | - | - | 76,840 |
| Total | 4,199,139 | 4,512,645 | 3,856,069 | 3,902,914 | 2,959,242 | 3,221,081 | 3,513,552 |