A holistic framework to examine the impact of user, organizational and data factors on the use of big data analytics systems
Shin-Yuan Hung, Charlie C. Chen, Hoon Seok Choi, and Peter Ractham.
Introduction. More than 80% of big data projects have failed to meet project sponsors' expectations. This study adopts the technology-organization-environment model to provide a holistic framework to examine the key factors contributing to the success of business analytics projects.
Method. The paper develops a survey questionnaire consisting of thirty items on eight constructs, based on previous studies from cognitive-experiential self-efficacy, information technology mindfulness, technology-organization-environment, and information systems success theories. A total of 236 actual users in twenty organizations participated in the study.
Analysis. We employed structural equation modelling with partial least squares to test the proposed hypotheses.
Results. Our analysis shows that openness to novelty, the rational cognitive thinking style, organizational compatibility, organizational readiness, and data connectivity have a positive effect on the active use of big data analytics systems. Data compatibility does not emerge as a strong antecedent for frequency or duration. The active use of these types of applications is a mediating factor that can significantly improve individual job performance. Our findings provide insights into the user’s relative value, as well as organizational and data factors that can be used to promote big data analytics systems in an organization.
Conclusions. Our findings strongly suggest that such an integrative approach can help an organization understand the challenges of promoting big data analytics to use and improve employees' job performance.
DOI: https://doi.org/10.47989/irpaper915
Introduction
Advanced information technology drives up information volume, variety, velocity, veracity, variability, and viscosity (Abdrabo, et al., 2016). Organizations utilise big data analytics systems to cope with the challenge of processing the exploding amount of data, including social media, video, audio, images, text and 3D pictures). Big data analytics are faster and more efficient solutions than traditional business intelligent solutions to examine large amounts of these data to uncover hidden patterns, correlations, and insights (SAS, 2021). An effective use of these solutions can help a business reduce operational cost, make faster, better decisions, and even innovate new products and services. However, their adoption alone cannot result in competitive advantages if an organization does not have corresponding organizational assets (Grover, et al., 2018). An organization must utilise big data analytics technology cost-effectively to discover the relative values and be competitive. Big data analytics can also help to predict new business activities based on global economic indicators and use prescriptive analytics to make recommendations. An organization needs to quickly respond to changes in the business environment, based on all the analytics information (LaValle, et al., 2011).
Big data analytics empowers companies to uncover hidden knowledge, add new business values to the existing business practice, and make more informed business decisions (Cao, et al., 2015). Creating strategic business values and enhancing tactical organizational capabilities are its two primary value propositions (Grover, et al., 2018). For instance, big data analytics can analyse organizational performance by using functional departments and providing insights into the design of a dynamic organizational structure that can cope with rapid changes in the business environment. Offering customised products and services, based on shopping behaviour (e.g., recency, frequency, and monetary) can improve customer acquisition and retention, thereby increasing the bottom line. Some companies apply big data analytics to enhance supply chain efficiency (Tan, et al., 2015). Google Trends (https://trends.google.com), for example, is a tool that helps to predict the spreading velocity and direction of flu, stock prices, and software engineering (Xu, 2014).
Although big data analytics can help companies, only a few have successfully been implemented. A study by Caesarius and Hohenthal (2018) showed that the technology had a revolutionary impact on users and organizations, forcing users to change their routine and could even threaten their existence. Substantial change can result in users strongly resisting the use of big data analytics technology. The current literature focuses on concepts, technical aspects, and case studies. Al-Badi, et al. (2018), proposed that an organization should establish a big data analytics governance framework because information technology and sales departments face the challenge of effectively managing relevant applications. Such systems also create fundamental changes to human resources, the environment, and requisite expertise, and these non-technical factors need to be examined (Campos, et al., 2017). However, at a user level, there has been only limited research on this type of systems (Boldosova, 2019).
This study closes the research gap by examining the critical success factors for adopting big data analytics systems in organizations. The extant literature shows that various factors can contribute to the actual use of varying information systems. For instance, the awareness of technological capabilities, compatibility, and organizational regulations are antecedents for the use of web technology (Beatty, et al., 2001). Relative advantages, competitive pressure, and top management support are antecedents for small- and medium-sized firms that use information systems (Cragg and King, 1993). Information quality and system quality are critical for the use of information systems (DeLone and McLean, 2003). The success of data warehousing projects depends on organizational, technological, and project factors (Wixom and Watson, 2001). Zhu, et al., (2004) adopted the technology-organization-environment model to examine the critical success factors of e-business. Karimi, et al. (2007), investigated the importance of the information technology resources that are required to establish enterprise resource planning capability, as well as the sales process. Liang, et al., (2007) researched the impact of management and the external environment on enterprise resource planning implementations.
The success of big data analytics projects depends on creating strategic business values (Grover, et al., 2018). This study will extend the findings of previous information technology research to big data analytics projects. It aims to provide a holistic perspective on the success of big data analytics projects, based on our understanding of their challenges at the user, organization, and data levels.
The following sections will discuss the literature in these areas, followed by a proposed theoretical framework and related hypotheses. The data collection and analysis methods are examined in the research methodology, and this will be followed by a discussion of the significant findings, the study’s limitations, and future research directions.
Conceptual framework
User factors
The impact of openness to novelty on the actual use of big data analytics systems
Information technology’s openness to novelty has an enduring effect on a user's willingness to adopt and explore its value-adding applications (Thatcher, et al. 2018). Information technology mindfulness is a holistic psychological mindset that in a person open to novelty is a state of being both alert and aware of unique information technology capabilities and the usefulness in different contexts (Langer, 1989; Thatcher, et al., 2018). In addition, users with high information technology mindfulness are sensitive to new applications in different contexts and from different perspectives. They proactively use novelty technology after investigating its potential applications and even its failures (Dernbecher and Beck, 2017).
Some users are open to the novelty of big data analytics and are willing to investigate its features and value-adding application. In contrast, others are reluctant to accept this emerging technology. Being open to novelty in big data analytics systems is a voluntary state of mind that is critical in connecting awareness, motivation, cognition, and learning to the application (Salomon and Globerson, 1987) so that it can be creatively used to improve job performance. A lack of openness to novelty can reduce the attention given to big data analytics’ potential (Teo, et al., 2003) and eventually break the link between the different stages of its adoption and use. On the other hand, being more open to novelty can potentially heighten awareness of its potential and increase the amount of attention (Thomas, 2006) given to the positive experience using big data analytics; thereby promoting its implementation. Thus, we hypothesise that:
H1: Openness to novelty has a positive impact on the actual use of big data analytics technology.
The impact of the rational cognitive thinking style on the actual use of big data analytics systems
Human behaviour is influenced by two seamless but sometimes conflicting systems: feelings and thoughts (Denes-Raj and Epstein, 1994). The degree of the relative dominance of either of the systems will vary with the individual differences of users. Those who rely primarily on beliefs or rational systems to guide their behaviour tend to be more analytical and verbal, have intentions, and be relatively affect-free. On the other hand, users who rely primarily on feelings or the experiential system tend to be holistic, automatic, nonverbal, and are often associated with affect.
The parallel and interactive system, which consists of rational and experiential systems, dictates how people process information (Epstein, 1994) or adopt an information system. Users can also rely on either rational or experiential systems when they decide on whether to adopt big data analytics technology. Rational users often resort to a step-by-step analytical process to assess the strengths and weaknesses of big data analytics systems before adopting them. The process of adoption can be time-consuming. In contrast, experiential users are driven by affect and emotion and are often faster in making adoption decisions than rational users. Thus, we propose that:
H2: Rational cognitive thinking style has a negative impact on the actual use of big data analytics technology.
Organizational factors
The impact of organizational compatibility on the actual use of big data analytics systems
The alignment of information systems with the business is an ongoing challenge for companies as both the business environment and information systems are continually evolving. Organizational compatibility refers to the degree of fit after continual adjustments between business and information system across the different organizational levels, ranging from the strategic, process, operational, social, culture, and group level to the individual level (Benbya, et al., 2019). An information system with a high compatibility level is more likely to be adopted by users and collectively make a more significant organizational impact (Benbya, et al., 2019). Big data analytics systems with a high degree of organizational compatibility are more likely to be adopted by users as they can directly impact their performance (Chen, et al., 2015) and give a competitive advantage to the adopting organization. Thus, we propose that:
H3: Organizational compatibility has a positive impact on the actual use of big data analytics technology.
The impact of organizational readiness on the actual use of big data analytics systems
Organizational readiness refers to the synchronisation and coordination of people, processes, systems, and performance measurement (Greeff and Ghoshal, 2004). Big data analytics systems will bring changes to these elements of organizational readiness and the changes require an ongoing learning and adaptation process. An organization needs to allocate resources, establish information technology infrastructure (e.g., a data warehouse), and hire employees with the requisite business analytics skillsets (Aasheim, et al., 2009). Big data analytics systems do not pay off for many companies because of their low organizational readiness (Akter, et al., 2016). Thus, it is imperative to ensure that, for organizational readiness processes that drive and implement big data analytics, changed processes are put in place. Organizational readiness is indispensable to the adoption process (Chen, et al., 2015). Thus, we propose that:
H4: Organizational readiness has a positive impact on the actual use of big data analytics systems.
Data factors
The impact of data connectivity on the actual use of big data analytics systems
Technological factors, such as data connectivity and data compatibility, can directly contribute to the actual use of big data analytics systems, thereby creating organizational values (Chen, et al., 2015). A robust and scalable information technology infrastructure that can support a company's operational agility is critical to their positive development (Grover and Goslar, 1993; Kim, et al., 2012). Big data analytics adoption could be more successful if there was greater data connectivity across various platforms that enabled users to quickly integrate their work (Kim, et al., 2012; Thong, 1999). Hence, we propose the following hypothesis:
H5: Data connectivity has a positive impact on the actual use of big data analytics technology.
The impact of data compatibility on the actual use of big data analytics systems
Data quality is indispensable to the successful use of big data analytics systems because of the fundamental concept of Garbage in garbage out (DeLone and McLean, 2003). Data quality consists of at least four dimensions: data accuracy, timeliness, integrity, and readability. However, users would still not be motivated to use big data analytics systems if they knew that the data from various platforms were incompatible and could not be easily integrated. On the other hand, users are more inclined to use them when they know that the analytical results are based on combined data (Kwon, et al., 2014) that offer a global perspective and more possible insights. Business environments, such as corporate culture and data processing protocol, can influence data quality (Cai and Zhu, 2015), including data compatibility. The increase in the volume, variety, and velocity of data ensures that high data compatibility is challenging. Data compatibility is a scarce corporate asset in the Big Data era that can help promote big data analytics systems. Thus, we propose that:
H6: Data compatibility has a positive impact on the actual use of big data analytics technology
The effect of the actual use of big data analytics systems on individual impact
System use positively affects the net system benefits of improved individual or organizational performance (DeLone and McLean, 2003). On the other hand, improper use of information systems can have negative impact on individual (e.g., anxiety) and organizational performance (security breaches). Improper use of big data analytics can also lead to big privacy problems or security concerns (Ghasemaghaei, 2020). For instance, Facebook plans to terminate its face-recognition data analytics systems because more than 1 billion users’ faceprints has been collected and could be misused by governments, and third parties (Hill and Mac, 2021).
Despite these drawbacks, big data analytics systems can help uncover insights about management areas for improvement and help employees understand their work habits and team dynamics. Such an individual impact, empowered by big data analytics systems, can drive continual performance improvements. They can help collect more diversified data and generate a set of metrics to help users make smarter decisions. Hiring managers can also rely on descriptive and predictive analytics to make strategic hiring decisions. When users have a positive experience of using big data analytics systems, they are more likely to use them and improve their job performance (Ives, et al., 1983). The more often that they are used, the more individual impact the systems can have. Thus, we propose that:
H7: The actual use of big data analytics systems has a positive impact on individual impact.
The above discussion leads to the development of our research model (Figure 1):

Figure 1: Research model
Survey research method
Sampling and data collection
The survey method helps to answer research questions because our findings can be generalised to other big data analytics users. The research method is also cost-effective and reliable, given the limited research budget available for this research project. We will also address the weaknesses and inflexibility of the survey method, as well as its validity, by selecting our subjects discreetly and improving our survey questionnaire's validity, based on previously validated items and feedback from experts in the big data analytics field.
Specifically, we will modify and develop the questionnaire from previous studies that are resource-based and related to the technology-organization-environment and the diffusion of innovation theories. After completing the original survey instrument’s design, we conducted a pilot study with the information system faculty members, graduate students, and five big data analytics users. We solicited their feedback to improve the content’s validity and reliability. After conducting the pilot test, we distributed our survey to 236 users of big data analytics systems. We then ran the partial least squares structural equation modelling method to test the relationships between all the constructs of our research model. Our findings will provide insights into the relative value of these antecedents to promote the active use of big data analytics systems in an organization and improve the job performance of users.
Demographics
We conducted a two-step approach to identify subjects for our survey. First, we identified the top 1,000 companies, provided by the two leading recruitment online platforms in Taiwan, 104.com and 1111.com. Secondly, we contacted employees who are currently working for one of the top 1,000 companies. Each employee was asked to help collect five to tenquestionnaires from their company and other companies in the top 1,000 list. All the potential subjects answered the first question about whether their companies had already adopted a big data analytics application or were in the testing or evaluation stage. If the answer was no, the subject was directed to stop the survey. This mechanism prevented unqualified respondents from completing the study and confounding the findings of this study. We collected a total of 236 valid responses for testing the proposed model.
In the survey, we found around 71% of companies had adopted big data analytics applications and 29% of companies were in the testing or evaluation stages, indicating that the respondents have been exposed to big data analytics (Table 1). Most of the respondents were in the age groups of 20 to 29 (47.5%) and 30 to 39 (35.6%) years old. Regarding the sex of the respondents, 72% were male and 28% female. In terms of their education level, the majority had a higher degree than a bachelor’s (97%). The most significant number of samples were from large companies with more than 500 employees (64.8%). Information technology, research and development, and sales accounted for 74.15% of the respondents' business domains.
| Categories | Variables | Frequency (%) |
|---|---|---|
| Age | 20-29 years old | 112 (47.5) |
| 30-39 years old | 84 (35.6) | |
| 40-49 years old | 32 (13.6) | |
| 50-59 years old | 7 (2.9) | |
| 60 years old and above | 1(0.4) | |
| Sex | Female | 67 (28.3) |
| Male | 169 (71.7) | |
| Education | High school | 4 (1.7) |
| Vocational school | 3 (1.3) | |
| Bachelor | 66(28.0) | |
| Graduate degree | 153(64.8) | |
| Doctorate | 10(4.2) | |
| Business domain | Information technology | 104 (44.1) |
| Research and development | 47 (19.9) | |
| Sales | 24 (10.2) | |
| Manufacturing | 22 (9.3) | |
| Marketing | 15 (6.4) | |
| Human resources | 5 (2.1) | |
| Finance | 3 (1.3) | |
| Procurement | 2 (0.8) | |
| Others | 14 (5.9) | |
| Company size Employees | 500 or more | 153 (64.8) |
| 200-499 | 25 (10.6) | |
| 50-199 | 27 (11.4) | |
| 30-49 | 17 (7.2) | |
| Fewer than 30 | 14 (5.9) | |
| Big data analytics stage in Company | Adopted | 168 (71.1) |
| In adoption process | 68 (18.9) |
Data analysis
Reliability and validity of constructs
We adopted the existing items to measure this study's major constructs, as illustrated in Table 2. The questions for the constructs were placed on a 5-point Likert scale, ranging from 1, strongly disagree, to 5, strongly agree. Table 2 presents the constructs and their sources, including their loadings. We discarded items when the Cronbach's α value was lower than 0.7 (Guilford and Lyons, 1942; Hair, et al., 2009) to ensure their indicator reliability (Chin, 2010).
| Construct | Questions | Source |
|---|---|---|
| Openness to novelty | I like to investigate different ways of using big data analytics. | Thatcher, et al., 2018. |
| I am very curious about different ways of using big data analytics. | ||
| I like to figure out different ways of using big data analytics. | ||
| Rational cognitive thinking style | I do not like to have to do a lot of thinking. | Epstein, et al., 1996. |
| I try to avoid situations that require thinking in-depth about something. | ||
| I prefer to do something that challenges my thinking abilities rather than something that requires little thought. | ||
| I prefer complex to simple problems. Thinking long and hard about something gives me little satisfaction. | ||
| Organizational compatibility | The use of big data analytics systems is aligned with our company's business objectives. | Chen, et al., 2015. |
| The use of big data analytics systems fits our company's organizational culture. | ||
| Overall, it is easy to integrate big data analytics systems into our company's business process. | ||
| Organizational readiness (reverse coded) | To what extent are the following factors preventing your business unit from fully exploiting big data analytics? (1= Not at all... 3 = Somewhat 5 = To a great extent) | Chen, et al., 2015 |
| 1. Lacking capital/financial resources 2. Lacking the necessary information technology infrastructure 3. Lacking analytics capability 4. Lacking skilled resources | ||
| Data connectivity | Compared to rivals within our industry, our organization has the foremost available big data analytics systems and connections. | Kim, et al., 2012. |
| All remote, branch, and mobile offices are connected to the central office. | ||
| Our organization utilises open systems network mechanisms to boost connectivity. | ||
| There are very few identifiable communications bottlenecks within our organization. | ||
| Data compatibility | Big data analytics systems effectively integrate data from different areas of the company. | Nelson, et al., 2005. |
| Big data analytics systems pull together information that comes from different places in the company. | ||
| Big data analytics systems effectively combine data from different areas of the company. | ||
| Usage frequency & duration | How frequently are big data analytics systems used? | Urbach, et al., 2010. |
| How much time do I spend using big data analytics systems weekly? | ||
| Individual performance | Please assess the individual benefits that were derived from using your company's big data analytics systems. | Urbach, et al., 2010. |
| Big data analytics systems enable me to accomplish tasks quicker. | ||
| Big data analytics systems improve my job performance. | ||
| Big data analytics systems increase my productivity. | ||
| Big data analytics systems enhance my job effectiveness. | ||
| Big data analytics systems make it easier to accomplish tasks. | ||
| Big data analytics systems are useful for my job. |
We conducted reliability and validity tests before testing the proposed hypotheses using the constructs. We administered a measurement adequacy test using Bartlett's test of sphericity and the Kaiser-Meyer-Olkin measure of sampling adequacy statistics. All p-values for the constructs were smaller than 0.01 in Bartlett's test of sphericity, while Kaiser-Meyer-Olkin measures of the constructs were larger than 0.5, which indicates their measurement adequacy. We examined the validity and reliability of the items. Concerning internal consistency validity, Cronbach's alpha (α) of each construct's items was larger than 0.7, confirming the consistency validity. We estimated the average variance extracted of each construct and all the constructs had value larger than 0.5, which is larger than the cut-off of 0.5 (Fornell and Larcker, 1981; Hulland, 1999), suggesting sufficient convergent validity. We compared the construct's square root of the average variance extracted and the correlations with other constructs to check the discriminant validity. We found that all the average variance extracted values were higher than the correlations, indicating sufficient discriminant validity.
To test the item’s reliability, we tested both indicator reliability and composite reliability. Regarding indicator reliability, we estimated the factor loading of each item. We found two items, questions three and four of the data connectivity construct, had factor loadings that were lower than 0.7 on their constructs. These were both dropped from our analysis. The composite reliability test reported that the smallest composite reliability was 0.82, which is organizational readiness), confirming there was adequate composite reliability. Lastly, we estimated the variance inflation factors of the constructs to check multicollinearity. The highest value was 3.28 for individual performance), which is lower than the cut-off of 10 (Chin, 2010), indicating there was no multicollinearity in the constructs. Table 3 and Table 4 below summarise the details of the validity and reliability tests discussed.
| Construct | Kaiser-Meyer-Olkin Measure | Cronbach's α | Composite reliability | Average variance extracted | Variance inflation factor |
|---|---|---|---|---|---|
| Openness to novelty | 0.71 | 0.82 | 0.88 | 0.65 | 1.84 |
| Rational cognitive thinking style | 0.68 | 0.77 | 0.86 | 0.55 | 1.66 |
| Data connectivity | 0.66 | 0.78 | 0.86 | 0.56 | 1.76 |
| Data compatibility | 0.62 | 0.78 | 0.86 | 0.62 | 2.33 |
| Organizational compatibility | 0.57 | 0.75 | 0.85 | 0.58 | 1.86 |
| Organizational readiness | 0.73 | 0.82 | 0.82 | 0.56 | 1.98 |
| Usage frequence & duration | 0.50 | 0.90 | 0.95 | 0.73 | 2.03 |
| Individual performance | 0.85 | 0.93 | 0.91 | 0.76 | 3.28 |
| Construct | Openness to novelty | Cognitive thinking style | Data connectivity | Data compatibility | Organizational compatibility | Organizational readiness | Usage frequency and duration | Individual performance |
|---|---|---|---|---|---|---|---|---|
| Openness to novelty | 0.649 | |||||||
| Cognitive thinking style | 0.008 | 0.548 | ||||||
| Data connectivity | 0.001 | 0.010 | 0.557 | |||||
| Data compatibility | 0.057 | 0.003 | 0.380 | 0.616 | ||||
| Organizational compatibility | 0.025 | 0.017 | 0.448 | 0.337 | 0.579 | |||
| Organizational readiness | 0.025 | 0.042 | 0.005 | 0.001 | 0.010 | 0.559 | ||
| Usage frequency & duration | 0.052 | 0.015 | 0.110 | 0.032 | 0.177 | 0.042 | 0.732 | |
| Individual performance | 0.201 | 0.055 | 0.171 | 0.098 | 0.238 | 0.025 | 0.389 | 0.764 |
Structural model and hypothesis test results
We employed structural equation modelling with partial least squares to test the proposed hypotheses. Structural equation modelling is a reliable technique to test multiple causal relationships (Henseler, et al., 2009). It is not sensitive to issues about the population, scale of measurement, and residual distribution (Chin, 1998; Fornell and Bookstein, 1982).
Partial least squares regression was the statistical technique used for data analysis. Its major benefit is that it does not require data to be normally distributed and supports a smaller sample size for the analysis (Gefen, et al., 2000; Hair, et al., 2011). It is appropriate for this study because the Jarque-Bera test of normality (Jarque and Bera, 1980) was performed before the data analysis. This indicates that all the critical variables in the hypotheses were not normally distributed. Thus, it can provide more reliable results than the other covariance-based structural equation modelling techniques. Partial least squares regression analysis was performed in WarpPLS 5.0.
We collected data for all the survey constructs, including both dependent and independents, which may induce common method variance (CMV) to our data analysis.
Therefore, we conducted Harman's single-factor analysis to detect the variance to check this issue (Podsakoff, et al., 1984). We found either there was no factor emerging from the factor analysis or a common factor explaining more than 50% of the covariance (i.e., 23.68%). A chi-square difference test, that compared the original structural equation modelling and a common method factor, reported that the difference in chi-squared values was 749.84, with a difference of 98 in the degree of freedom. This suggested that the structural correlations were not affected by common-method variance (Liang and Xue, 2010).
After passing all the reliability and validity tests, we ran a structural equation modelling with partial least squares to test the proposed hypotheses. Our test results showed that openness to novelty explained 37% of the variance in the actual use of big data analytics systems at the 99% confidence level (t = 3.23; p<0.01), supporting Hypothesis 1. Rational cognitive thinking explained 19% of usage frequency variance and had a negative influence on usage frequency (t = -2.07; p<0.05), supporting Hypothesis 2. Organizational compatibility explained 53% of usage frequency variance and positively influenced usage frequency (t = 3.62; p<0.01), supporting Hypothesis 3. Organizational readiness explained 23% of the usage frequencyvariance and positively influenced usage frequency (t = 2.29; p<0.05), supporting Hypothesis 4. Data connectivity explained 44% of usage frequency variance and positively influenced usage frequency (t = 3.5; p<0.01), supporting Hypothesis 5. However, Data compatibility had no significantly positive effect on usage frequency (t = -1.41; p>0.1), rejecting Hypothesis 6. Usage frequency and duration explained 48% of the variance in individual performance (t = 9.04; p<0.01), which supports Hypothesis 7. Table 5 and Figure 2 summarise the results of the hypothesis tests.
As a result, there were six supported hypotheses (H1, H2, H3, H4, H5 and H7) and one hypothesis (H6) not supported as presented in Table 5.
| Hypothesis | Coefficient | t-statistics | p-value | Result |
|---|---|---|---|---|
| H1: Openness to novelty impacts actual use positively | 0.37 | 3.23 | 0.001 | Supported |
| H2: Rational thinking impacts actual use negatively | -0.19 | -2.07 | 0.038 | Supported |
| H3: Organizational compatibility impacts actual use positively | 0.53 | 3.62 | <0.000 | Supported |
| H4: Organizational readiness impacts actual use positively | 0.23 | 2.29 | 0.022 | Supported |
| H5: Data connectivity impacts actual use positively | 0.44 | 3.50 | <0.000 | Supported |
| H6: Data compatibility impacts actual use positively | -0.13 | -1.41 | 0.157 | Not Supported |
| H7: Actual use impacts individual performance positively | 0.48 | 9.04 | <0.000 | Supported |
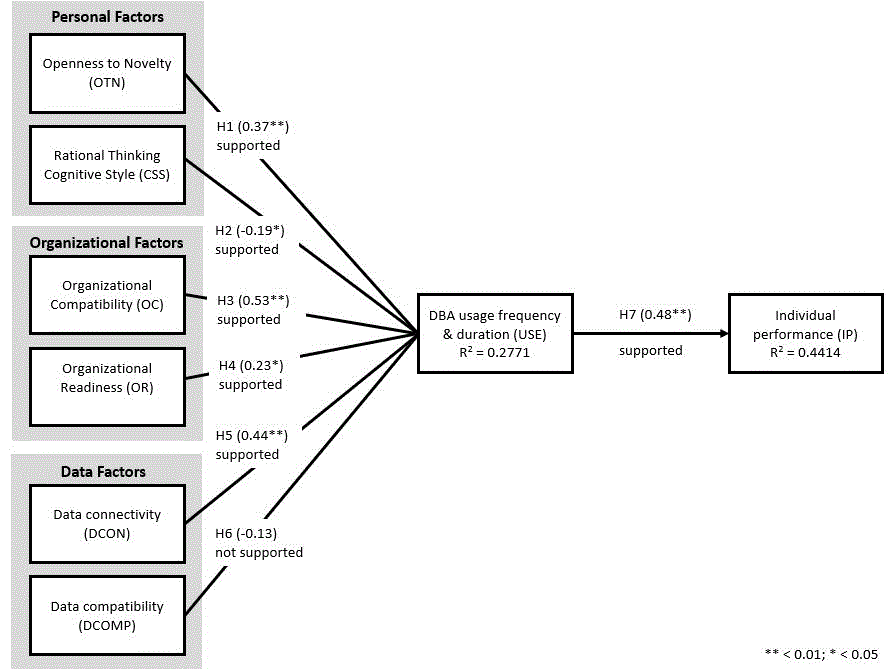
Figure 2: Hypothesis test results
Discussion
Academic implications
The literature on big data analytics has primarily focused on its adoption in response to the changing business environment, from an organizational perspective. Our research provides a holistic perspective of big data analytics adoption at three levels: personal, organizational, and data levels. Openness to novelty and a rational cognitive thinking style are personal factors that both positively and negatively impact big data analytics usage and frequency. Its use, measured by frequency and duration in this study, can be conceived as being the degree of engagement. Organizational compatibility, organizational readiness, and data connectivity are factors that have positive impacts on the actual use of big data analytics systems, whereas data compatibility does not affect their use.
The holistic perspective adopted in this study consists of six factors in three dimensions. The personal dimension includes openness to novelty and rational cognitive thinking style, and the organizational dimension includes organizational compatibility and organizational readiness. The technological dimension includes data connectivity and data compatibility. Unlike the previous study, which primarily examined big data analytics adoption from organizational perspectives, our study offers a balanced perspective and tries to provide insights into the relative influence of six factors on adoption at a user, organizational, and data level. If appropriately used, big data analytics has a positive impact on organizational competitiveness (Schryen, 2013). However, its adoption's high failure rate shows that issues are complex and multidisciplinary, involving operations, marketing, information management, organization, and other relevant areas (Sheng, et al., 2017). An organization can only achieve the potential benefits of big data analytics systems by firstly resolving the adoption issue. This study focuses on understanding the multi-faceted issues faced by users in the adoption process.
Increasing customer expectations and fierce industry competition have put businesses under constant pressure to sustain its profit and competitiveness. Companies are adopting big data analytics systems to exploit the exponential growth there is in the amount and variety of data, because they see it as a significant asset and the main source of competitiveness and innovation performance (Vassakis, et al., 2018). However, many of the companies adopting it have failed to implement big data analytics systems because they have ignored the importance of strategic integration (Asay, 2017). Strategic integration is needed to defuse clear business problems, build accurate analytics models, construct a data platform, adopt the right technology, and successfully execute big data analytics systems (Seth, 2018). This study offers an integrative approach and explains what could drive the frequent and extended use of these systems.
Practical implications
Organizational compatibility has the biggest impact on the use of big data analytics. This finding suggests that an organization needs a clear policy to ensure that systems are aligned with its culture, business objectives, and business process. For instance, an organization needs to invest in information technology infrastructure before it can use big data analytics systems. Much information technology infrastructure (such as distributed storage, stream analytics, data integration, data virtualisation, and shared databases) has little value, in isolation. However, information technology infrastructure can release the unlimited potential of big data analytics systems when it can help to both streamline the business process and achieve business objectives. The synergistic interaction of big data analytics systems with other organizations can give rise to new organizational systems over time and create significant organizational value (Someh and Shanks, 2013).
Cross-functional collaboration is essential for big data analytics systems' success because data structured linearly in each process need to be integrated across the business processes. Data resided in the silo department, and the singular process provides business analysts with low visibility on distributed business processes and business performance (Vera-Baquero, et al., 2013). Our findings further affirm the importance of improving data connectivity in promoting the use of big data analytics systems, which can provide meaningful real-time insights into multidisciplinary business problems when data is integrated across the business processes.
Big data analytics mindfulness shapes how users interact (Dane, 2011) because those with a high level of mindfulness feel that a heightened state of using big data analytics can be beneficial. In contrast, users with a low level of mindfulness may think otherwise. The overarching mental mindset drives a user's awareness of the values that can potentially be delivered by an information system (Thatcher, et al., 2018), such as big data analytics systems. Mindfulness can exert a relatively enduring, consistent effect on how long and often users utilise big data analytics systems to improve their job performance. Although information technology mindfulness is a personality trait with a stable, consistent impact, it is also malleable. It can be enhanced by positive experiences with information technology in different contexts (Thatcher and Perrewe, 2002). Training can also elevate users' mindfulness to higher levels (Jensen, et al., 2013). An organization should offer training opportunities and provide ample opportunities for users to apply big data analytics systems in different contexts. When users feel the breadth of impact, they are more likely to increase the duration and frequency of their big data analytics use.
Regarding the adoption of big data analytics systems, organizational readiness is as important as technological connectivity. An organization may want to assess the degree of organizational readiness when it is considering adoption. The assessment can include financial resources, information technology infrastructure, analytics capability, skilled resources, and agile project management culture. Our findings show that a higher degree of organizational readiness can empower an organization to fully exploit the potential of big data analytics systems.
A rational cognitive thinking style negatively affects the use of big data analytics systems. Our study shows that an organization may not want to target users with strong rational thinking because they may slow down the adoption process. On the other hand, the adoption process could be smoother if more intuitive employees were used as champions to launch its use.
Unlike previous studies, data compatibility does not affect big data analytics use. The previous study, Choi et al., 2021 considered data compatibility as one of the subdimensions of the technology dimension, but this subdimension alone may not have a significant effect on use. Data compatibility needs to be combined with the other subdimensions of management and big data analytics talent capability (e.g., planning, coordination, technical knowledge, business knowledge, and relational knowledge) to significantly impact users and organizations (Akter, et al., 2016). Big data analytics systems can further promote the active use of the systems when they are developed with user-centred ideas (Shin, 2016).
System usage is defined as either the amount of effort expended interacting with an information system or, less frequently, as the number of reports or other information products generated by the information system per unit time (Trice and Treacy, 1988, p. 33). Big data analytics systems are used routinely as they are designed to resolve semi-structured and unstructured business problems. Therefore, ensuring the nature, quality, and appropriateness of their use could be equally important (DeLone and McLean, 2003). This is necessary to assess whether they can improve the user's task performance or decision quality. An organization needs to make sure that big data analytics usage is voluntary (Kim and Lee, 1986). Under this condition, an organization should encourage more user adoption and improve personal job performance. When users have a positive evaluation of big data analytics usage, they will eventually have an organizational impact.
Future research directions
The general thrust of the research applies to all these aspects of business. Big data analytics can be used to examine phenomena of all management disciplines because it involves interaction of the entities with technology artifacts (Kar and Dwivedi, 2020). Data underpins the success of decisions made at individual, organizational, and society levels. This study provides a holistic framework to understand how the frequency and duration of big data analytics use can be used from the user, organizational, and data perspectives. However, the research model can only explain 27.71% of its use. Future studies should examine data accuracy, timeliness, integrity, and readability because they are essential elements that can significantly increase system usage and user satisfaction (DeLone and McLean, 2003).
User satisfaction is as important as system use because both indicators are often used to measure system success (DeLone and McLean, 2003). Future studies may want to examine the relationship between these two indicators in the context of big data analytics use. Organizational, technical, managerial, process, and data factors, could also play an influential role. Researchers interested in expanding our research model should consider how these factors could be conducive to the active use of big data analytics systems (Greeff and Ghoshal, 2004). As these systems are evolving with more advanced capabilities, researchers need to adopt a dynamic approach to assess what factors, such as organizational routines and organization-wide capabilities, could help increase adoption of radio-frequency identification (RFID) (Hossain and Quaddus, 2014). For instance, in the early adoption stage, information system managers can use a mandatory use environment to influence end-user dissonance levels to promote high compliance and use, according to dissonance theory (Rawstorne, et al., 1998). Researchers interested in understanding the effect of the environmental factor can seek tools, frameworks, and methodologies to assess the real impact of big data analytics on business processes and organizational performance.
Openness to novelty and rational cognitive thinking are individual factors that significantly influence big data analytics use. Big data analytics systems can transform both organizational routine and business processes (Caesarius and Hohenthal, 2018). Users accustomed to the organizational routine may not want to accept big data analytics enabled changes and resist their adoption (Lyytinen and Rose, 2003). Cognitive factors have a significant impact on the adoption of information technology (Epstein, 1991). Future research that is interested in the individual factors could research personal cognitive theories and investigate what individual cognitive factors, such as the need for cognition or faith in intuition, also affect big data analytics use and user satisfaction.
Limitations
We randomly distributed our survey to big data analytics users of the top 1,000 Taiwanese companies. To increase the participation rate, we asked executive MBA students to facilitate the distribution process via their social networks. The predefined criteria may have limited the data collected. Therefore, the findings can be best generalised to big data analytics users of the selected companies but there is a justification for the careful interpretation of a larger population's representativeness.
Subjects used in the study are limited to big data analytics users. The selection criteria created some issues with data collection. For instance, some who were interested in completing the survey did not know whether the systems they were adopting qualified as big data analytics systems. Although we have tried our best to explain to each subject, a few of the subjects may still have had some doubts while completing the survey. These subjects could not be excluded from the findings in this study and their potential influence on analysis results could not be assessed.
Organizational readiness (e.g., the people, process, technology, management, infrastructure) has a varying effect on big data analytics use. Users who participated in this study had different interpretations of how big data analytics was used, including the difficulties it tackled and the problems it could solve. As a result, the difference in organizational readiness may have affected how each participant answered the questions in the survey when they completed the study.
Conclusion
Many organizations have failed to implement big data analytics projects because of non-technical factors, such as unclear business objectives, a weak business case, management resistance and politics, poor communication, and a lack of skills. This study explores key user, organizational, and data factors and their contributions to the active use of business applications. Our findings strongly suggested that such an integrative approach can help an organization understand the challenges of promoting big data analytics to use and improve employees' job performance. System use and individual job performance are two critical success indicators. Organizational and data antecedents can help increase the success rate of big data analytics implementations.
Acknowledgements
We would like to thank Editor-in-Chief, Regional Editor, and the reviewers, for their time and effort to provide insightful comments and constructive suggestions to help us improve our research paper.
About the authors
Shin-Yuan Hung is a Professor in Management Information Systems in National Chung Cheng University, Taiwan. His research interests are in executive information systems, group decision support systems, applied artificial intelligence, and knowledge management. His contact address is syhung@mis.ccu.edu.tw
Charlie C. Chen received his Ph.D. degree in Management Information Systems from Claremont Graduate University. Dr. Chen is a Professor in the Department of Computer Information Systems and Supply Chain Management at Appalachian State University. His current research interests are business analytics, project management and supply chain management. His contact address is chench@appstate.edu
Hoon Seok Choi is an Associate Professor of Computer Information Systems in the Walker College of Business at Appalachian State University. He received his Ph.D. in Information Technology from the University of Texas at San Antonio, an M.A. from The University of Leeds in England. Prior to pursuing a career in academia, he worked for six years in the corporate sector. His research interests include e-business including mobile apps and online gaming, business data analytics, and cybersecurity. His contact address is choihs@appstate.edu
Peter Ractham (Corresponding Author) is an Associate Professor in the Department of MIS and a director of Center of Excellence in Operations and Information Management, Thammasat Business School, Thammasat University. His research focuses on ICT-enabled innovation, social media analytics and e-business. He holds a PhD in Information Systems & Technology from Claremont Graduate University, Claremont, USA. His contact address is Peter@tbs.tu.ac.th
References
Note: A link from the title is to an open access document. A link from the DOI is to the publisher's page for the document.
- Aasheim, C. L., Li, L., & Williams, S. (2009). Knowledge and skill requirements for entry-level information technology workers: a comparison of industry and academia. Journal of Information Systems Education, 20(3), 349-356. https://aisel.aisnet.org/jise/vol20/iss3/10 (Archived by the Internet Archive at https://bit.ly/3pDiQyD)
- Abdrabo, M., Elmogy, M., Eltaweel, G., & Barakat, S. (2016). Enhancing big data value using knowledge discovery techniques. International Journal of Information Technology and Computer Science, 8(1-12), 1-4. https://doi.org/10.5815/ijitcs.2016.08.01
- Akter, S., Wamba, S. F., Gunasekaran, A., Dubey, R., & Childe, S. J. (2016). How to improve firm performance using big data analytics capability and business strategy alignment? International Journal of Production Economics, 182, 113-131. https://doi.org/10.1016/j.ijpe.2016.08.018
- Al-Badi, A., Tarhini, A., & Khan, A. I. (2018). Exploring big data governance frameworks. Procedia Computer Science, 141, 271-277. https://doi.org/10.1016/j.procs.2018.10.181
- Asay, M. (2017, November 10). 85% of big data projects fail, but your developers can help yours succeed. TechRepublic. https://www.techrepublic.com/article/85-of-big-data-projects-fail-but-your-developers-can-help-yours-succeed/ (Archived by the Internet Archive at https://tek.io/3y4CcRb)
- Beatty, R. C., Shim, J. P., & Jones, M. C. (2001). Factors influencing corporate web site adoption: a time-based assessment. Information & Management, 38(6), 337-354. https://doi.org/10.1016/S0378-7206(00)00064-1
- Benbya, H., Leidner, D. E., & Preston, D. (2019). Information systems alignment. MIS Quarterly Research Curations. https://www.misqresearchcurations.org/blog/2019/3/14/information-systems-alignment
- Boldosova, V. (2019). Deliberate storytelling in big data analytics adoption. Information Systems Journal, 29(6), 1126-1152. https://doi.org/10.1111/isj.12244
- Caesarius, L. M., & Hohenthal, J. (2018). Searching for big data: how incumbents explore a possible adoption of big data technologies. Scandinavian Journal of Management, 34(2), 129-140. https://doi.org/10.1016/j.scaman.2017.12.002
- Cai, L., & Zhu, Y. (2015). The challenges of data quality and data quality assessment in the big data era. Data Science Journal, 14(2), 1-10. http://doi.org/10.5334/dsj-2015-002
- Campos, J., Sharma, P., Gabiria, U. G., Jantunen, E., & Baglee, D. (2017). A big data analytical architecture for the asset management. Procedia CIRP, 64, 369-374. https://doi.org/10.1016/j.procir.2017.03.019
- Cao, G., Duan, Y., & Li, G. (2015). Linking business analytics to decision making effectiveness: a path model analysis. IEEE Transactions on Engineering Management, 62(3), 384-395. https://doi.org/10.1109/TEM.2015.2441875
- Chen, D. Q., Preston, D. S., & Swink, M. (2015). How the use of big data analytics affects value creation in supply chain management. Journal of Management Information Systems, 32(4), 4-39. https://doi.org/10.1080/07421222.2015.1138364
- Chin, W.W. (1998). The partial least squares approach to structural equation modeling. In George A. Marcoulides (Ed.). Modern methods for business research (pp. 295-336). Psychology Press. https://doi.org/10.4324/9781410604385
- Chin, W. W. (2010). How to write up and report PLS analyses. In Vincenzo Esposito Vinzi, Wynne W. Chin, Jörg Henseler, & Huiwen Wang. (Eds.). Handbook of partial least squares (pp. 655-690). Springer. https://doi.org/10.1007/978-3-540-32827-8_29
- Choi, H. S., Hung, S.Y., Peng, C.Y., and Chen, C. (In press). Different perspectives on BDA usage by management levels. Journal Of Computer Information Systems. https://doi.org/10.1080/08874417.2020.1858729
- Cragg, P. B., & King, M. (1993). Small-firm computing: motivators and inhibitors. MIS Quarterly, 17(1), 47-60. https://doi.org/10.2307/249509
- Dane, E. (2011). Paying attention to mindfulness and its effects on task performance in the workplace. Journal of Management, 37(4), 997-1018. https://doi.org/10.1177/0149206310367948
- DeLone, W. H., & McLean, E. R. (2003). The DeLone and McLean model of information systems success: a ten-year update. Journal Of Management Information Systems, 19(4), 9-30. https://doi.org/10.1080/07421222.2003.11045748
- Denes-Raj, V., & Epstein, S. (1994). Conflict between intuitive and rational processing: when people behave against their better judgment. Journal of Personality and Social Psychology, 66(5), 819-829. https://doi.org/10.1037/0022-3514.66.5.819
- Dernbecher, S., & Beck, R. (2017). The concept of mindfulness in information systems research: a multi-dimensional analysis. European Journal of Information Systems, 26(2), 121-142. https://doi.org/10.1057/s41303-016-0032-z
- Epstein, S. (1991). Cognitive-experiential self-theory: an integrative theory of personality. In R. C. Curtis (Ed.). The relational self: theoretical convergences in psychoanalysis and social psychology (pp. 111-137). The Guilford Press. https://doi.org/10.1093/acprof:osobl/9780199927555.001.0001
- Epstein, S. (1994). Integration of the cognitive and the psychodynamic unconscious. American Psychologist, 49(8), 709-724. http://doi.org/10.1037//0003-066x.49.8.709
- Epstein, S., Pacini, R., Denes-Raj, V., & Heier, H. (1996). Individual differences in intuitive–experiential and analytical–rational thinking styles. Journal of Personality and Social Psychology, 71(2), 390-405. https://doi.org/10.1037/0022-3514.71.2.390
- Fornell, C., & Bookstein, F. L. (1982). Two structural equation models: LISREL and PLS applied to consumer exit-voice theory. Journal of Marketing Research, 19(4), 440-452. https://doi.org/10.2307/3151718
- Fornell, C., & Larcker, D. F. (1981). Structural equation models with unobservable variables and measurement error: algebra and statistics. Journal of Marketing Research, 18(3), 382-388. https://doi.org/10.2307/3150980
- Gefen, D., Straub, D., & Boudreau, M. C. (2000). Structural equation modeling and regression: guidelines for research practice. Communications of the Association for Information Systems, 4(1), Article 7. https://doi.org/10.17705/1CAIS.00407
- Ghasemaghaei, M. (2020). The role of positive and negative valence factors on the impact of bigness of data on big data analytics usage. International Journal of Information Management, 50, 395-404. https://doi.org/10.1016/j.ijinfomgt.2018.12.01
- Greeff, G., & Ghoshal, R. (2004). Practical e-manufacturing and supply chain management. Science Direct.
- Grover, V., & Goslar, M. D. (1993). The initiation, adoption, and implementation of telecommunications technologies in US organizations. Journal of Management Information Systems, 10(1), 141-164. https://doi.org/10.1080/07421222.1993.11517994
- Grover, V., Chiang, R. H., Liang, T. P., & Zhang, D. (2018). Creating strategic business value from big data analytics: a research framework. Journal of Management Information Systems, 35(2), 388-423. https://doi.org/10.1080/07421222.2018.1451951
- Guilford, J. P., & Lyons, T. C. (1942). On determining the reliability and significance of a tetrachoric coefficient of correlation. Psychometrika, 7(4), 243-249. https://doi.org/10.1007/BF02288627
- Hair, J. F, Black, W.C., Babin, B.J & Anderson, R.E. (2009). Multivariate data analysis. Pearson.
- Hair, J. F., Ringle, C. M., & Sarstedt, M. (2011). PLS-SEM: indeed a silver bullet. Journal of Marketing Theory and Practice, 19(2), 139-152. https://doi.org/10.2753/MTP1069-6679190202
- Henseler, J., Ringle, C. M., & Sinkovics, R. R. (2009). The use of partial least squares path modeling in international marketing. In Rudolf R. Sinkovics & Pervez N. Ghauri (Eds.), New challenges to international marketing (pp. 277-319): Emerald Group Publishing Limited. https://doi.org/10.1108/S1474-7979(2009)0000020014
- Hill, K., & Mac, R. (2021, November 2). Facebook, citing societal concerns, plans to shut down facial recognition system. The New York Times (https://www.nytimes.com/2021/11/02/technology/facebook-facial-recognition.html). (Archived by the Internet Archive at https://bit.ly/3DzBH2K).
- Hossain, M. A., & Quaddus, M. (2014). Mandatory and voluntary adoption of RFID. In J. Wang (Ed.). Encyclopedia of business analytics and optimization (pp. 1457-1475). IGI Global. https://doi.org/10.4018/978-1-4666-5202-6.ch132
- Hulland, J. (1999). Use of partial least squares (PLS) in strategic management research: a review of four recent studies. Strategic Management Journal, 20(2), 195-204. https://doi.org/10.1002/(SICI)1097-0266(199902)20:2<195::AID-SMJ13>3.0.CO;2-7
- Ives, B., Olson, M. H., & Baroudi, J. J. (1983). The measurement of user information satisfaction. Communications of the ACM, 26(10), 785-793. https://doi.org/10.1145/358413.358430
- Jarque, C. M., & Bera, A. K. (1980). Efficient tests for normality, homoscedasticity and serial independence of regression residuals. Economics Letters, 6(3), 255-259. https://doi.org/10.1016/0165-1765(80)90024-5
- Jensen, M., Dinger, M., Wright, R., & Thatcher, J. (2013). Training to mitigate threats from customized phishing attacks. Journal of Management Information Systems, 34(2), 597-626. https://doi.org/10.1080/07421222.2017.1334499
- Kar, A. K., & Dwivedi, Y. K. (2020). Theory building with big data-driven research – moving away from the "what" towards the "why". International Journal of Information Management, 54, Article 102205. https://doi.org/10.1016/j.ijinfomgt.2020.102205
- Karimi, J., Somers, T. M., & Bhattacherjee, A. (2007). The role of information systems resources in ERP capability building and business process outcomes. Journal of Management Information Systems, 24(2), 221-260. https://doi.org/10.2753/MIS0742-1222240209
- Kim, E., & Lee, J. (1986). An exploratory contingency model of user participation and MIS use. Information & Management, 11(2), 87-97. https://doi.org/10.1016/0378-7206(86)90038-8
- Kim, G., Shin, B., & Kwon, O. (2012). Investigating the value of sociomaterialism in conceptualizing IT capability of a firm. Journal of Management Information Systems, 29(3), 327-362. https://doi.org/10.2753/MIS0742-1222290310
- Kwon, O., Lee, N., & Shin, B. (2014). Data quality management, data usage experience and acquisition intention of big data analytics. International Journal of Information Management, 343), 387-394. https://doi.org/10.1016/j.ijinfomgt.2014.02.002
- Langer, E. J. (1989). Minding matters: the consequences of mindlessness–mindfulness. In Leonard Berkowitz (Ed.). Advances in experimental social psychology (pp. 137-173). Academic Press. https://doi.org/10.1016/S0065-2601(08)60307-X
- LaValle, S., Lesser, E., Shockley, R., Hopkins, M. S., & Kruschwitz, N. (2011). Big data, analytics and the path from insights to value. MIT Sloan Management Review, 52(2), 21-32.
- Liang, H., Saraf, N., Hu, Q., & Xue, Y. (2007). Assimilation of enterprise systems: the effect of institutional pressures and the mediating role of top management. MIS Quarterly, 31(1), 59-87. https://doi.org/10.2307/25148781
- Liang, H., & Xue, Y. L. (2010). Understanding security behaviors in personal computer usage: a threat avoidance perspective. Journal of the Association for Information Systems, 11(7), 394-413. https://doi.org/10.17705/1jais.00232
- Lyytinen, K., & Rose, G. M. (2003). The disruptive nature of information technology innovations: the case of internet computing in systems development organizations. MIS Quarterly, 27(4), 557-596. https://doi.org/10.2307/30036549
- Nelson, R. R., Todd, P. A., & Wixom, B. H. (2005). Antecedents of information and system quality: an empirical examination within the context of data warehousing. Journal of Management Information Systems, 21(4), 199-235. https://doi.org/10.1080/07421222.2005.11045823
- Podsakoff, P. M., Todor, W. D., Grover, R. A., & Huber, V. L. (1984). Situational moderators of leader reward and punishment behaviors: fact or fiction? Organizational Behavior and Human Performance, 34(1), 21-63. https://doi.org/10.1016/0030-5073(84)90036-9
- Rawstorne, P., Jayasuriya, R., & Caputi, P. (1998). An integrative model of information systems use in mandatory environments. In ICIS'98: Proceedings of the International Conference on Information Systems Helsinki, Finland, December, 1998. (pp. 325-330). Association for Information Systems.
- Salomon, G., & Globerson, T. (1987). Skill may not be enough: the role of mindfulness in learning and transfer. International Journal of Educational Research, 11(6), 623-637. https://doi.org/10.1016/0883-0355(87)90006-1
- SAS. (2021, November 23). Big data. What it is and why it matters. SAS Insights. https://www.sas.com/en_us/insights/big-data/what-is-big-data.html (Archived by the Internet Archive at https://bit.ly/3GmfxCX)
- Schryen, G. (2013). Revisiting IS business value research: what we already know, what we still need to know, and how we can get there. European Journal of Information Systems, 22(2), 139-169. https://doi.org/10.1057/ejis.2012.45.
- Seth, N. (2018, July 18). Analytics are a source of competitive advantage, if used properly. [Online forum comment]. Forbes.com. https://bit.ly/3311BQg. (Archived by the Internet Archive at https://bit.ly/3ydZCnq)
- Sheng, J., Amankwah-Amoah, J., & Wang, X. (2017). A multidisciplinary perspective of big data in management research. International Journal of Production Economics, 191, 97-112. https://doi.org/10.1016/j.ijpe.2017.06.006
- Shin, D.-H. (2016). Demystifying big data: anatomy of big data developmental process. Telecommunications Policy, 40(9), 837-854. https://doi.org/10.1016/j.telpol.2015.03.007
- Someh, I. A., & Shanks, G. (2013). The role of synergy in achieving value from business analytics systems. In Proceedings of Thirty Fourth International Conference on Information Systems, Milan, 2013. (pp. 4180 – 4195). SSRN.
- Tan, K. H., Zhan, Y., Ji, G., Ye, F., & Chang, C. (2015). Harvesting big data to enhance supply chain innovation capabilities: an analytic infrastructure based on deduction graph. International Journal of Production Economics, 165, 223-233. https://doi.org/10.1016/j.ijpe.2014.12.034
- Teo, H. H., Wei, K. K., & Benbasat, I. (2003). Predicting intention to adopt interorganizational linkages: an institutional perspective. MIS Quarterly, 27(1), 19-49. https://doi.org/10.2307/30036518
- Thatcher, J. B., & Perrewe, P. L. (2002). An empirical examination of individual traits as antecedents to computer anxiety and computer self-efficacy. MIS Quarterly, 26(4), 381-396. https://doi.org/10.2307/4132314
- Thatcher, J. B., Wright, R. T., Sun, H., Zagenczyk, T. J., & Klein, R. (2018). Mindfulness in information technology use: definitions, distinctions, and a new measure. MIS Quarterly, 42(3), 831-847. https://doi.org/10.25300/MISQ/2018/11881
- Thomas, D. C. (2006). Domain and development of cultural intelligence: the importance of mindfulness. Group & Organization Management, 31(1), 78-99. https://doi.org/10.1177/1059601105275266
- Thong, J. Y. (1999). An integrated model of information systems adoption in small businesses. Journal of Management Information Systems, 15(4), 187-214. https://doi.org/10.1080/07421222.1999.11518227
- Trice, A. W., & Treacy, M. E. (1988). Utilisation as a dependent variable in MIS research. ACM SIGMIS Database: the Database for advances in information systems, 19(3-4), 33-41. https://doi.org/10.1145/65766.65771
- Urbach, N., Smolnik, S., & Riempp, G. (2010). An empirical investigation of employee portal success. The Journal of Strategic Information Systems, 19(3), 184-206. https://doi.org/10.1016/j.jsis.2010.06.002
- Vassakis, K., Petrakis, E., & Kopanakis, I. (2018). Big data analytics: applications, prospects and challenges. In G. Skourletopoulos, G. Mastorakis, C. X. Mavromoustakis, C. Dobre, & E. Pallis. (Eds.). Mobile big data (pp. 3-20). Springer. (Lecture Notes on Data Engineering and Communications Technologies, vol 10) https://doi.org/10.1007/978-3-319-67925-9_1
- Vera-Baquero, A., Colomo-Palacios, R., & Molloy, O. (2013). Business process analytics using a big data approach. IT Professional, 15(6), 29-35. https://doi.org/10.1109/MITP.2013.60
- Wixom, B. H., & Watson, H. J. (2001). An empirical investigation of the factors affecting data warehousing success. MIS Quarterly, 25(1), 17-41. https://doi.org/10.2307/3250957
- Xu, S. Y. (2014). Stock price forecasting using information from Yahoo Finance and Google Trend. University of California Berkley. https://www.econ.berkeley.edu/sites/default/files/Selene%20Yue%20Xu.pdf (Archived by the Internet Archive at https://bit.ly/3y7SRDx)
- Zhu, K., Kraemer, K. L., & Dedrick, J. (2004). Information technology payoff in e-business environments: an international perspective on value creation of e-business in the financial services industry. Journal of Management Information Systems, 21(1), 17-54. https://doi.org/10.1080/07421222.2004.11045797