Identification and classification of evaluation indicators for scientific and technical publications and related factors
Hassan Mahmoudi Topkanlo, and Mehrdad CheshmehSohrabi
Introduction. Given the importance of the issue of the widespread impact of scientific and technical publications in today's world, and the diversity and multiplicity of indicators for measuring these publications, it is a necessity to classify these indicators from different angles and through different tools and methods.
Method. This study used documentary analysis and Delphi technique methods. The members of the Delphi panel were twenty-one experts in metric fields in information science who answered the research questionnaires several times until reaching a consensus.
Analysis. Kendall’s coefficient of concordance and a one-sample t-test were used to measure the agreement of the panel members as raters on the questionnaire items.
Results. A total of thirty-four sub-categories of indicators of assessment were identified which were categorised according to their similarities and differences into eight main categories as follows: measurement method, measurement unit, measurement content, measurement purpose, measurement development, measurement resource, measurability, and measurement environment.
Conclusions. Classification of the indicators of evaluation for scientific and technical publications and related factors can lead to improved understanding, critique, modelling and development of indicators. The findings of this study can be considered a basis for further research and help develop evaluative theoretical foundations in scientific and technical publications and related factors
DOI: https://doi.org/10.47989/irpaper953
Introduction
Several metric fields, such as bibliometrics, scientometrics, informetrics, webometrics, patentometrics, and altmetrics have already been developed in information science; some of which, like bibliometrics and scientometrics, overlap and some of which, like informetrics, bibliometrics, and scientometrics, are hierarchically related. In an article entitled ‘toward a basic framework for webometrics,’ Björneborn and Ingwersen (2004) described the relationships between cybermetrics, webometrics scientometrics, informetrics, and bibliometrics and emphasised the performance and use of such metrics in assessing technical and scientific publications. In each of these fields, indicators and criteria have been developed for the measurement and evaluation of scholarly and scientific publications in different aspects. Among them, the indicators and criteria of some of these fields such as bibliometrics and scientometrics, are completely related to scientific and technical publications and related factors, while indicators of other fields, including altmetrics and webometrics, are less and partially related to them.
These indicators can be placed in different categories. Some indicators are used to evaluate authors, such as the number of articles per person, the number of citations received, the H-index, or the G-index. Some indicators are, in turn, suitable for evaluating organisations, institutions and countries, such as the share of research outputs, the growth rate of scientific outputs, and the percentage of international collaboration. A number of indicators are likewise used to evaluate scientific and research articles, such as highly cited and hot papers, while others, such as impact factor, immediacy index, Source Normalized Impact per Paper (SNIP), and SCImago Journal Rank (SJR index), are for journal evaluation. There are also indicators used to measure the scientific status of a discipline or subject area, such as the degree of discipline scientific output and Discipline Impact Factor (DIF), while others, such as co-citation, self-citation, and citation network, measure different aspects of citing and citation issues (Waltman, 2016). Among scientometric indicators, some also measure different aspects of scientific and technical publications, such as the co-authorship index that is used to measure the level of scientific collaboration between individuals, organisations and countries. Besides, there are also a large number of indicators that were developed based on other indicators intending to improve and eliminate their shortcomings. Among the indicators proposed on the basis of H-index are: Y-index, G-index, A-index, M-index, AR-index, Π-index, HW-index, R-index, W-index, F-index, H(2)-index, T-index, Gh-index, X-index, Rm-index, V-index, B-index, weighted h-index and normalized h-index (Hirsch, 2005; Glänzel, 2006; Braun et al., 2006; Vinkler, 2009; Vîiu, 2016; Bihari et al., 2021).
Indicators can also be categorised in terms of quantity, quality, and quantity-quality. Quantitative indicators address the quantitative aspects of scientific and technical publications, such as the number of articles, the number of citations received, and the number of highly cited papers. Qualitative indicators, in turn, pay attention to qualitative aspects, including citation-based indicators such as Impact Factor (IF) and immediacy index. Hybrid indicators also arise mainly from composing and weighing several quantitative or qualitative indicators, such as SNIP index and Crown index.
Metrics and indicators have been variously classified by different organisations and experts. Figure 1 shows the trend of publication concerning the categorisations of evaluation indicators in scientific and technical publications.
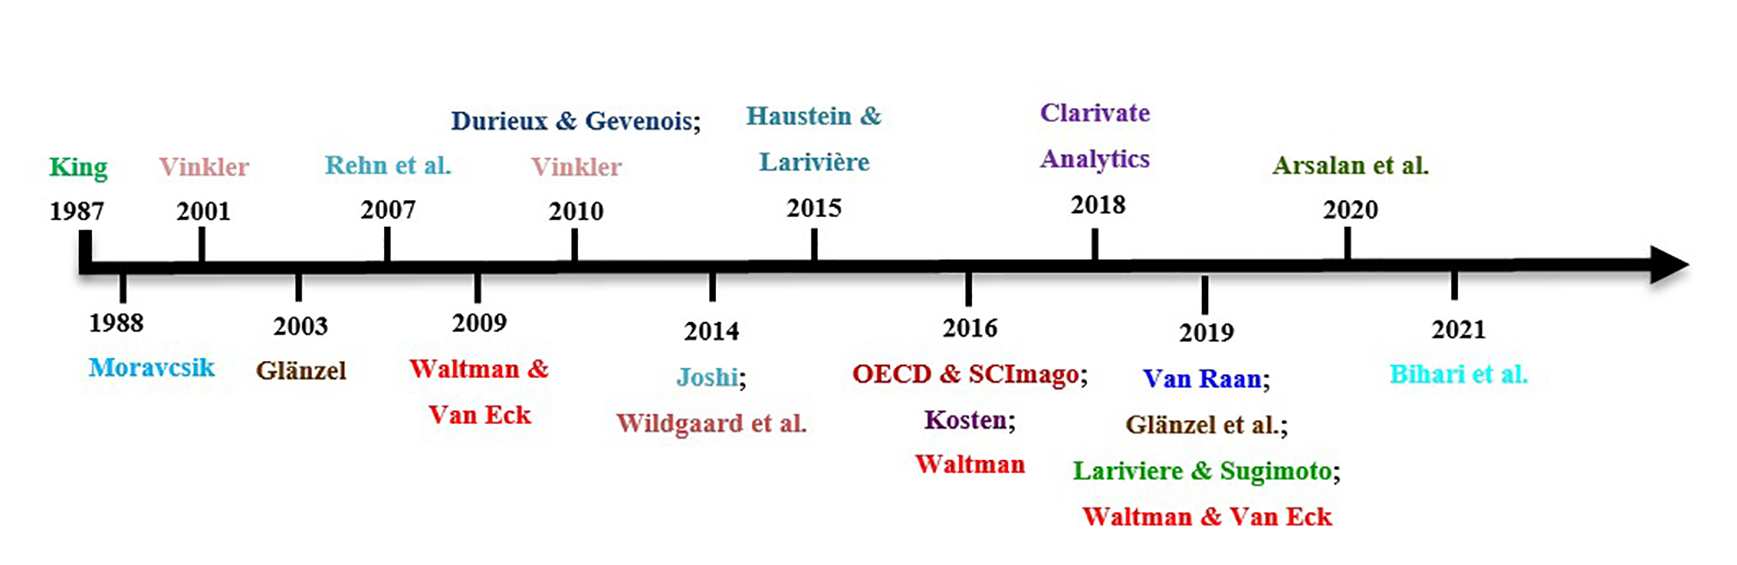
Figure 1: Conducted categorisations for the scientific-technical publication evaluation indicators
For the development trend of classifications regarding the evaluation indicators for scientific and technical publications, three periods can be considered, which are: 1) the initial, 2) the developing, and 3) the flourishing periods.
A. Initial period: Bibliometric indicators were first classified in 1987-1999. In this period, the bibliometric indicators were first classified in 1987 by Jean King who considered six classes: 1) publication counts, 2) citation analysis, 3) journal impact or influence, 4) co-citation analysis, 5) co-word analysis, and 6) bibliographic coupling. In 1988, Michael J. Moravcsik also categorised scientometric indicators based on their nature and function as follows: 1) activity, productivity, or progress; 2) quality (correctness, elegance, generality), importance (potential impact on science or society), or impact; 3) input or output of a scientometric system; 4) functional (about scientific research objectives) or instrumental (about methodological aspects), and 5) quantitative or qualitative, and databased or perceptual (made by peers or committees) (Vinkler, 2010, pp. 11-12).
B. Developing period: In the developing period (2000-2009), the evaluation indicators were further developed, and four important categorisations of such indicators were considered. First, Vinkler (2010) introduced a novel categorisation based on both formal and functional properties: 1) elements (publication, citation and reference, patent, potential (human capacity, grants, instrumentation, etc.)), 2) type (quantitative, impact, impact and quantitative), 3) level of assessment (micro, meso, and macro indicators), and 4) time (with or without time-dependency and with or without considering time dimension) (Vinkler, 2010, pp. 12-13). Second, in 2003, Glänzel divided bibliometric indicators into four classes as follows: 1) publication activity indicators (e.g., Relative Specialisation Index (RSI) and Activity Index (AI)), 2) citation impact indicators (e.g., impact factor), 3) scientific collaboration indicators (e.g., co-authorship), 4) Indicators and advanced data-analytical methods (e.g., bibliographic coupling and co-citation analysis). Third, Rehn, Kronman, and Wadskog (2007) considered five categories for bibliometric indicators: 1) publications, 2) citations, 3) cooperation, 4) journals, and 5) citation reference values. Finally, in 2009, Waltman and Van Eck categorised performance indicators (PIs) by emphasising publication and citation based on PIs mathematical features – as shown in Figure 2.
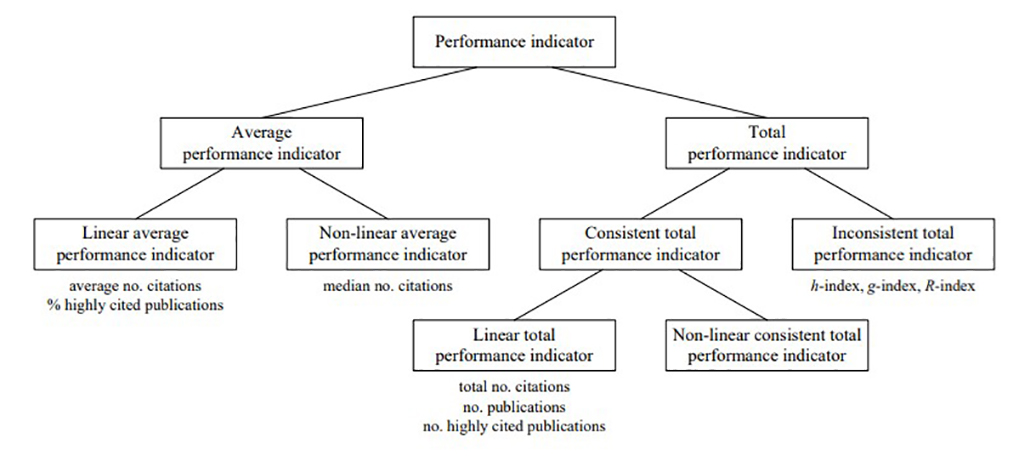
Figure 2: Bibliometric performance indicators taxonomy (Waltman and Van Eck, 2009, p. 3)
C. Flourishing period: From 2010 onward, and in fifteen works, the scientific and technical publications evaluation indicators have also been categorised from different perspectives. Durieux and Gevenois (2010) proposed three classes of bibliometric indicators: 1): quantity indicators to assess a given researcher productivity, 2) quality indicators to assess a scholar’s output quality or performance, and 3) structural indicators to assess associations between authors, publications, and research areas. Besides, Vinkler (2010) designed a taxonomy of evaluative indicators containing complex indicators, gross indicators, balance indicators, specific indicators, relative indicators, and contribution or distribution indicators. In 2014, Joshi considered two main clusters of indicators: 1) quantitative indicators to assess a scholar’s research productivity, and 2) performance indicators to assess publications quality. Wildgaard et al. (2014) divided 108 indicators for assessing an individual author’s performance into five clusters: 1) publication count indicators, 2) scholar and journal’s output qualification indicators, 3) output effect indicators, 4) author’s work ranking indicators, and 5) over-time impact indicators.
In 2015, Haustein and Larivière divided bibliometrics into simple (basic) and normalised indicators. In 2016, OECD and SCImago proposed a classification of scientific publication indicators, based on science fields and sectors. Besides, Kosten (2016) divided research indicators with twenty-one clusters into five major categories: 1) general science policy, 2) funding allocation, 3) management and organisation, 4) content decisions, and 5) consumer information. Waltman (2016) divided simple citation impact indicators into five classes: 1) total number of citations, 2) average number of citations per publication, 3) number of highly cited publications, 4) proportion of highly cited publications, and 5) h-index. The researcher divided the basic citation impact indicators into two classes of size-dependent and size-independent indicators. The former involved total number of citations, number of highly cited publications, and h-index, while the latter involved average number of citations per publication and proportion of highly cited publications. Besides, the author categorised journal citation impact indicators into four clusters: 1) journal basic citation impact indicators, 2) journal normalised citation impact indicators, 3) journal recursive citation impact indicators, and 4) citation impact of journals vs. citation impact of individual publications.
In 2018, Clarivate Analytics divided the indicators for benchmarking and analytics services of InCites into seven classes as follows: 1) journal citation reports, 2) institution profiles, 3) baselines, 4) impact, 5) percentile and percentage, 6) collaboration, and 7) ESI indicators. In 2019, Van Raan considered bibliometric indicators as vectors in 3-D space: 1) performers (e.g., individuals, research teams, academies, countries, or their combinations such as all the EU universities), 2) aspects (e.g., output, impact, collaboration, or their combinations like impact and output in international cooperation), and 3) subjects (themes of research, fields, journals, wider disciplines, and the whole of science). Glänzel and colleagues (2019) categorised science and technology indicators into two groups: 1) publication indicators and 2) patent indicators in general. Moreover, Lariviere and Sugimoto (2019) investigated journal impact factor and proposed two new categories: 1) Knock-off indicators, and 2) complementary/competitive indicators with the JIF having four subcategories: 1) Eigenfactor Metrics, 2) Source Normalised Impact per Paper (SNIP), 3) CiteScore, and 4) SCImago Journal Rank (SJR). Waltman and Van Eck (2019) divided field-normalised indicators into four clusters: 1) impact indicators founded upon normalised citation scores, 2) impact indicators upon percentiles, 3) impact indicators without a system of field classification, and 4) productivity indicators.
Arsalan et al. (2020) categorised research impact indicators in terms of scope and characteristics. Bihari et al. (2021) classified bibliometric and scientometric indicators into seven groups according to properties: 1) h-index complement, 2) total number of authors, 3) publication age, 4) combination of two indices, 5) excess citation count, 6) total publication count, and 7) other variables.
In view of the aforementioned, we might conclude that no comprehensive taxonomy has already been proposed for technical and scientific publications indicators in terms of the information science metrics. To bridge the gap, this study has sought to develop a more comprehensive taxonomy of indicators, regarding technical and scientific publications. By so doing, it is also hoped to obtain a better understanding, assessment, validation, and critique of the indicators and provide more education and research on them. Accordingly, this study has tried to evaluate, classify and define the characteristics of different criteria and indicators associated with scientific and technical publications.
Methods
Since this study aims to examine and categorise the evaluation indicators for scientific and technical publications, the two methods below are used for data collection:
A. Documentary analysis: At first, documentary analysis was used to identify different types of indicators used for evaluating scientific and technical publications and related factors. For this purpose, by examining various texts, articles and sources in the databases of Scopus and Web of Science, various common indicators used for evaluating scientific and technical publications were identified. In some texts, some classifications of indicators were already made, but we also identified other categories by studying the indicators more closely and examining their similarities, differences, and various functions. Consequently, in the first section, we investigated the categories and indicators used in the literature (e.g., Braun et al., 2006; Vinkler, 2009; Vîiu, 2016) several times to obtain an initial classification with thirty-one initial categories of indicators.
B. Delphi technique: The Delphi technique was used to obtain the opinions of experts in the metric fields on the identification and classification of indicators for scientific and technical publications using the following steps as described:
1) Selection of experts: The members of the Delphi panel were researchers, professors, and experts in the fields of bibliometrics, scientometrics, informetrics, webometrics, and altmetrics with five and more published papers. The experts were selected through purposive sampling. The purposive (judgmental) sampling “is the deliberate choice of a participant due to the qualities the participant possesses” (Etikan et al., 2016). Since the Delphi panel members were well-known scholars in the fields of metrics, an expert sampling approach (Etikan et al., 2016) was utilised. First, a list of all the Iranian experts in metrics fields was provided. Using their Google Scholar profiles, the experts with five or more publications in metrics fields (e.g., bibliometrics, scientometrics, informetrics, webometrics, and altmetrics) were then selected. As we emailed the experts a participation request, twenty-five experts finally agreed to cooperate in this research.
2) Number of the Delphi panel members: There is no consensus on the number of the Delphi panel, but in the literature, fifteen to twenty people are considered sufficient to conduct the Delphi study (Brady, 2015). In the present study, twenty-five experts agreed to take part in the study, from whom four people discontinued their participation in the research. Therefore, to conduct analysis, a total of twenty-one individuals consisting of two citation databases experts, three experts of research evaluation units in universities, seven instructors of metric fields, and nine metric fields scholars were considered as the members of the Delphi panel. In Table 1, the Delphi panel members profile is shown.
| N | Sex | Scientific degree | Field of study | Profession or Speciality |
|---|---|---|---|---|
| 1 | F | P | Metric fields | Teaching and research in scientometrics |
| 2 | M | P | Scientometrics | Editorial board member of a scientometric journal |
| 3 | M | R | Research evaluation | EHead of the scientometric office of a university |
| 4 | M | AP1 | Bibliometrics | Teaching and research in bibliometrics |
| 5 | M | AP2 | Webometrics | Teaching and research in bibliometrics and webometrics |
| 6 | F | R | Scientometrics | Research in scientometrics and bibliometrics |
| 7 | M | AP2 | Scientometrics | Head of the scientometric committee of a university |
| 8 | F | R | Metric fields | Research in metric fields |
| 9 | F | E | Bibliometrics | Work in an institute for science citation |
| 10 | M | E | Scientometrics | Work in an institute for science citation |
| 11 | M | AP | Bibliometrics | Research in scientometrics and bibliometrics |
| 12 | M | R | Scientometrics | Researcher of a research institute |
| 13 | M | R | Scientometrics | Member of the scientometric committee of a university |
| 14 | M | R | Metric fields | Expert in research evaluation in a university |
| 15 | M | P | Research evaluation | Teaching and research in scientometric |
| 16 | M | P | Metric fields | Expert in research evaluation |
| 17 | M | R | Research evaluation | Expert in research evaluation |
| 18 | M | R | Metric fields | Teaching and research in metric fields |
| 19 | M | R | Scientometrics | Research in scientometrics |
| 20 | M | AP2 | Bibliometrics | Teaching and research in scientometric |
| 21 | M | R | Webometrics | Expert in web |
F= Female, M= Male, P= Professor, AP1= Associate professor, AP2= Assistant professor, R= Researcher, E=Expert
3) Questionnaire formation: Using documentary analysis and based on thirty-one main pre-identified categories, the original questionnaire was made. For the questionnaire validation, five experts in the metrics field were consulted.
4) Reaching consensus in the Delphi panel: The most important point in research conducted by the Delphi technique is reaching consensus in opinions. In this regard, most experts consider it appropriate to repeat data collection three times (Brady, 2015; Skinner et al., 2015). Here, the Delphi technique was applied thrice.
First round: At this stage, a questionnaire about the thirty-one initial categories was given to Delphi panel members. In the questionnaire, each category is clearly defined and explained, and examples of indicators for each category are provided. We asked the opinion of the Delphi panel members about each category title: 1) the title is proper, 2) the title needs revision, and 3) the title is removed. The members’ views on the categories included rewriting and editing some titles, omitting one initial category, and forming four new ones.
Second round: After applying the comments of the panel members and editing the questionnaire, the new questionnaire, which included thirty-four categories, was sent back to the panel members. As such, we asked and received the panel members’ suggestions about modification of some categorical titles.
Third round: A questionnaire with thirty-four categories was designed and given to the panel members to state their agreement level with each category based on a 5-point Likert scale (from very high to very low). The members were asked to help us improve the categories by their suggestions or comments. They were also permitted to add any other category/categories to the questionnaire, if needed.
Moreover, the use of Kendall’s coefficient of concordance is recommended to measure the degree of consensus among the members of the Delphi panel (Brady, 2015; Humphrey-Murto et al., 2020). The closer the obtained Kendall’s coefficient is to one, the more consensus there is on the opinions, and coefficients higher than 0.7 indicate a strong consensus (Humphrey-Murto et al., 2020). Therefore, in the present study, the Kendall’s coefficient was used to examine the overall agreement on the indicators. However, given that the Kendall’s coefficient shows the degree of overall agreement among raters, for comparing the average level of agreement with each category, a one-sample t-test was used to compare the average of a population or sample to a set value (Norris et al., 2012; Wagner, 2019). Since the questionnaire items were based on a 5-point Likert scale, the experts’ level of agreement with each category was compared to the point 3 (the middle point of our Likert scale).
5) Ethical considerations: The experts were all notified about the research objective, and they sent us their informed consent to join in the study. The research procedures are in compliance with “the provisions of the Declaration of Helsinki” regarding research on human contributors.
Findings
As shown in Table 2, Kendall coefficient was employed to assess the panel members agreement with the proposed classification.
| Kendall’s Coefficient | Chi-squared | N | df | p-value |
|---|---|---|---|---|
| 0.747 | 517.864 | 34 | 34 | 0.00 |
According to the data in Table 2, the Kendall’s coefficient is 0.747, and the significance level is less than 0.05, indicating high agreement of experts on the classifications of indicators formed in the present study.
Table 3 shows the results of the one-sample t-test for each of the indicators.
| N | Subcategories | Mean | T-value | P-value | N | Subcategories | Mean | T-value | P-value |
|---|---|---|---|---|---|---|---|---|---|
| 1 | Quantitative indicators | 4.68 | 9.648 | 0.00 | 18 | Weighted indicators | 4.28 | 5.891 | 0.00 |
| 2 | Qualitative indicators | 4.61 | 11.090 | 0.00 | 19 | Normalised indicators | 4.14 | 4.650 | 0.00 |
| 3 | Hybrid indicators | 4.19 | 5.610 | 0.00 | 20 | Developmental indicators | 3.95 | 5.480 | 0.00 |
| 4 | Indicators of personal author | 4.38 | 7.864 | 0.00 | 21 | Reputation indicators | 4.05 | 4.932 | 0.00 |
| 5 | Indicators of corporate author | 4.01 | 5.123 | 0.00 | 22 | Indices based on general citation databases | 4.10 | 4.645 | 0.00 |
| 6 | Country Indicators | 3.90 | 5.396 | 0.00 | 23 | Indices based on specialised | 4.04 | 4.690 | 0.00 |
| 7 | Journal Indicators | 4.57 | 8.883 | 0.00 | 24 | Time-dependent indicators | 3.67 | 2.434 | 0.02 |
| 8 | Article Indicators | 4.68 | 9.648 | 0.00 | 25 | Time-independent indicators | 3.79 | 8.312 | 0.00 |
| 9 | Patent indicators | 3.38 | 2.930 | 0.04 | 26 | Size-dependent indicators | 3.66 | 3.347 | 0.003 |
| 10 | Book indicators | 3.52 | 3.012 | 0.008 | 27 | Size-independent indicators | 3.52 | 2.950 | 0.008 |
| 11 | Effectiveness indicators | 4.22 | 8.027 | 0.000 | 28 | Collaboration indicators | 3.81 | 3.600 | 0.002 |
| 12 | Discipline indicators | 4.47 | 9.954 | 0.000 | 29 | Content indicators | 4.15 | 5.435 | 0.000 |
| 13 | Thematic indicators | 4.10 | 4.600 | 0.000 | 30 | Structural indicators | 3.48 | 3.627 | 0.002 |
| 14 | Citation-based indicators | 4.14 | 5.754 | 0.000 | 31 | Altmetrics indicators | 4.02 | 4.583 | 0.002 |
| 15 | References-based Indicators | 3.71 | 4.423 | 0.003 | 32 | Web indicators | 3.57 | 2.882 | 0.01 |
| 16 | Productivity indicators | 4.19 | 7.728 | 0.000 | 33 | Online indicators | 3.56 | 2.434 | 0.012 |
| 17 | Numerical indicators | 3.69 | 3.433 | 0.003 | 34 | Macro-indicators | 3.86 | 3.873 | 0.001 |
According to the obtained t-values in Table 3, it can be concluded that the rate of agreement with all categories is above average (=3), showing a high agreement on the part of the panel members. In the following, before giving the final categories of indicators, a brief description of each of the initial categories is given. Note, however, that each of these categories is given with an emphasis on one feature of the indicators, so some indicators may fall into several categories at the same time. The thirty-four categories identified are as follows:
As can be seen in Table 2, the total Kendall coefficient obtained for all categories was higher than 0.7, which indicates the high agreement of experts on the categories of indicators. Of course, the larger the Kendall coefficient obtained, the greater the agreement.
1. Quantitative indicators. These indicators deal with the quantitative aspects of scientific and technical publications. Examining the status of scientific and technical publications only quantitatively, these indicators include the number of documents published by a country, the number of articles published by a person, the number of citations received by a person, and the like. Obviously, the number of these indicators is more than the mentioned cases, given that any indicator that can quantitatively evaluate the status of scientific and technical publications using numbers and figures falls in this area (Vinkler, 2010; Glänzel et al., 2019).
2. Qualitative indicators. Indicators that deal with the qualitative aspects of scientific and technical publications are mostly based on citations. They were indeed created to study the quality of scientific and technical publications, such as the number of citations received, IF and DIF.
3. Hybrid indicators. These indicators, which are a combination of one or more indicators, evaluate more specific aspects of scientific and technical publications, intending to strengthen the indicators through their combination; calculating the number of citations in a specific time period or subject area. Eigen factors Score, the Matthew effect and the Crown Index are considered as hybrid indicators (Vinkler, 2010; Glänzel et al., 2019; Waltman, 2016).
4. Indicators of personal author. These include indicators that evaluate the status of scientific and technical publications of individual writers and researchers. Indeed, any indicator that examines and evaluates the status of scientific and technical publications of individuals in some way falls into this category. They include the number of individual articles, the number of citations received by the individual and the individual H index.
5. Indicators of corporate author. These are indicators that evaluate the status of scientific and technical publications of organisations, universities and other scientific institutions. These indicators are similar to the indicators of the previous category, except that at the organisational level, they examine the status of scientific and technical publications. These indicators include the number of articles, the number of highly cited papers, and the H index of organisations.
6. Country Indicators. These indicators evaluate the status of scientific and technical publications of countries, including the amount of scientific production of a country, the number of journals of a country and the H index of the country. The comparison of the scientific situation of countries with each other is mainly based on these indicators.
7. Journal indicators. These indicators are indeed used for quantitative and qualitative evaluation of journals and comparison of different journals with each other. They include, but are not limited to, journal IF, SJR index and Eigen factors, as the number of journal indicators is much higher.
8. Article indicators. They evaluate the quantitative and qualitative status of articles and the unit of analysis in these indicators is articles, not individuals or organisations. Indicators such as the number of citations received by the article, highly cited and hot papers, and the like belong to this category.
9. Patent indicators. Indicators that gauge the quantitative and qualitative status of patents, such as the number of patents, and the number of citations to patents.
10. Book indicators. Indicators that measure the quantitative and qualitative status of books, including the number of published books, number of textbooks, and number of book citations.
11. Effectiveness indicators. These are indicators that use quantitative and/or qualitative metrics to evaluate the effectiveness of research, individuals, organisations, countries, documents, etc. from various aspects such as scientific, managerial, political, economic, social and cultural. Items such as examining the applicability of the research, the output of the research, the amount of budget received for the research, the interdisciplinary nature of the research and the like are among the items that have been mentioned to measure the effectiveness of research in various texts (Jin and Rousseau, 2004; Tseng et al., 2013).
12. Discipline indicators These indicators deal with evaluating the quantitative and qualitative status of scientific and technical publications in terms of scientific disciplines. They include DIF, and the number of documents in each discipline which are used to compare different disciplines.
13. Thematic indicators. These indicators gauge the status of scientific and technical publications in terms of thematic areas and are used to compare the publication status of different subject areas. Thematic indicators include the IF of a subject area, the number of documents in a subject area, and the number of journals in a subject area.
14. Citation-based indicators. These include all indicators that have been formed based on the number of citations to scientific and technical publications. Citation count is one of the most fundamental issues in the field of research assessment and evaluation and is used as the basis of many indicators, including qualitative indicators. There are many citation indicators, including IF index, H index and SJR index which are mainly based on the citation count.
15. References-based indicators. They examine the similarities and differences between the scientific documents, based on references to them. Items such as bibliographic coupling and co-citation coupling are of this type.
16. Productivity indicators. Indicators that measure the number of documents produced by an individual, organisation or country. In general, the emphasis of these indicators is on the number of publications, such as the number of articles, journals and books published.
17. Numerical indicators. These indicators evaluate the status of scientific and technical publications only by examining them quantitatively. Any comparison based solely on counting the number thus falls into this category, such as the number of authors, journals, and citations.
18. Weighted indicators. Formed by weighing criteria or other indicators, weighted indicators try to gain a more accurate evaluation of scientific and technical publications. An example is giving more points to articles published in top journals. Among these indicators mentioned in the research (Waltman, 2016; Wu et al., 2015) are Eigen Factor index and Y-index.
19. Normalised indicators.This index normalises the existing indicators by considering the discipline, subject area and the like to enable comparability between disciplines and subject areas, such as Impact per Publication (IPP), DIF and SNIP. In many studies, these types of indicators have been used to compare the status of scientific and technical publications in different disciplines (Waltman, 2016; Waltman and Van Eck, 2015).
20. Developmental indicators (based on other indicators). They were proposed for the purpose of developing the existing indicators, or eliminating their shortcomings. By accepting the existing indicators, developmental indicators try to improve them or increase their accuracy by making changes to them. For example, indicators such as M, R, E, π and F, and the like, which are based on the H index, are among developmental indicators that have been referred to in many studies (Vîiu, 2016; Alonso et al., 2009; Alonso et al., 2010).
21. Reputation indicators. They are used to examine the level of reputation, credibility and influence of scientific and technical publications and individuals. These indicators measure the reputation and credibility of scientific and technical publications from various aspects such as their rate of viewing, reading, receiving citations, purchasing, and the like. These indicators include the popularity factor, the consumption factor and the SJR index.
22. Indicators based on general citation databases. These are indicators that are used in a specific database or take their data from a specific database. In effect, these indicators refer to the indicators reported by each of the public citation databases, and in many cases the value obtained for the indicators in this database is different from those provided by Google Scholar, Web of Science, and Scopus. For example, the value of H index for a particular author is different in each of the listed databases because the thematic coverage of the databases, indexed journals, and how they are calculated in these databases are different. Many studies have noted differences between database indicators, including Scopus, Web of Science, and Google Scholar (Bar-Ilan, 2008; Mongeon and Paul-Hus, 2016).
23. Indicators based on specialised citation databases. In connection with the previous category, these indicators are used in specialised citation databases such as the two specialised databases in the field of mathematics, i.e., MathSciNet and ZbMath, and are very popular among the community of subject matter experts. The MCQ (Mathematical Citation Quotient) index which is presented in the Mathematics Abstracts is also used to evaluate journals. Likewise, the ZbMath database provides an index of authors' distance from core authors in a specialised subject area, indicating that an author interacts with core authors through several intermediaries. These two databases also have other indicators for evaluating scientific and technical publications and individuals. In general, in some subject areas, including mathematics, the use of specialised indicators is more valid and important to experts in that field (Ain et al., 2019).
24. Time-dependent indicators. They are used to evaluate the status of scientific and technical publications by considering publication time. Indeed, time-dependent indicators try to control the role of time; like the M index, which is obtained by considering the years of researcher activity based on the H index. Also, these metrics may increase over time, such as the number of articles published by a person which may increase over time but never decreases. Other time-dependent indicators include indices like the half-life, cited half-life, the Mean Citation Age (Vinkler, 2010).
25. Time-independent indicators.These indicators evaluate the status of scientific and technical publications regardless of the time of publication and are not necessarily affected by the time, i.e., the passage of time does not necessarily increase their amount, but it may even decrease over time. For example, two indicators of the journal IF and the average citation received by the journal do not necessarily increase with time, but may decrease over time (Vinkler, 2010).
26. Size-dependent indicators. Indicators that deal with the absolute count of scientific and technical publications, and a higher value indicates greater superiority. Some examples are the number of articles per person, and the total number of citations a person receives (Martin, 1996; Tahira et al., 2013).
27. Size-independent indicators. Dealing with the relative number of scientific and technical publications, these indicators measure the ratio of scientific and technical publications to a specific feature. For example, the ratio of one person highly cited papers to his/her total articles. When the goal is comparison, these indicators provide a better basis for comparison than size-dependent indicators (Tahira et al., 2013).
28. Collaboration indicators. Indicators that measure the status of collaboration between writers and researchers, organisations and the like. A few examples are co-authorship, co-citation, and degree, closeness, and betweenness centralities.
29. Content indicators. Examining scientific and technical publications in terms of content, these indicators mainly measure the similarity or difference in content between scientific texts, using co-words analysis, for instance. Many studies in the field of scientometrics are based on content indicators, including studies that measure the relationship between subject areas and interdisciplinary areas (Mingers and Leydesdorff, 2015).
30. Structural indicators. These indicators represent structural features such as the degree of interdisciplinarity or a high degree of specialisation in subject areas and journals. In effect, these indicators measure the status of scientific and technical publications of the disciplines according to the different context and structure of each discipline (Zhang et al., 2010). Among these indicators are the entropy indicator and isolation degree proposed by Zhang et al (2009) and Mañana-Rodríguez (2013), respectively, which are indeed used to examine the structural differences between the subject domains. For example, from their point of view, mathematics and law are among the disciplines that have a high degree of specialisation and isolation.
31. Altmetrics indicators. These are indicators that examine the status of scientific and technical publications on social networks such as Twitter, Mendeley, and Facebook (Haustein et al., 2014). One of these indicators is to calculate the number of mentions.
32. Web citation indicators. These indicators (such as the number of articles and journals viewed or downloaded on websites) examine the status of scientific and technical publications on the Web. Considering these indicators to be different from Altmetrics indicators, Thelwall and Kousha believed that Altmetrics indicators are only for social networks, but web citation indicators are used in the web environment (Thelwall and Kousha, 2015). However, some believe that these indicators are not considered as accurate scientific indicators, though they are useful for assessing the status of scientific and technical publications, especially in the non-scientific community (Thelwall, 2016).
33. Online indicators for non-standard academic outputs. These indicators are similar to the previous category, but unlike those indicators, whose emphasis is on credible scientific sources such as scientific research articles and journals, online indicators for non-standard academic outputs focus on other sources, such as educational files, manuscripts, photos, videos, softwares, and the like, measuring the extent to which a document can be used as a tutorial or guide (Thelwall, 2019).
34. Macro indicators. They measure more general aspects of scientific and technical publications and do not fall into the above categories. There are some indicators such as Bradford’s Law, Ziff’s Law, and Price’s Law representing larger issues that do not fall into any of the previous categories, but into this category. Macro indicators are indeed slightly different from the previous categories, however as they are also used for measurement, they were defined as a separate category.
These thirty-four categories, which were agreed upon by the experts, were again placed by researchers in several main categories, based on the similarities and the relationship between them so as to clarify their nature better. At this stage of the research, the members of the Delphi panel also expressed their views on the main categories, and finally a consensus of opinions was reached in eight general categories, as follows.
1) Measurement method. It refers to the method of collecting and analysing data for evaluating scientific and technical publications
2) Measurement unit. It refers to the subject under evaluation, which includes the person, organisation, and country to various scientific and technical publications, such as books, articles, journals, patents and the like.
3) Measurement content or basis. Each of the evaluation criteria, including data collection and analysis of scientific and technical publications, is based on a measure or concept. For example, many evaluations are based on citations, such as citation counts or analysis in scientific and technical publications.
4) Measurement purpose. Each of the indicators relies on a specific concept or feature. Likewise, each type of indicators for evaluating scientific and technical publications is presented for different purposes. Some indicators measure the amount of production, some measure the effectiveness of scientific and technical publications, while others measure the reputation and credibility of publications or owners of publications.
5) Measurement development. Many indicators used for evaluation of scientific and technical publications aim to improve the assessment method of scientific and technical publications. These indicators are intended to develop the method of evaluation. On this basis, measurement development refers to indicators that are based on other indicators, or intend to improve and eliminate the shortcomings of an indicator. Weighted, normalised and developed indicators were all presented for the purpose of measurement development.
6) Measurement source. It refers to the source of data collection. Common indicators for measuring scientific and technical publications are either based on data from public databases and websites such as Scopus, Google Scholar, ResearchGate, Web of Science, and the like, or the data received from specialised databases such as MathSciNet and other specialised databases.
7) Measurability. It includes time-dependent, time-independent, size-dependent, size-independent, and macro-indicators.
8) Measurement environment: It refers to the space or environment from which data were taken or analysed. Altmetrics, web and online indicators which fall into this category take their data from the Internet and cyberspace.
Table 4 shows these categories together with the obtained Kendall’s coefficients
| N | Main categories | Number of subcategories | Kendall’s Coefficient of Concordance (w) | Chi Squared |
|---|---|---|---|---|
| 1 | Measurement method | 3 | 0.711 | 64.248 |
| 2 | Measurement unit | 9 | 0.827 | 134.556 |
| 3 | Measurement content | 6 | 0.801 | 112.205 |
| 4 | Measurement purpose | 3 | 0.714 | 78.532 |
| 5 | Measurement development | 3 | 0.730 | 76.817 |
| 6 | Measurement source | 2 | 0.717 | 61.440 |
| 7 | Measurability | 5 | 0.709 | 114.754 |
| 8 | Measurement environment | 3 | 0.783 | 57.926 |
As can be seen in Table 4, for all the eight major categories, the Kendall coefficient is above 0.7, indicating a high agreement among Delphi members. The degree of experts' agreement about the placement of each sub-category under the main categories was calculated using a one-sample t-test and the comparison with the mean level (i.e., 3). Table 5 shows the results of the experts' agreement on the subcategories of each major category using the one-sample t-test.
| N | Main categories | Subcategories | Mean | Value t |
|---|---|---|---|---|
| 1 | Measurement method | Quantitative indicators | 4.56 | 8.329 |
| Qualitative indicators | 4.47 | 6.784 | ||
| Hybrid indicators | 4.44 | 7.122 | ||
| 2 | Measurement unit | Indicators of personal author | 4.63 | 8.902 |
| Indicators of corporate author | 4.58 | 5.354 | ||
| Country Indicators | 4.39 | 5.804 | ||
| Journal Indicators | 4.68 | 4.382 | ||
| Article Indicators | 4.68 | 4.914 | ||
| Patent indicators | 4.43 | 6.548 | ||
| Book indicators | 4.32 | 5.823 | ||
| Discipline indicators | 4.37 | 7.598 | ||
| Thematic indicators | 4.39 | 8.616 | ||
| 3 | Measurement content | Citation-based indicators | 4.08 | 7.261 |
| References-based Indicators | 3.79 | 4.495 | ||
| Collaboration indicators | 3.65 | 6.538 | ||
| Content indicators | 3.45 | 3.262 | ||
| Numerical indicators | 3.70 | 6.850 | ||
| Structural indicators | 3.52 | 4.288 | ||
| 4 | Measurement purpose | Productivity indicators | 4.22 | 5.944 |
| Effectiveness indicators | 4.36 | 8.478 | ||
| Reputation indicators | 4.28 | 9.226 | ||
| 5 | Measurement development | Weighted indicators | 4.61 | 7.683 |
| Normalised indicators | 4.57 | 8.772 | ||
| Development indicators | 4.48 | 6.144 | ||
| 6 | Measurement source | Indices based on general citation databases | 4.26 | 8.620 |
| Indices based on specialised citation databases | 4.10 | 4.119 | ||
| 7 | Measurability | Time-dependent indicators | 3.79 | 6.350 |
| Time-independent indicators | 3.67 | 3.522 | ||
| Size-dependent indicators | 3.88 | 9.603 | ||
| Size-independent indicators | 3.75 | 4.284 | ||
| Macro-indicators (Laws) | 3.34 | 2.808 | ||
| 8 | Measurement environment | Altmetrics indicators | 4.29 | 9.657 |
| Web indicators | 4.14 | 8.373 | ||
| Online indicators | 4.16 | 8.416 |
As can be seen in Table 5, for all subcategories, the mean is higher than the mean level (i.e., 3), which indicates that the Delphi members agreed with the placement of the subcategories in the table. It is important to note that some of these subcategories can be grouped into several main categories at the same time, though according to the view of the panel members, the most relevant and appropriate category was selected for them. The goal was indeed to identify different types of indicators and categories to gain a better understanding of them.
Discussion and conclusion
There are currently various indicators of assessment and evaluation for scientific and technical publications, each of which measures a specific aspect of scientific and technical publications. Classification of these indicators can indeed help better identify, critique, develop and use indicators. Therefore, in the present study, we decided to categorise various indicators of scientific and technical publications using the Delphi method and the views of experts in the metric fields. According to the research findings, thirty-four sub-categories of indicators were obtained, each of which has specific characteristics, goals and applications. Naturally, there are also similarities and connections between these categories. For example, some journal features can be qualitative, citation-based, or developmental. In other words, the categorisation made represents the different types or aspects of the indicators, but this does not mean that each category is completely different and has no relation to the other categories.
Although no research has specifically been done to categorise all of the available indicators, some previous studies have addressed a number of these categories. In his studies, for example, Vinkler (2010, 2009) referred to simple, complex, time-dependent, time-independent, quantitative, and qualitative indicators. Waltman (2016) reviewed and categorised some citation impact indicators in two classes of size-dependent (e.g., total number of citations, number of highly cited publications, and h-index), and size-independent (e.g., average number of citations per publication and proportion of highly cited publications) indicators. Gl&aum;nzel et al have also introduced various scientometric indicators such as citation, normalised, Altmetrics, and Web indicators. Notably, in these studies reported, no classification is done, but only indicators are introduced (Gl&aum;nzel et al., 2019). In this regard, in some studies, normalised and weighted indicators, or some other indicators, have been suggested (Waltman, 2016; Wu et al., 2015; Waltman and Van Eck, 2015). Also, in many articles, the indicators of the discipline and the subject have been discussed, and in some cases, some have tried to provide indicators to measure the status of the disciplines or subjects (Waltman and Van Eck, 2015; Bornmann, 2014). Many other studies have attempted to develop the existing indicators, including studies on the H-index. As such, numerous indicators based on the H-index have already been proposed, some of which were mentioned earlier (Vîiu, 2016; Alonso et al. 2009; Alonso et al., 2010; Bornmann, 2014, Bihari et al., 2021).
Although many studies have already sought to categorise assessment indicators for scientific and technical publications, they have generally studied, compared or categorised the indicators from a specific and limited perspective. In this regard, it can be said that the strength of the present study is that it has tried to provide all possible classifications for indicators in both subcategories and main ones. In the sub-categories thirty-four indicators, and in the main categories eight indicators, were thus identified and introduced, respectively.
These eight main categories included measurement method, measurement unit, measurement content, measurement purpose, measurement development, measurement source, measurability, and measurement environment, each of which forming several sub-categories. In effect, from the point of view of Delphi panel members, the existing indicators for measuring scientific and technical publications can be grouped into these eight categories. It seems that such a classification of indicators has not been made in previous studies.
In a way, it can be concluded that these eight main categories actually show the nature of the indicators used for the evaluation of scientific and technical publications, given that each indicator can be placed in one or more categories. For example, an index such as the H index can be quantitative in terms of method; as an individual and organisational creation in terms of the unit of measurement for articles; citation-based in terms of measurement contents; in terms of purpose, it can seek to measure productivity or effectiveness; and in terms of measurement source, its data can be taken from general or specialised databases.
In the same way, other indicators can be placed in these categories, and depending on the type of the indicator, it can be placed in one or several categories. These eight categories can also be considered as eight subject areas in the field of informetrics. In other words, researchers and experts in the metric fields can plan their studies on indicators based on these eight categories. On the other hand, training and using indicators will be easier when they come in specific categories. Therefore, this classification can also be used as a conceptual model for teaching indicators in the field of informetrics.
Overall, with a different look at the indicators used for the evaluation of scientific and technical publications, as well as the related factors, the present study classified them into thirty-four sub-categories and eight main categories, providing a more accurate framework for studying, evaluating, and using these indicators in the fields of informetrics, scientometrics, and bibliometrics. As for further research, researchers and experts in the field of scientometrics can limit their studies to any of these categories according to their goals and interest. These categories can also be expanded or the conceptual and hierarchical relationships between them can be examined in future research.
About the authors
Dr Hasan Mahmoudi Topkanlo, a Postdoc researcher in scientometrics at the Department of Knowledge and Information Science, University of Isfahan. Now he is an assistant professor in the Department of Knowledge and Information Science, Faculty of Psychology and Educational Sciences, Semnan University, Iran. His research focuses on information behaviour, information culture, knowledge sharing, and scientometrics. Contact e-mail address: hmahmoudi@semnan.ac.ir
Dr Mehrdad CheshmehSohrabi is currently a professor at the Department of Knowledge and Information Science, University of Isfahan. In 2006, he completed his Ph.D. in Information and Communication Sciences from Stendhal University, France. His research interests are in information retrieval, bibliometrics, research evaluation, research ethics, data mining, information management, and semantic web. He is the corresponding author and can be contacted at: mo.sohrabi@edu.ui.ac.ir
References
- Ain, Q.U., Riaz, H. & Afzal, M.T. (2019). Evaluation of h-index and its citation intensity based variants in the field of mathematics. Scientometrics, 119(1), 187-211. https://doi:10.1007/s11192-019-03009-y
- Alonso, S., Cabrerizo, F.J., Herrera-Viedma, E. & Herrera, F. (2009). H-Index: a review focused in its variants, computation and standardization for different scientific fields. Journal of informetrics, 3(4), 273-289. https://doi.org/10.1016/j.joi.2009.04.001
- Alonso, S., Cabrerizo, F.J., Herrera-Viedma, E. & Herrera, F. (2010). Hg-index: a new index to characterize the scientific output of researchers based on the h-and g-indices. Scientometrics, 82(2), 391-400. https://doi:10.1007/s11192-009-0047-5
- Arsalan, M., Mubin, O. & Al Mahmud, A. (2020). Evidence-based nomenclature and taxonomy of research impact indicators. Journal of Data and Information Science, 5(3), 33-56. https://doi.org/10.2478/jdis-2020-0018
- Bar-Ilan, J. (2008). Which h-index?—A comparison of WoS, Scopus and Google Scholar. Scientometrics, 74(2), 257-271. https://doi.org/10.1007/S11192-008-0216-Y
- Bihari, A., Tripathi, S. & Deepak, A. (In press). A review on h-index and its alternative indices. Journal of Information Science, https://doi.org/10.1177/01655515211014478
- Björneborn, L. & Ingwersen, P. (2004). Toward a basic framework for webometrics. Journal of the American Society for Information Science and Technology, 55(14), 1216–1227. https://doi:10.1002/asi.20077
- Bornmann, L. (2014). H-Index research in scientometrics: a summary. Journal of Informetrics, 8(3), 749–750. https://doi:10.1016/j.joi.2014.07.004
- Brady, S.R. (2015). Utilizing and adapting the Delphi method for use in qualitative research. International Journal of Qualitative Methods, 14(5), 1-6. https://doi.org/10.1177/1609406915621381
- Braun, T., Glänzel, W. & Schubert, A. (2006). A Hirsch-type index for journals. Scientometrics, 69(1), 169-173. https://doi.org/10.1007/s11192-006-0147-4
- Clarivate Analytics. (2018). InCites indicators handbook. Clarivate Analytics.
- Durieux, V. & Gevenois, P. A. (2010). Bibliometric indicators: quality measurements of scientific publication. Radiology, 255(2), 342-351.https://doi.org/10.1148/radiol.09090626
- Etikan, I., Musa, S.A. & Alkassim, R.S. (2016). Comparison of convenience sampling and purposive sampling. American Journal of Theoretical and Applied Statistics, 5(1), 1-4.
- Glänzel, W. (2003). Bibliometrics as a research field a course on theory and application of bibliometric indicators. Course Handouts.
- Glänzel, W. (2006). On the h-index – a mathematical approach to a new measure of publication activity and citation impact. Scientometrics, 67, 315–21. https://doi.org/10.1007/s11192-006-0102-4
- Glänzel, W., Moed, H.F., Schmoch, U. & Thelwall, M. (2019). Springer handbook of science and technology indicators. Springer.
- Haustein, S. & Larivière, V. (2015). The use of bibliometrics for assessing research: possibilities, limitations and adverse effects. In Welpe, I., Wollersheim, J., Ringelhan, S., Osterloh, M. (eds) Incentives and performance (pp. 121-139). Springer, Cham. https://doi.org/10.1007/978-3-319-09785-5_8.
- Haustein, S., Peters, I., Sugimoto, C.R., Thelwall, M. & Larivière, V. (2014). Tweeting biomedicine: an analysis of tweets and citations in the biomedical literature. Journal of the Association for Information Science and Technology, 65(4), 656-669. https://doi.org/10.1002/asi.23101
- Hirsch, J.E. (2005). An index to quantify an individual’s scientific research output. Proceedings of the National Academy of Sciences of the United States of America, 102(46), 16569–16572. https://doi.org/10.1073/pnas.0507655102
- Humphrey-Murto, S., Wood, T.J., Gonsalves, C., Mascioli, K. & Varpio, L. (2020). The delphi method. Academic Medicine, 95(1), 168. https://doi.org/10.1097/ACM.0000000000002887
- Jin, B. & Rousseau, R. (2004). Evaluation of research performance and scientometric indicators in China. In Moed, H.F., Glänzel, W., Schmoch, U. (eds) Handbook of quantitative science and technology research (pp. 497-514). Springer, Dordrecht.https://doi.org/10.1007/1-4020-2755-9_23
- Joshi, M. A. (2014). Bibliometric indicators for evaluating the quality of scientific publications. The journal of contemporary dental practice, 15(2), 258. https://doi: 10.5005/jp-journals-10024-1525
- King, J. (1987). A review of bibliometric and other science indicators and their role in research evaluation. Journal of information Science, 13(5), 261-276. https://doi.org/10.1177/016555158701300501
- Kosten, J. (2016). A classification of the use of research indicators. Scientometrics, 108(1), 457-464. https://doi: 10.1007/s11192-016-1904-7
- Larivière, V. & Sugimoto, C.R. (2019). The journal impact factor: a brief history, critique, and discussion of adverse effects. In Glänzel, W., Moed, H.F., Schmoch, U., Thelwall, M. (eds) Springer handbook of science and technology indicators, (pp. 3-24). Springer. https://doi.org/10.1007/978-3-030-02511-3_1
- Mañana-Rodríguez, J. (2013). Entropy-based disciplinarity indicator: role taxonomy of journals in scientific communication systems. https://arxiv.org/ftp/arxiv/papers/1302/1302.6528.pdf
- Martin, B. (1996). The use of multiple indicators in the assessment of basic research. Scientometrics, 36(3), 343-362.https://doi:10.1007/bf02129599
- Mingers, J. & Leydesdorff, L. (2015). A review of theory and practice in scientometrics. European journal of operational research, 246(1), 1-19. https://doi.org/10.1016/j.ejor.2015.04.002
- Mongeon, P. & Paul-Hus, A. (2016). The journal coverage of Web of science and Scopus: a comparative analysis. Scientometrics, 106(1), 213-228. https://doi.org/10.1007/s11192-015-1765-5
- Moravcsik, M. J. (1988) Some contextual problems of science indicators. In A.F.J. Van Raan (Ed.), Handbook of quantitative studies of science and technology (pp. 11–30). Elsevier Science Publishers B.V.
- Norris, G., Qureshi, F., Howitt, D. & Cramer, D. (2012). Introduction to statistics with SPSS for social science. Taylor & Francis.
- OECD and SCImago Research Group. (2016). Compendium of bibliometric science indicators. OECD. https://t4.oecd.org/sti/inno/Bibliometrics-Compendium.pdf.
- Rehn, C., Kronman, U. & Wadskog, D. (2007). Bibliometric indicators—definitions and usage at Karolinska Institutet Karolinska Institutet, https://dokumen.tips/documents/bibliometric-indicators-definitions-and-usage-at-.html?page=6. (Internet Archive)
- Skinner, R., Nelson, R.R., Chin, W.W. & Land, L. (2015). The Delphi method research strategy in studies of information systems. Communications of the Association for Information Systems, 37(2), 31-63. https://doi.org/10.17705/1CAIS.03702.
- Tahira, M., Alias, R.A. & Bakri, A. (2013). Scientometric assessment of engineering in Malaysians universities. Scientometrics, 96(3), 865-879. https://doi.org/10.1007/s11192-013-0961-4
- Thelwall, M. (2016). Web indicators for research evaluation: a practical guide. Synthesis Lectures on Information Concepts, Retrieval, and Services, 8(4), i-155. https://doi.org/10.2200/S00733ED1V01Y201609ICR052
- Thelwall, M. (2019). Online indicators for non-standard academic outputs. In Glänzel, W., Moed, H.F., Schmoch, U. & Thelwall, M. (eds) Springer handbook of science and technology indicators, (pp. 835-856). Springer. https://doi.org/10.1007/978-3-030-02511-3_33.
- Thelwall, M. & Kousha, K. (2015). Web indicators for research evaluation. Part 1: Citations and links to academic articles from the Web. El Professional de l’information, 24(5), 587-606. http://profesionaldelainformacion.com/contenidos/2015/sep/08.pdf. (Internet Archive)
- Tseng, Y.H., Chang, C.Y., Tutwiler, M.S., Lin, M.C. & Barufaldi, J.P. (2013). A scientometric analysis of the effectiveness of Taiwan’s educational research projects. Scientometrics, 95(3), 1141-1166. https://doi:10.1007/s11192-013-0966-z
- Van Raan, A. (2019). Measuring science: basic principles and application of advanced bibliometrics. In Glänzel, W., Moed, H.F., Schmoch, U., Thelwall, M. (eds) Springer handbook of science and technology indicators, (pp. 237-280). Springer. https://doi.org/10.1007/978-3-030-02511-3_10.
- Vîiu, G.A. (2016). A theoretical evaluation of Hirsch-type bibliometric indicators confronted with extreme self-citation. Journal of Informetrics, 10(2), 552-566. https://doi.org/10.1016/j.joi.2016.04.010
- Vinkler, P. (2009). The π-index. A new indicator for assessing scientific impact. Journal of Information Science, 35, 602–12. https://doi.org/10.1177/0165551509103601
- Vinkler, P. (2010). The evaluation of research by scientometric indicators. Elsevier.
- Wagner, W.E. (2019). Using IBM® SPSS® Statistics for research methods and social science statistics. SAGE Publications.
- Waltman, L. (2016). A review of the literature on citation impact indicators. Journal of informetrics, 10(2), 365-391. https://doi.org/10.1016/j.joi.2016.02.007
- Waltman, L. & Van Eck, N. J. (2009). A taxonomy of bibliometric performance indicators based on the property of consistency. Erasmus Research Institute of Management. http://hdl.handle.net/1765/15182. (Internet Archive)
- Waltman, L. & Van Eck, N. J. (2019). Field normalization of scientometric indicators. In W. Glälnzel, H.F. Moed, U. Schmoch, and M. Thelwall, (Eds.). Springer handbook of science and technology indicators, (pp. 281-300). Springer. https://doi.org/10.1007/978-3-030-02511-3_11
- Waltman, L. & Van Eck, N.J. (2015). Field-normalized citation impact indicators and the choice of an appropriate counting method. Journal of Informetrics, 9(4), 872-894. https://doi.org/10.1016/j.joi.2015.08.001
- Waltman, L., Van Eck, N.J., Visser, M.S. & Van Ran, A.F.J. (2011). Towards a new crown indicator: some theoretical considerations. Journal of Informetrics, 5(1), 37-47. https://doi.org/10.1016/j.joi.2010.08.001
- Wildgaard, L., Schneider, J. W. & Larsen, B. (2014). A review of the characteristics of 108 author-level bibliometric indicators. Scientometrics, 101(1), 125-158. https://doi.org/10.1007/s11192-014-1423-3
- Wu, D., Li, M., Zhu, X., Song, H. & Li, J. (2015). Ranking the research productivity of business and management institutions in Asia–Pacific region: empirical research in leading ABS journals. Scientometrics, 105, 1253–1272. https://doi:10.1007/s11192-015-1752-x
- Zhang, L., Glänzel, W. & Liang, L. (2009). Tracing the role of individual journals in a cross-citation network based on different indicators. Scientometrics, 81(3), 821-838. https://doi:10.1007/s11192-008-2245-y
- Zhang, L., Liu, X., Janssens, F., Liang, L. & Glänzel, W. (2010). Subject clustering analysis based on ISI category classification. Journal of Informetrics, 4(2), 185-193. https://doi.org/10.1016/j.joi.2009.11.005