Information Research
Vol. 28 No. 3 2023
Research on dynamic evaluation method of individual scientific impact under multiple key nodes
DOI: https://doi.org/10.47989/ir283397
Abstract
Introduction. The purpose of this paper is to research an evaluation method for the development trend of the scientific impact of individual scientists before and after different key nodes in scientific careers.
Method. This paper focuses on scientists at universities in Shanghai who obtained their first key programmes from the National Natural Science Foundation of China (NSFC) from 2011 to 2015. A two-node piecewise linear regression is used to divide the scientists’ individual academic trajectories. The Boston Consulting Group matrix (BCG-M) model is used to propose four types of talent.
Analysis. The pr(y)-index is applied to evaluate the scientists’ impact. Several characteristics of the trajectory of the impact of individual scientists are defined by the change in the pr(y)-index growth rate.
Results. The scientific impact of most scientists (66% and 62%) increased after they first obtained NSFC funding or their first key programme, respectively. The pr(y)-index of a 5-year time window is more sensitive to judge the of influence on scientific career.
Conclusion. The two-node piecewise linear regression model successfully divided the academic trajectories of individual scientists into three stages。NSFC funding promotes academic influence. The talents are divided into star talent, focus talent, question talent and taurus talent.
Introduction
Digital data on scholarly publications offer unprecedented opportunities to explore the evolution of scientists’ academic careers. Understanding how the influence of scientists emerges and evolves over time will guide the development of individual scientists’ academic careers while promoting science policy reform and accelerating scientific progress. Research on the output time series of scientists covers different countries, disciplines, and other aspects (Dennis 1956; Győrffy et al. 2020; Franceschini and Maisano 2011). From the perspective of research, on the one hand, a mathematical model is constructed through average output and correlation analysis to obtain the general rule of the change in the influence of scientists' academic careers. On the other hand, the influence of various factors on academic achievement output has been studied, such as time series research on innovation productivity at the career promotion stage of academic scientists (Goel and Göktepe-Hultén 2020; Petersen et al. 2012).
Based on averages involving hundreds or thousands of individuals, previous studies have established that the narrative of academic productivity is equally descriptive across domains and over time (Malmgren and Ottino 2010). The temporal variation in impact can be explained by the temporal changes in productivity, luck and the heavy-tailed nature of the distribution of a scientist’s individual impact, and the scientist’s influence is randomly distributed within the sequence of the scientist’s output (Sinatra et al. 2016). Way S F et al. (2017) introduced a piecewise linear model of scientist productivity over time and analysed the changes in the scientists’ output before and after obtaining a tenured professorship. The results showed that there was a great fluctuation between the average level and the individual level and that the traditional productivity evaluation needs to review and revise the productivity model. Subsequent studies on the determinants of academic productivity have concluded that doctoral reputation has a limited role in predicting scientific contribution (Way et al. 2019). Feichtinger G et al. (2019) provided the theoretical basis for the research of Way S F et al. through a designed scientist career optimization model and concluded that having a high-quality education can help a scientist avoid a pattern of career decline. In research on the time series of individual scientists’ output, the output and influence of single time node, such as the before and after obtaining funding or obtaining highly cited scholars, are explored (Liu and Tang 2021; Tian et al. 2019). However, there is a crucial question that has previously gone unanswered: How can we characterize the changes in scientists’ output and influence at multiple career key nodes?
The h-index is a popular bibliometric indicator used for assessing an individual scientist’s performance. The h-index, which considers the influence of academic papers and the productivity of scientists, was proposed by Hirsch (2015). Different scientists have different career paths, and their productivity and influence can vary over time. However, the h-index is a cumulative quantity, meaning that it has the disadvantages of an inability to decrease, low sensitivity and an indistinguishable degree (Sidiropoulos et al. 2007; Penner et al. 2013). Thus, the h-index cannot be considered an appropriate indicator of a scientist’s overall scientific impact (Waltman and Van Eck 2012). The use of the h-index in assessing the impact of individual scientists should be reconsidered (Koltun and Hafner 2021), and numerous variants of the h-index and citation time window have been explored (Bornmann et al. 2011; Wang 2013). On the basis of the h-index model, Prathap (2010) proposed the p-index (also called the prestige factor or prominence factor), demonstrated the correlation between the p-index and h-index and indicated that the p-index was a simple and reliable parameter for talent evaluation (Prathap 2010; Prathap 2012).
A dynamic indicator of scientific performance has been introduced into the h-index, the h3-index, which considers a 3-year time window for publications and citations and reflects current performance rather than lifetime achievement (Fiala 2014). Schreiber (2015) proposed the hr(y)-index, which can be applied to evaluate the recent academic value of high-impact scientists. It has been concluded that scientists cannot become distinguished in a short time window, a long-time window is not conducive to young scientists, and a time interval of 5 or 6 years is more reasonable. Based on the method of calculating the hr(y)-index, Tang (2020) introduced the publication time and citation time as factors into the pr(y)-index, which is constructed to reflect the dynamic development of scientists. The results show that the pr(y)-index has a higher distinguishing degree than the hr(y)-index. However, in the dynamic evaluation of scientists’ academic influence, the pr(y)-index has not been applied in empirical analyses of scientists’ influence at different career stages.
To solve the problems above, this study builds a two-node piecewise linear regression model that divides the academic career of scientists into three stages. The pr(y)-index is used to conduct dynamic empirical analysis on the scientific influence of scientists at different stages.
Data and Methods
The dataset
The diversified and orderly funding structure of the National Natural Science Foundation of China (NSFC), which plays an important role in supporting talent and team building, covers the whole research life cycle of scientists. The categories include young science fund projects, key programmes and joint fund projects. Among them, the key programmes are highly recognized and often given to scientists who have a good research foundation or a growth point in their discipline; these projects promote breakthroughs in some key fields or scientific previews. This paper takes the principals of the key programmes of the NSFC at universities in Shanghai as the research objects and conducts a dynamic analysis of the academic influence of scientists before and after the first NSFC funding and the first NSFC key programme. Considering the cumulative time of paper citations and the funding projects of key programmes (5 years), this paper analyses the project principals who obtained their first key programmes from 2011 to 2015.
The list of key programmes was obtained by searching the NSFC website. The annual scope of the projects was from 1991 to 2019, the retrieval results covered 16 universities in Shanghai, and a total of 855 projects were obtained. Changes in scientists’ institutional affiliations were recorded through personal resumes, and a list of project principals whose first key programme was awarded between 2011 and 2015 was extracted. All publications of scientists were retrieved and screened by name and institution through the Web of Science (WOS) Core Collection. The Science Citation Index Expanded (SCI-Expanded) and Social Sciences Citation Index (SSCI) were selected to export the full record and cited reference information of scientists, and a separate electronic document was created for each scientist. The year of each scientist’s first publication and the first time when the scientist first obtained an NSFC project and NSFC key programmes were retrieved. Scientists whose first year of publication was later than the project were not considered. The reason for such a situation may be that the first year in which funds were obtained was earlier or the early papers were not SSCI or SCI papers. Scientists whose publications could not be determined due to their general name were excluded. The number of research objects was determined to be 90, and their publications covered the period from 1977 to 2020, with a total of 16,040 papers.
Two-node piecewise linear regression model
In this paper, a two-node piecewise linear regression model is used to research the changes in the academic influence of scientists before and after the first NSFC project and first NSFC key programme. The academic career of scientists is divided into two key nodes and three phases, as shown in Fig. 1. The two key nodes are the year in which the first NSFC funding was obtained (First NSFC for short) for a given tFirst NSFC, and the year in which the first key programme was obtained from the NSFC (First Key NSFC for short) for a given tFirst Key NSFC. The starting point is the year of first publication (First Publication for short), denoted as tFirst Publication. The ending point is the 2020, denoted as t2020. The two-node piecewise linear regression model equation is as follows:
f(t) = b1 + k1t1 + k2(t1−tFirst NSFC)t2 + k3(t1−tFirst Key NSFC)t3
b1 is the initial value, and t2 and t3 are indicator variables, which are defined as follows:

In Fig. 1, phase one is the period from the scientist’s first publication to when he or she first obtained NSFC funding (tFirst Publication→tFirst NSFC); at this point, t1< tFirst NSFC, t2=t3=0 (see Eq. 2),
fPhase one(t) = b1 + k1t1
The slope of this regression line is k1, and the intercept is b1.
Phase two is the period from the First NSFC to the First Key NSFC(tFirst NSFC→tFirst Key NSFC); at this point, tFirst NSFC<t1< tFirst Key NSFC, t2=1, and t3=0 (see Eq. 3),
fPhase two(t) = b1 − k2tFirst NSFC + (k1+k2)t1
The slope of this regression line is k*=k1+ k2, and the intercept is b1-k2tFirst NSFC.
Phase three is the period from the First Key NSFC to data collection (tFirst Key NSFC→t2020), and t1> tFirst Key NSFC, t2=1, t3=1(see Eq. 4),
fPhase three(t) = (b1−k2tFirst NSFC−k3tFirst Key NSFC) + (k1 + k2 + k3)t1
The slope of this regression line is k**=k1+ k2+ k3, and the intercept is b1-k2tFirst NSFC-k3tFirst Key NSFC.
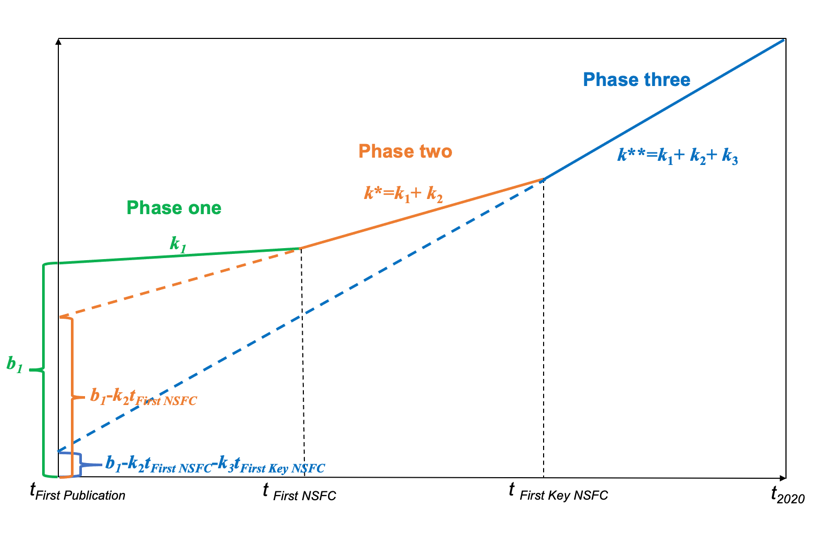
Figure 1. Two-node piecewise linear regression model
Results
Per-person annual publication
The year in which a scientist first obtained an NSFC key programme was marked as zero, and the per-person annual publications (PAP, the average number of articles published by a scientist per year) of 90 scientists is shown in Fig. 2. Different years represent the years when the scientists first obtained a key programme of the NSFC. The total PAP (red line in Fig. 2) of 90 scientists increased over the years. Before zero, the PAP values show an increasing trend year by year; after zero, the increasing trend of the PAP in the key programme years of 2011 and 2012 is significantly higher than that from 2013 to 2015, and the PAP value trends are flat from 2013 to 2015. According to Table 1, before scientists obtain a key programme of the NSFC, the maximum value of the PAP of scientists is 14, and afterward, it is 22. In both cases, a project was obtained in 2012.
Per-person annual publication
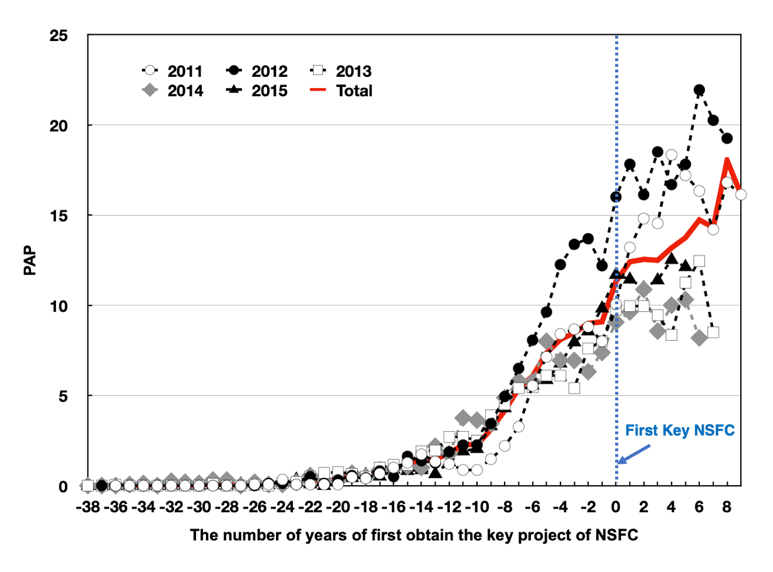
Figure 2. Per-person annual publications of scientists. The year of in which an NSFC key programme was first obtained is marked as zero. The year in the legend represents the time when the key programme was first obtained. Total is the average PAP results of 90 scientists
| First Key NSFC | Before zero | After zero |
|---|---|---|
| 2011 | 9 | 19 |
| 2012 | 14 | 22 |
| 2013 | 8 | 13 |
| 2014 | 7 | 11 |
| 2015 | 10 | 13 |
| Total | 9 | 18 |
Table 1. The maximum PAP before and after zero
Scientific impact evaluation parameters
The pr(y)-index reflects the dynamic change in the academic influence of scientists in each y-r period. The calculation formula is as follows:
p_r (y)=〖(C_ry^2/N_ry)〗^(1/3)(5)
Cry represents the total citation frequency of scientists from initial year r to observed year y, and Nry is the total number of articles from r to y, y-r≥1. For example, to calculate the p-index of a scientist from 2011 to 2015, it is necessary to retrieve the number of published articles (N2011-2015) of the scientist in these five years and the citation frequency (C2011-2015) of those articles.
For the selection of the time window, this paper selects the time intervals of 1 year, 5 years and yearly for comparative analysis in Fig. 3. Four scientists, numbered 20, 40, 60 and 80 in the figure, are selected as representatives. Additionally, in the figure, the zero point is the year of the first NSFC key programme. From Fig. 3(a), the pr(y)-index of every year shows an overall upward trend with the increase in the number of years of the academic career, and it is difficult to distinguish the real results of influence. Although the curves in Fig. 3(b) may reflect the change in influence in a short period of time, the excessively short window setting leads to a large fluctuation in the curve, which makes it impossible to distinguish different scientists. The curve in Fig. 3(c) can reflect the dynamic changes of scientists in the rising, flat and declining periods. Pan and Fortunato (2014) also verified that there was a strong contrast in a 5-year time window. Therefore, this paper selects the pr(y)-index in a 5-year time window to conduct a dynamic evaluation of scientists' academic influence.
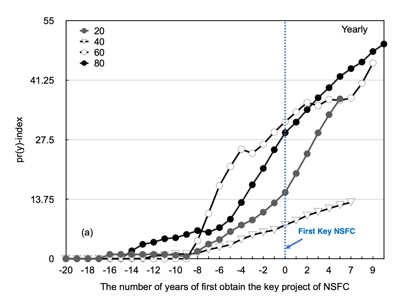
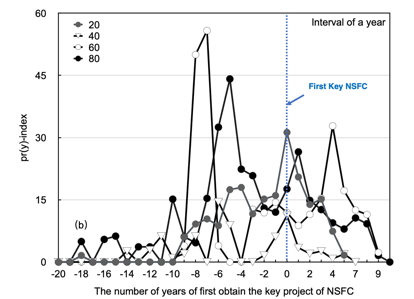
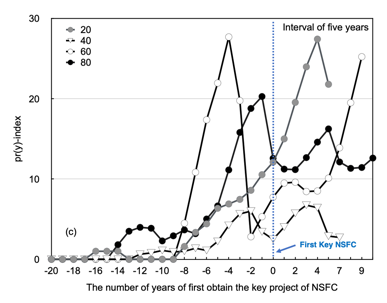
Figure 3. The time series of the pr(y)-index. (a) The pr(y)-index for every year (b) The pr(y)-index at an interval of 1 year. (c) The pr(y)-index at an interval of 5 years
Analysis based on two-node piecewise linear regression
MATLAB software was used to establish a two-node piecewise linear regression model, which was used to perform best-fit piecewise linear regression for the pr(y)-index of 90 scientists before and after the tFirst NSFC and tFirst Key NSFC points, and the k1, k* and k** of each scientist were obtained. The results of k1, k* and k** are given in Fig. 4, where the change in slope represents a rise or fall in academic influence. Diverse trends in individuals’ influence fall into four quadrants based on their slopes, and the proportion of scientists is shown in Fig. 5.
Before and after the change-point of tFirst NSFC and tFirst Key NSFC, the proportions of scientists whose pr(y)-index increased (k1>0, k*>0, k**>0; in the first quadrant) were the highest, at 66% and 62%, respectively. These results indicate that the academic influence of most scientists increased after they obtained NSFC funding or an NSFC key programme for the first time. The first quadrant is divided into upper and lower parts by taking k1 = k* and k*=k** as dividing lines. Compared to before scientists first obtained NSFC funding, the pr(y)-index growth rate of 38% of scientists was greater (k*>k1>0; in the first quadrant) than before. Compared to before the scientist first obtained an NSFC key programme, the pr(y)-index growth rate of 23% of scientists was greater (k**> k*>0; in the first quadrant) than before. After the change points of tFirst NSFC and tFirst Key NSFC, the proportions of scientists whose pr(y)-index changed from showing a decline to showing an increase (k1<0, k*>0, in the second quadrant; k*<0, k**>0, in the second quadrant) were 23% and 7%, respectively. Funding plays a positive role in enhancing the academic influence of scientists.
Before and after the changes-point of tFirst NSFC and tFirst Key NSFC, the proportions of scientists whose pr(y)-index declined (k1<0,k*<0, k**<0, in the third quadrant) were 0% and 5%, respectively. After the changes-point of tFirst NSFC and tFirst Key NSFC, the proportions of scientists whose pr(y)-index changed from showing an increase to showing a decline (k1>0,k*<0, in the fourth quadrant; k*>0,k**<0, in the fourth quadrant) were 11% and 26%, respectively.
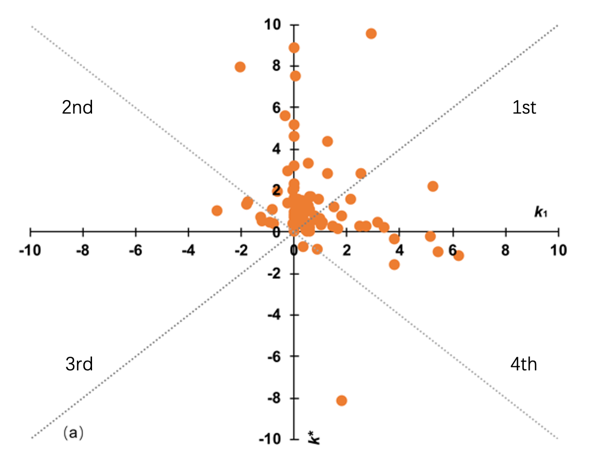
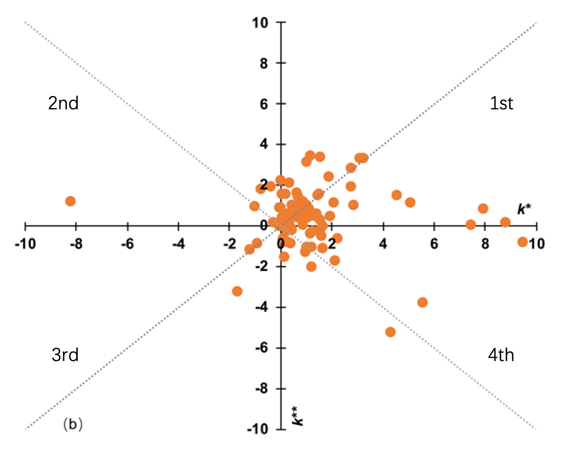
Figure 4. Distribution of individuals’ influence parameters. (a) The slope of the fitting line before and after the first NSFC funding (change point tFirst NSFC). (b) The slope of the fitting line before and after the first NSFC key programme (change point tFirst Key NSFC). The first, second, third and fourth quadrants are marked starting from the top right and turning clockwise (numbered 1st, 2nd, 3rd, and 4th)
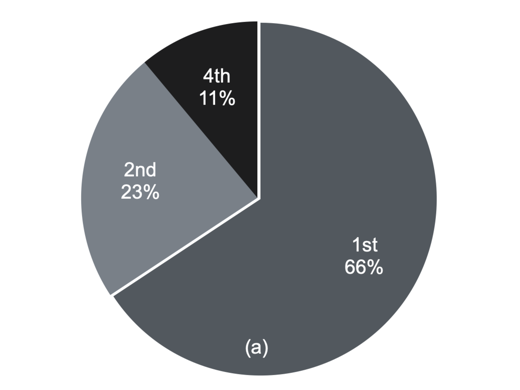
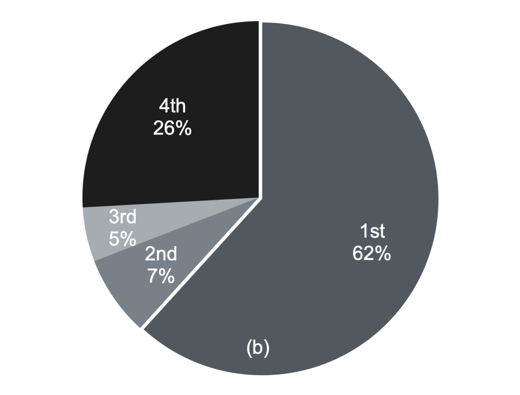
Figure 5. The proportion of scientists in different areas. (a) Before and after the first NSFC funding (the change point tFirst NSFC) (b) Before and after the first NSFC key programme (the change point tFirst Key NSFC). The four quadrants are numbered 1st, 2nd, 3rd, and 4th
Analysis of the individual influence trajectory based on the Boston Consulting Group Matrix
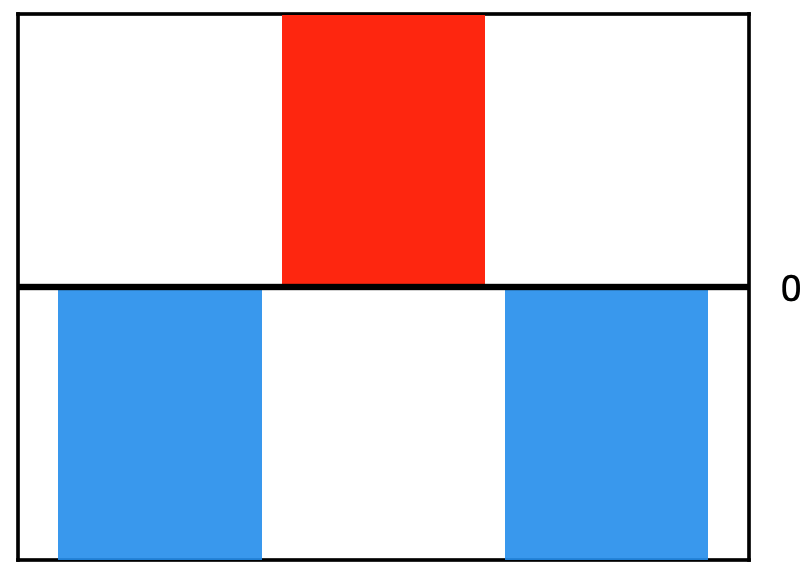
To further analyse the individual influence trajectories, this paper uses the Boston Consulting Group Matrix (BCG-M) to classify and analyse the change trend of the pr(y)-index before and after two key nodes. By constructing the market share and market growth as two dimensions, the BCG-M divides institutional strategy into four types: stars, cash cows, poor dogs, and question marks. Previous studies (Hambrick et al. 1982; Özemre et al. 2020; Liang et al. 2020) have applied this matrix to management and business and discussed its application in scientific research decision-making and evaluation. Based on the principle of the BCG-M, scientists are divided into four quadrants in Fig. 6. The number in the circles represents the number of scientists in each quadrant; 9 scientists are not included here (k*=k**>0). In each quadrant, a scientist is selected to display the trajectory of academic influence. The dotted line represents the change in the scientist’s pr(y)-index, and the solid line (orange) is the fitting result. Comparative analysis of the growth rate of the pr(y)-index can better reflect the promotion effect of funded projects on academic influence. The left and right sides of the abscissa represent the decrease and increase in the pr(y)-index growth rate after obtaining the first NSFC key programme, respectively(it should be noted that a decline in the growth rate does not mean that the growth rate is negative, rather, it means that it is smaller than the growth rate before the node.). The upper and lower sides of the vertical coordinate represent the increase and decrease in the pr(y)-index growth rate after obtaining NSFC support for the first time. Based on the change in the pr(y)-index growth rate, scientists are defined as follows, and the parameter settings of each quadrant are shown in Table 2. (The histogram in Table 2 represents the change in slope. Red indicates that the slope is greater than zero. Blue indicates that the slope is less than zero. When the slope is greater than zero, the length of the bar graph represents only a comparison of the size between k1 and k* and between k* and k**, a specific value is not indicated.):
Star Talent (first quadrant): A total of 14.8% of scientists (12 in total) continued to increase their academic influence after receiving funding. They are distributed across the six scientific departments of the NSFC: engineering and materials, management, information, medicine, chemistry and earth sciences.
Focus Talent (second quadrant): Compared with the key nodes before, the pr(y)-index growth rate of 46.9% of scientists (38 in total) increased after they first obtained funding and decreased after they first obtained an NSFC key programme. They are distributed across six scientific departments (except management and earth sciences), with the highest proportions of 26.3% and 23.7% in the medicine and chemistry sciences departments, respectively.
Question Talent (third quadrant): 19.8% of the scientists (16 in total) have a continuous decline in academic influence. They are distributed across seven scientific departments (except earth sciences), and the proportion of those in mathematics and physical science departments is 37.5%.
Taurus Talent (fourth quadrant): Compared with the change point before, 18.5% of scientists (15 in total) saw a decrease in their academic influence after they first obtained funding and saw an increase in influence after they first obtained a key programme. They are distributed across six scientific departments (except engineering and materials, earth sciences).
| Quadrant | k value | Number of scientists |
|---|---|---|
| First (12) | k1, k*, k**>0,
k*> k1, k**>k*;
 |
7 |
k1<0, k*>0, k**>0,
k**>k*;  |
5 | |
| Second (38) | k1, k*, k**>0,
k*> k1, k**<k*;
 |
8 |
k1<0, k*>0, k**<0;
 |
3 | |
k1>0, k*>0, k**<0,
k1< k*;  |
14 | |
k1<0, k*>0, k**>0,
k*>k**;  |
13 | |
| Third (16) | k1, k*, k**>0,
k*< k1, k**<k*;
 |
5 |
k1>0, k*>0, k**<0,
k1>k*;  |
7 | |
k1>0, k*<0, k**<0;
 |
4 | |
| Fourth (15) | k1, k*, k**>0,
k*< k1, k**>k*;
 |
9 |
k1>0, k*<0, k**>0;
 |
6 |
Table 2. Parameter requirements for each quadrant
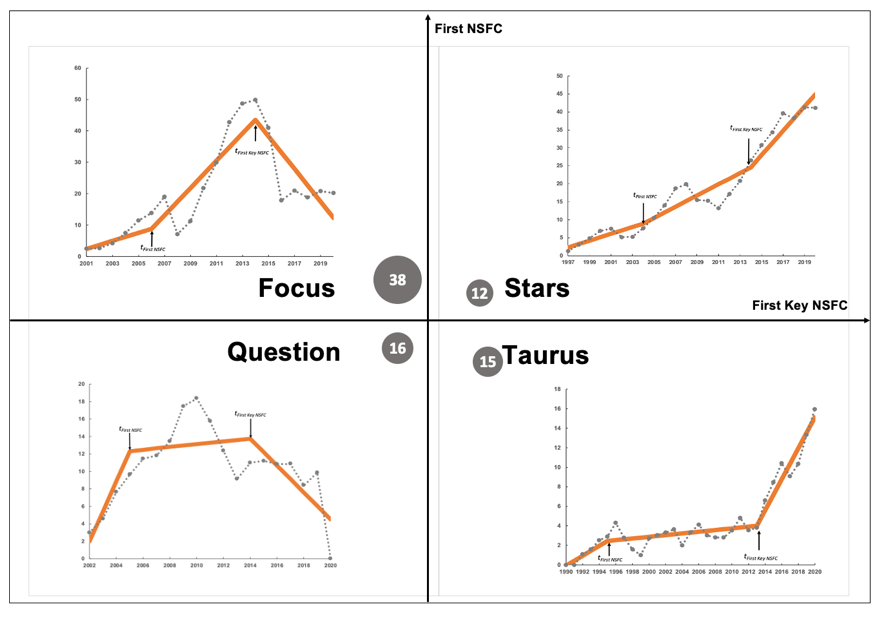
Figure 6. Boston Consulting Group matrix of on the variation in the pr(y)-index of scientists
Impact patterns in scientific careers
To explore the changing patterns of the academic influence of scientists, the paper introduces the most influential publications and the most relevant publications for analysis. Citations can be regarded as an official, real and essential form of usage of previous studies, while views and downloads are unofficial, potential, and unessential/peripheral forms of usage (Wang et al. 2016). Citing behaviour is related to the degree of influence of academic achievements, and the form of use is related to the attention given to academic achievements. Therefore, in this paper, the article with the highest number of citations is defined as the most influential article, and the article with the highest usage is defined as the paper that is the most notable article. The WOS platform can obtain the maximum usage and citation frequency of a paper as well as its corresponding year of publication. The usage count is the number of times from 2013 to the date of data download when the full text of the record was accessed or the record was saved.
The first publication was recorded as year zero. Fig. 7 shows the average years in which scientists obtained projects (First NSFC; First Key NSFC) and published articles (Most Influential Article; Most Notability Article) in different quadrants. In the first quadrant, star talent has the shortest time to obtain the funding for the first time, 5.3 years. In the third quadrant, question talent takes the longest time (7.8 years) to obtain funding for the first time. In the four quadrants, the most influential article appears between the first funding and the first key programme. In the first and fourth quadrants, the most notable articles were published after the first key programme, indicating that scientists received high attention and that their academic influences continued to increase after they obtained a key programme. In the second and third quadrants, the article with the most attention appears before the first key programme, and the attention drops after the key programme, resulting in a decline in its influence.
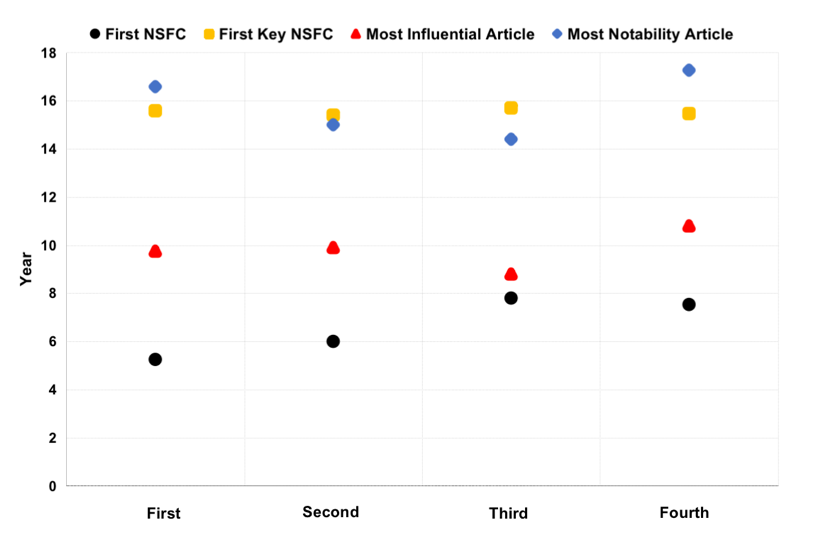
Figure 7. Year interval distribution at different time nodes
Discussion and conclusions
This paper focused on the problem of evaluating the scientific impact of individual scientists at universities in Shanghai who first obtained NSFC key programmes from 2011 to 2015 in three phases by using a two-node piecewise linear regression model. Based on the principle of the BCG-M, this paper classified the changing characteristics of the academic influence of individual scientists.
(1) The time series curve of the publications of scientists increased sharply before they first obtained a key programme of the NSFC. After this node, the curve of scientists who received their first key programme in 2011 and 2012 continued to increase, while that of the scientists from 2013 to 2015 showed a relatively gentle growth. This finding shows that the promoting effects of key programmes on scientists' productivity have weakened in recent years.
(2) The dynamic evaluation of scientists' academic influence based on applyling the pr(y)-index is empirically analysed. Compared with the h-index, the pr(y)-index is more suitable for a dynamic analysis of influence, and the pr(y)-index of a 5-year time window is more sensitive to judge the of influence on academic career and has a high degree of differentiation.
(3) NSFC funding promotes the academic influence of scientists. The academic influence of most scientists (66% and 62%) increased after they obtained NSFC funding or an NSFC key programme for the first time, respectively.
(4) The two-node piecewise linear regression model successfully divided the academic trajectories of individual scientists into three stages, and three slope parameters k1, k* and k** were obtained from the fitting results of distribution of the pr(y)-index. Based on the BCG-M model, several characteristics of the trajectory of the academic influence of individual scientists are defined by the change in the pr(y)-index growth rate, and four types of talent (star talent, focus talent, question talent and taurus talent) are proposed.
The development of a more diversified and integrated scientific research environment is suggested for star talent individuals (14.8%) to fully develop their leadership skills and core values. It is necessary to emphasize the tracking and in-depth understanding of focus talent individuals (46.9%) and propose targeted solutions to provide a reference for future talent funding policies. Question talent individuals (19.8%) are concentrated in mathematics and physics. To improve the depth and breadth of the influence of talent, it is necessary to integrate the research methods from multidisciplinary fields and track the development trend of frontier fields. By building a scientific research platform and a reasonable reward mechanism, the potential of taurus talent individuals (18.5%) can be fulfilled, and it is hoped that they can be transformed into stars by following new nodes of their academic careers.
There are still some limitations in this study, and further work needs to be carried out based on from the following three aspects: the mechanism of the distribution of different types of scientists and its influencing factors. This study focuses only on scientists at universities in Shanghai; thus, regional differentiation needs to be eliminated. In terms of evaluation indicators, the paper further analyses the traditional measurement indicators and their derivative indicators, time-varying network and other evaluation methods should to be adopted to achieve a multivariate dynamic evaluation of the academic influence of talent.
Acknowledgments
The author would like to thank Ai Qian Chen for her discussion and comment on this study.
About the author
Dr Shuang Ma is currently a librarian at the Tongji University Library in Shanghai, China. She received her PhD in Condensed Matter Physics from Tongji University in 2016. She current researches focuses on bibliometrics and scientometrics. Contact e-mail address: 18101@tongji.edu.cn
References
Bornmann, L., Mutz, R., Hug, S. E., & Daniel, H-D. (2011). A multilevel meta-analysis of studies reporting correlations between the h index and 37 different h index variants. Journal of Informetrics, 5(3), 346-359. https://doi.org/10.1016/j.joi.2011.01.006
Dennis, W. (1956). Age and productivity among scientists. Science, 123(3200), 724-725. https://doi.org/10.1126/science.123.3200.724
Franceschini, F., & Maisano, D. (2011). Proposals for evaluating the regularity of a scientist’s research output. Scientometrics, 88(1), 279-295. https://doi.org/10.1007/s11192-011-0371-4
Fiala, D. (2014). Current Index: A Proposal for a Dynamic Rating System for Researchers. Journal of the Association for Information Science and Technology, 65(4), 850-855. https://doi.org/10.1002/asi.23049
Feichtinger, G., Grass, D., & Kort, P. M. (2019). Optimal scientific production over the life cycle. Journal of Economic Dynamics and Control, 108(2019), 1-16. https://doi.org/10.1016/j.jedc.2019.103752
Győrffy, B., Csuka, G., Herman, P., & Török, Á. (2020). Is there a golden age in publication activity?—an analysis of age-related scholarly performance across all scientific disciplines. Scientometrics, 124(2), 1081-1097. https://doi.org/10.1007/s11192-020-03501-w
Goel, R. K., & Göktepe-Hultén, D. (2020). Drivers of innovation productivity of academic researchers through career advancement. The Journal of Technology Transfer, 45(2), 414-429. https://doi.org/10.1007/s10961-018-9689-x
Hambrick, D. C., MacMillan, I. C., & Day, D. L. (1982). Strategic attributes and performance in the BCG matrix–A PIMS-based analysis of industrial product businesses. Academy of Management Journal, 25(3), 510–531. https://doi.org/10.5465/256077
Hirsch, J. E. (2005). An index to quantify an individual's scientific research output. Proceedings of the National Academy of Sciences of the United States of America, 102(46), 16569-16572. https://doi.org/10.1073/pnas.0507655102
Koltun, V., & Hafner, D. (2021). The h-index is no longer an effective correlate of scientific reputation. PLoS ONE, 16(6), 1-16. https://doi.org/10.1371/journal.pone.0253397
Liang, G., Hou, H., Chen, Q., & Hu, Z. (2020). Diffusion and adoption: an explanatory model of “question mark” and “rising star” articles. Scientometrics, 124(1), 219-232. https://doi.org/10.1007/s11192-020-03478-6
Liu, H. X., & Tang, L. (2021). Does being rated as a highly cited researcher improve academic output and impact? Dual validation from the holistic and individual levels. Studies in Science of Science, 39(2), 212-221. https://doi.org/10.3969/j.issn.1003-2053.2021.02.003
Malmgren, R. D., Ottino, J. M., & Nunes Amaral, L. A. (2010). The role of mentorship in protégé performance. Nature, 465(7298), 622-626. https://doi.org/10.1038/nature09040
Özemre, M., & Kabadurmus, O. (2020). A big data analytics based methodology for strategic decision making. Journal of Enterprise Information Management, 33(6), 1467-1490. https://doi.org/10.1108/JEIM-08-2019-0222
Prathap, G. (2010). Is there a place for a mock h-index? Scientometrics, 84(1), 153-165. https://doi.org/10.1007/s11192-009-0066-2
Prathap, G. (2010). The 100 most prolific economists using the p-index. Scientometrics, 84(1), 167-172. https://doi.org/10.1007/s11192-009-0068-0
Prathap, G. (2012). Evaluating journal performance metrics. Scientometrics, 92(2), 403-408. https://doi.org/10.1007/s11192-012-0746-1
Petersen, A. M., Riccaboni, M., Stanley, H. E., & Pammolli, F. (2012). Persistence and uncertainty in the academic career. Proceedings of the National Academy of Sciences, 109(14), 5213-5218. https://doi.org/10.1073/pnas.1121429109
Penner, O., Pan, R. K., Petersen, A. M., Kaski, K., & Fortunato, S. (2013). On the Predictability of Future Impact in Science. Scientific Reports, 3(3052), 1-8. https://doi.org/10.1038/srep03052
Pan, R. K., & Fortunato, S. (2014). Author Impact Factor: tracking the dynamics of individual scientific impact. Scientific Reports, 4(4880), 1-7. https://doi.org/10.1038/srep04880
Sidiropoulos, A., Katsaros, D., & Manolopoulos, Y. (2007). Generalized Hirsch h-index for disclosing latent facts in citation networks. Scientometrics, 72(2), 253-280. https://doi.org/10.1007/s11192-007-1722-z
Schreiber, M. (2015). A variant of the h-index to measure recent performance. Journal of the Association for Information Science and Technology, 66(11), 2373-2380. https://doi.org/10.1002/asi.23438
Sinatra, R., Wang, D., Deville, P., Song, C., & Barabási, A-L. (2016). Quantifying the evolution of individual scientific impact. Science, 354(6312), aaf5239. https://doi.org/10.1126/science.aaf5239
Tian, R. H., Zhang, Z. Q., & Gao, Z. (2019). The Research of Individual Scientific Research Output Based on Piecewise Linear Regression Model-Empirical Study Based on the National Science Funds of Earth Science Project for Distinguished Young Scholar. Science & Technology Progress and Policy, 36(1), 142-151. https://doi.org/10.13266/j.issn.0252-3116.2018.01.014
Tang, P. N. (2020). Research on Dynamic Assessment of Academic Influence of Scholars Based on Hr(y) -Index and Pr(y) :Index in the Library and Information Field. Information Studies: Theory & Application, 43(12), 63-4. https://doi.org/10.16353/j.cnki.1000-7490.2020.12.010
Way, S. F., Morgan, A. C., Clauset, A., & Larremore, D. B. (2017). The misleading narrative of the canonical faculty productivity trajectory. Proceedings of the National Academy of Sciences, 114(44), E9216-E9223. https://doi.org/10.1073/pnas.1702121114
Way, S. F., Morgan, A. C., Larremore, D. B., & Clauset, A. (2019). Productivity, prominence, and the effects of academic environment. Proceedings of the National Academy of Sciences, 116(22), 10729-10733. https://doi.org/10.1073/pnas.1817431116
Waltman, L., & Van Eck, N. J. (2012). The Inconsistency of the h-index. Journal of the American Society for Information Science and Technology, 63(2), 406-415. https://doi.org/10.1002/asi.21678
Wang, J. (2013). Citation time window choice for research impact evaluation. Scientometrics, 94(3), 851-872. https://doi.org/10.1007/s11192-012-0775-9
Wang, X., Fang, Z., & Sun, X. (2016). Usage patterns of scholarly articles on Web of Science: a study on Web of Science usage count. Scientometrics, 109(2), 917-926. https://doi.org/10.1007/s11192-016-2093-0