vol. 13 no. 3, September, 2008
vol. 13 no. 3, September, 2008 | ||||
For some time now, the relationship between university and private enterprise has been receiving increasing attention, both from research policy planners and managers, with a view to enhancing cooperation, and from researchers analysing and seeking to improve and make such collaboration more effective through networking. The European Union’s Sixth Framework Programme, for instance, designed a scenario with the explicit purpose of increasing and strengthening interconnections among the various research sectors participating in and leading the European Research Area. The Seventh Framework Programme includes a specific programme, called Cooperation, whose purpose is to further and support cooperation among universities, private enterprise, research centres and public authorities (European Union, 2002, 2006).
The various reasons for this ambition all revolve around the complexity and high cost of scientific and technology policies. In Spain also, decentralized support for small teams’ personal initiatives is steadily being replaced by centralized support for large interdisciplinary and inter-organizational groups. Against a backdrop of intense global competition, speedy technological change and shorter and shorter product life cycles, private enterprise has become increasingly aware that the sources of competitive advantage are not to be found exclusively in-house, but rather are present in other organizations. Hence, the inter-organizational relations geared to knowledge creation and transfers have acquired vital importance in business practice. In this regard, some authors have stressed the relevance for innovation of networking between companies and other organizations such as universities.
Universities are unique from the standpoint of their potential for generating and disseminating information that is directly applicable to production processes, but also because scientific inventions delimit and expand companies' long-term technological boundaries. Universities also furnish qualified and mobile human resources, researchers and/or students, whose services can be enlisted by the corporate world. Both types of organizations raise funding for research through competitive tendering processes, create technology-based companies and generate patentable inventions. While companies can gain prestige by forging alliances with reputed universities, students and professors benefit from employment opportunities, exposure to practical problems during attachments and access to areas with a strong applied technology bias. In short, this type of collaboration benefits both organizations in key R&D activities and cooperation between universities and private enterprise forms a significant part of the advancement of both scientific and technical knowledge (Leydesdorff and Etzkowitz 2001).
While the volume of literature on collaboration between the university and private enterprise has grown significantly over the last few decades, few papers have specifically attempted to use bibliometric data to explain and visualize how these partnerships are established. The present article contributes to the growing volume of literature on the links between the university and private enterprise, in the context of an economy geared to knowledge and innovation. Recently, studies on knowledge transfer between universities and private enterprise have addressed questions such as the production of technological knowledge in universities (Durán-Romero 2003), the formation of scientific and technological parks (Ondategui 2001), the technological relationship between private enterprise and the public R&D system (Fundación Cotec 1999), joint research contracts (Bayona-Sáez et al. 2002), certain types of interaction, such as PhD mobility toward private enterprise (Cruz-Castro and Sanz-Menéndez 2005) and the analysis of scientific citations in patents (Acosta and Coronado 2003; Plaza et al. 2006).
As generators of scientific knowledge, universities publicize the results of their research in globally open articles, using the channels afforded by existing journals to share their findings as widely as possible with different communities and audiences. This information, openly publicized to serve a community, makes universities epistemic institutions and sets them apart in this respect from private companies. According to Dasgupta and David (1994), industrial innovation and research is conducted to grow the revenues stemming from the possession of private knowledge. In academia, the aim is to maximize the dissemination of knowledge, by contrast with companies. Another distinction between the two types of organizations rests in the different way deadlines are set to achieve research objectives. University researchers can establish long-term objectives, experiment more and undertake high-risk projects that may be successful or otherwise in time, for their organizations are very stable and can be neither taken over nor merged, unlike businesses, “which are subject to potentially strong market pressures and experience liabilities of newness and obsolescence” (Owen-Smith and Powell 2004: 8).
In the present study, the focus is on the analysis of a particular type of knowledge transfer among universities, private enterprise and the public sector in a regional R&D system, taking the Community of Madrid as the basis for a case study. From the standpoint of a theoretical approach, cooperation between enterprise and research bodies may adopt many different formulae. Examples include support for research, joint research, knowledge or technology transfer, strategic alliances (Santoro and Chakrabati 2002). Here it has been assumed that knowledge transfer includes a very broad range of both formal and informal types of interaction: for instance, contacts stemming from personal relationships, cooperative education, shared development of curricula, establishment of university and corporate consortia, recruitment of university graduates and post-doctoral fellows or attachments in companies (Mora-Valentín 2002).
Another form is the inter-institutional co-authorship of research articles, a more loosely structured mechanism of knowledge transfer. Inter-institutional co-authorship, regardless of the type of organizations involved, occurs when at least two different co-authors of a scientific paper have different affiliations. This type of interaction entails the tacit transfer of information and knowledge as a result of personal contacts between the authors, even where the process is scantly formalized. It is the tangible reflection of one aspect of knowledge transfer, inasmuch as it is coded; it is the most formal manifestation of intellectual partnering in scientific research and has become a standard indicator for measuring scientific cooperation. And within the framework of the Triple Helix model, the study of this type of cooperation acquires a new dimension (Glänzel and Schubert 2004, among others).
Research on social networks explores the reasons for their creation and the consequences they generate. Network analysis may be conducted at different levels or defining different groupings. In some cases the object of the analysis is the relationships or links between two actors in a given network. In such analysis each actor is associated with only one other and the all nodes or actors are measured in terms of the same set of variables. On the grounds of this type of dyadic analysis, data and hypotheses can be aggregated to higher and higher levels, to ultimately embrace the entire network.
In addition to the level of analysis, network studies differ in terms of the characterization of the links and functions present in the network. If the objective is to explain the configuration of a co-authorship network structure, depending on the number of links and the selection of nodes studied, the interconnection patterns that appear may be more or less dense. Several authors have noted that such different structures reflect different types of social capital. “Social capital refers to the norms and networks that enable people to act collectively” (Woolcock and Narayan 2000: 226). A distinction is drawn in this regard between bridging and bonding social capital. The network structures deriving from associations based on these varying dimensions of social capital are described as follows:
...bridging social capital is associated with large, loose networks, relatively strict reciprocity, perhaps a thinner or different sort of trust, greater risk of norm violation and more instrumentality. Bonding social capital is associated with dense, multiple networks, long term reciprocity, thick trust, shared norms and less instrumentality (Leonard and Onyx 2003: 193).
Therefore, the social structure underlying university-government-enterprise has as many different components as there are products of the forms of organization or partnering and activities. Hence, it would take a good number of graphs to describe the true underlying structure. In graph theory terminology, several sub-graphs centred on the same nodes must be considered collectively. Inasmuch as each graph measures something different, none can be replaced by any other. Network analysis differentiates among network structures that are not necessarily mutually exclusive.
The first hypothesis examined here, rather than focusing on the overall collaboration of all the actors in the selected scientific domains, can be studied at the level of inter-actor collaboration. This would identify bridging networks with low density link patterns and variations in the sub-network structure, for weak ties are instrumental in disseminating ideas, exchanging technical information and inter-linking communities (Granovetter 1973, 1982). The network boundaries approach is therefore nominalist, based on theoretical concerns.
The purpose of this article is to present the results of a microanalysis of inter-institutional co-authorship networks comprising only three actors, namely universities, government and private companies located in Madrid, inferred from co-authorship data on the published results of joint research. Government; is understood to mean any central, regional or local public body excepting universities, research hospitals, institutes or public research bodies, from 1995 to 2003. Representations of inter-organizational co-authorship subnetworks of this nature would corroborate its spatial and temporal dimensions.
The aims are to ascertain each network actor’s position and characteristics, determine how information flows across the bridging network and detect and identify the organizations working in the three subject categories considered: Medicine, Physiology and Pharmacology and Molecular, Cellular and Genetic Biology. Sectoral differences are assumed to depend on the intellectual nature and technological characteristics of knowledge, as well as on organization size and the effects of proximity. Thus stated, the objectives of this study are modest: it aims to show the usefulness of a methodology, namely structural and network analysis, applied to the understanding, characterization and visualization of the cooperation and interaction among institutions and their evolution, in contributing to a regional domain analysis of the Community of Madrid.
To achieve these objectives, this article is structured as follows: the first section explains the methodology and data used. The second sets out the results and graphic representation built from social network analysis and the third discusses the conclusions and future lines of research.
This study used relational methods to analyse and represent the structures emerging from cooperation. Structural and social network analysis is based on graph theory, which has undergone substantial development in recent decades, primarily in sociology and the study of organizational forms (Wasserman and Faust 1994; Rodríguez 1995) and in information science (Haythornthwaite 1996; Otte and Rousseau 2002). The use of this methodology has not yet been widely extended to the study of scientific cooperation networks involving universities, government and private enterprise, but it has been deployed in other studies of scientific collaboration based on co-authorship: to identify, for instance, inter-institutional networks of elite research centres (Nagpaul 2002), international co-authorship networks (Li-Chun et al. 2006) or research cooperation networks among biopharmaceutical companies (Calero et al. 2007).
Data construction is an essential part of the process that precedes the application of network analysis. This often entails converting the data available to a relational format. The basic elements that define a network are essentially: the actors who establish inter-relationships (in the present case, universities, private companies or government bodies) and the relationships themselves (inter-institutional co-authorship, for instance). The former are represented by points, circles or spheres and the latter by lines on the node network. Structural and network analysis is based, practically speaking, on the creation and development of the relationship matrix and the construction of the respective graph. When a relational analysis is to be conducted, the basic material for the analysis is the construction of the matrix that inter-relates the actors. Co-authorship data are fairly readily available and standardized allowing for regional, national and international comparison and could be used primarily as an indicator of long-lasting research partnerships between large firms and universities (Bordons and Gómez 2000).
The data presented here were downloaded from the Thomson Scientific databases contained on the Web of Science. The existence of a record with at least one Madrid address in the address field was the retrieval criterion used. The period studied was 1995 to 2003. The relational base was built from the 65,896 documents of all types retrieved (articles, biographical items, book reviews, corrections, editorial materials, letters, meeting abstracts, news items and reviews). Subsequently, a selection was made of papers having intra-regional co-authors affiliated with universities, private enterprise or government bodies located in Madrid. A paper was regarded to be inter-institutionally co-authored if its authors had different institutional affiliations.
This definition was operational because the Madrilenian addresses appearing in the records were standardized by semi-automatic procedures to place a given organization, regardless of how it was cited, under a single denomination. Each institution was allocated to one of the following sectors: government, Spanish Scientific Research Council mixed centres, Spanish Scientific Research Council, health system, universities, private enterprise, public research bodies and other types of institutions.
In this study cooperation was estimated primarily on the basis of the documentary universe, with no further restrictions: in other words, from all the various types of documents listed in the three source databases. One of the problems that arises in bibliometric analysis of scientific disciplines is the manner in which documents are assigned to the different scientific areas. In large-scale analyses, the only practical information on the allocation of documents to a given subject field on the grounds of origin is provided by the subject categories into which the ISI divides published scientific knowledge in its Journal Citation Reports (JCR), for listing the journals where papers are published. These ISI categories were subsequently re-classified to establish more restricted schemes such as the ANEP scheme chosen for the present analysis. ANEP, the Spanish National Agency for Evaluation and Prospective Studies, is a Ministry of Science and Innovation body under the aegis of the Secretariat of State for Universities (ANEP 2006).
ANEP's expert evaluators assign to each ANEP class the ISI-JCR categories they deem appropriate. As in the ISI-JCR, one and the same category can be listed under different ANEP classes (Olmeda-Gómez et al. 2007a). The use of journal classifications to divide and then reclassify articles into subject categories, is widely accepted in bibliometric studies (Grupp and Hinze 1994; Katz et al. 1995; Glanzel and Lange 2002; Ma and Guan 2005; CINDOC 2006) and has been proposed and used as a unit for visualizing specific scientific domains (Moya-Anegón et al. 2004) as well as in many SCImago´s research reports (Olmeda-Gómez et al. 2007b).
Taking total regional production as a point of departure, matrices were generated from the type distribution of documents authored by Madrilenian institutions pertaining to some one of the three sectors studied (intra-regional cooperation). Only the subject categories with the highest percentage of intra-regional cooperation were selected (Table 1).
Confirmation or reciprocity is an important property of links in social networks. The degree of confirmation is determined not by the definition of the link but by the extent to which two nodes report the same relationships with one another in a given content area (Tichy and Tushman 1979). An asymmetric co-authorship index was used to show bidirectional reciprocity, as reflected by the direction of the arrows in the maps constructed, and thereby determine the degree of asymmetry in such cooperative relations; in other words, to identify the lack of reciprocity in or confirmation of the importance that any two partner institutions may represent for one another. The idea was borrowed from the affinity index used to measure asymmetric relations between two countries and adapted to reflect first of all, the scientific importance of given partnerhips in total co-authorship (Zitt et al. 2000). It was calculated from the following formulas used to measure the direction of cooperation between any two nodes:


In the map charted for this purpose, the arrows indicate the direction of the dependence of the institution in question with regard to the organizations to which it is connected. Thickness denotes the strength or intensity of the inter-dependence.
The maps charted to visualize university-government-company relations in the region of Madrid were generated from social network analysis as described above. The resulting matrices were processed and analysed with Pajek software and graphed with the Kamada-Kawai algorithm (1989). The final networks were exported for scalable vector graphics (SVG) formatting.
Table 1 gives the cooperation rate, i.e., the proportion of the production contained in the WoS for the Community of Madrid that was inter-institutionally co-authored, along with the distribution by type of cooperation. The following were defined: “no cooperation”, signed by a single institution; “intra-regional” cooperation, signed by at least two institutions located in Madrid; “national” cooperation, signed by at least one other Spanish institution outside Madrid and “international” cooperation, when at least one foreign institution was involved. Therefore, “intra-regional” data are not found only in that category, for some may also be included under “national” or “international” collaboration. “Physiology and Pharmacology”, “Medicine” and “Molecular, Cellular and Genetic Biology” were the subject categories with the highest percentages of intra-regional cooperation, with the highest value being recorded for medicine (24.57%).
| Class | Ndoc* | Ndoc cp** | Type of cooperation | Ndoc | Ndoc cp | Type of cooperation | ||||||
|---|---|---|---|---|---|---|---|---|---|---|---|---|
| None | Intrareg | Ntal | Interntal | % None | % Intrareg | % Ntal | % Interntal | |||||
| AGR | 1442 | 690 | 752 | 215 | 482 | 275 | 2.19 | 47.85 | 52.15 | 14.91 | 33.43 | 19.07 |
| ALI | 1327 | 515 | 812 | 192 | 340 | 213 | 2.01 | 38.81 | 61.19 | 14.47 | 25.62 | 16.05 |
| CIV | 256 | 112 | 144 | 28 | 55 | 67 | 0.39 | 43.75 | 56.25 | 10.94 | 21.48 | 26.17 |
| COM | 2597 | 1371 | 1226 | 338 | 788 | 751 | 3.94 | 52.79 | 47.21 | 13.02 | 30.34 | 28.92 |
| CSS | 679 | 324 | 355 | 72 | 194 | 175 | 1.03 | 47.72 | 52.28 | 10.60 | 28.57 | 25.77 |
| DER | 13 | 5 | 8 | 1 | 5 | 1 | 0.02 | 38.46 | 61.54 | 7.69 | 38.46 | 7.69 |
| ECO | 457 | 292 | 165 | 59 | 162 | 174 | 0.69 | 63.89 | 36.11 | 12.91 | 35.45 | 38.07 |
| ELE | 34 | 24 | 10 | 0 | 16 | 11 | 0.05 | 70.59 | 29.41 | 0.00 | 47.06 | 32.35 |
| FAR | 3246 | 1928 | 1318 | 599 | 1264 | 903 | 4.93 | 59.40 | 40.60 | 18.45 | 38.94 | 27.82 |
| FIL | 1425 | 113 | 1312 | 40 | 86 | 29 | 2.16 | 7.93 | 92.07 | 2.81 | 6.04 | 2.04 |
| FIS | 11145 | 7958 | 3187 | 1453 | 3499 | 6153 | 16.91 | 71.40 | 28.60 | 13.04 | 31.40 | 55.21 |
| GAN | 577 | 349 | 228 | 72 | 235 | 175 | 0.88 | 60.49 | 39.51 | 12.48 | 40.73 | 30.33 |
| HIS | 1037 | 76 | 961 | 27 | 48 | 34 | 1.57 | 7.33 | 92.67 | 2.60 | 4.63 | 3.28 |
| MAR | 4827 | 2846 | 1981 | 646 | 1397 | 1779 | 7.33 | 58.96 | 41.04 | 13.38 | 28.94 | 36.86 |
| MAT | 2162 | 1378 | 784 | 289 | 686 | 877 | 3.28 | 63.74 | 36.26 | 13.37 | 31.73 | 40.56 |
| MEC | 807 | 440 | 367 | 97 | 200 | 285 | 1.22 | 54.52 | 45.48 | 12.02 | 24.78 | 35.32 |
| MED | 22499 | 12747 | 9752 | 5528 | 10052 | 4216 | 34.14 | 56.66 | 43.34 | 24.57 | 44.68 | 18.74 |
| MOL | 12546 | 7634 | 4912 | 2408 | 4764 | 4021 | 19.04 | 60.85 | 39.15 | 19.19 | 37.97 | 32.05 |
| PSI | 776 | 333 | 443 | 79 | 222 | 146 | 1.18 | 42.91 | 57.09 | 10.18 | 28.61 | 18.81 |
| QUI | 7244 | 4120 | 3124 | 1094 | 2285 | 2390 | 10.99 | 56.87 | 43.13 | 15.10 | 31.54 | 32.99 |
| TEC | 159 | 72 | 87 | 15 | 46 | 34 | 0.24 | 45.28 | 54.72 | 9.43 | 28.93 | 21.38 |
| TIE | 2319 | 1544 | 775 | 299 | 937 | 929 | 3.52 | 66.58 | 33.42 | 12.89 | 40.41 | 40.06 |
| TQU | 628 | 352 | 276 | 71 | 189 | 203 | 0.95 | 56.05 | 43.95 | 11.31 | 30.10 | 32.32 |
| VEG | 2935 | 1640 | 1295 | 340 | 897 | 950 | 4.45 | 55.88 | 44.12 | 11.58 | 30.56 | 32.37 |
| Total | 65896 | 46863 | 34274 | 13962 | 28849 | 24791 | 71.12 | 52.01 | 21.19 | 43.78 | 37.62 | |
The percentage production by type of sector in the two sub-periods into which the overall period was divided, along with the production attributed to each of the sectors in the categories in question, are shown in Table 2. These data were used for the micro-analysis of cooperation among the three institutional sectors studied. The combined weight of the three sectors did not exceed 30% in any of the categories, because other organizations, primarily research hospitals or public research bodies, were very productive in these areas, particularly in Medicine and Physiology and Pharmacology. The research output measured for the organizations studied is lower in these last areas. The percentage increase in industrial research in the areas of Physiology and Pharmacology between periods failed to raise output in 2000-2003. One possible inference is the existence of papers in which all the co-authors are companies. As result of the high university rate of productivity, three in ten medical articles were authored by private firms with government or university involvement. The private sector (18.03% in 1995-1999), like the government and universities, cooperated most intensely in Molecular, Cellular and Genetic Biology, a class in which authors from twelve universities published very actively.
| Physiology and Pharmacology | Medicine | Molecular, Cellular, Genetic Biology | ||||||||||
|---|---|---|---|---|---|---|---|---|---|---|---|---|
| % Institutions* | % Ndoc cp | % Institutions | % Ndoc cp | % Institutions | % Ndoc cp | |||||||
| Sector | 95-99 | 00-03 | 95-99 | 00-03 | 95-99 | 00-03 | 95-99 | 00-03 | 95-99 | 00-03 | 95-99 | 00-03 |
| University | 6.11 | 5.88 | 6.44 | 6.32 | 2.70 | 2.89 | 23.37 | 24.79 | 4.92 | 4.95 | 45.03 | 42.63 |
| Enterprise | 9.92 | 12.35 | 1.09 | 1.79 | 11.03 | 12.16 | 1.96 | 4.18 | 18.03 | 16.67 | 4.77 | 6.56 |
| Government | 2.29 | 4.12 | 0.34 | 0.61 | 5.88 | 6.39 | 0.72 | 0.66 | 6.56 | 7.66 | 0.43 | 0.70 |
| Total | 18.32 | 22.35 | 7.87 | 8.72 | 19.61 | 21.44 | 26.05 | 29.63 | 29.51 | 29.28 | 50.23 | 49.89 |
As indicated above, a second approach to the study of scientific article co-authorship focused on the analysis of the relationships between inter-institutional co-authors. Social network analysis methods geared to subsequent micro-analysis could be introduced in the study because of the way co-authorship relationships were defined: namely, as the associations found in documents contained in the Web of Science and produced in Madrid in the ANEP subject categories Medicine, Physiology and Pharmacology and Molecular, Cellular and Genetic Biology, signed by university, private enterprise and governmental organizations.
In the present study, social network analysis was a source of tools for reviewing a series of properties referring to: 1) the general structure of the network of relationships induced by co-authorship and 2) the position occupied by individual, or groups of, actors in the overall structure or with respect to other actors. In this context, one aspect of particular interest was how the general structure of the relationship network was reflected in the degree of integration or coherence exhibited. Information was likewise sought on the position of each of the actors in the overall structure and, as in the case of structure, any variations in those positions.
A number of quantitative indicators for the university-government-private enterprise network structure in the Community of Madrid are given in Table 3.
| Physiology and Pharmacology | Medicine | Molecular, Cellular, Genetic Biology | ||||
|---|---|---|---|---|---|---|
| 1995-1999 | 2000-2003 | 1995-1999 | 2000-2003 | 1995-1999 | 2000-2003 | |
| Nodes | 24 | 36 | 55 | 70 | 26 | 30 |
| Number of connections | 64 | 92 | 190 | 268 | 68 | 88 |
| Density | 0.239 | 0.146 | 0.127 | 0.110 | 0.209 | 0.202 |
| Average degree | 5.33 | 5.11 | 6.90 | 7.65 | 5.23 | 5.86 |
| Number of components | 1 | 3 | 3 | 3 | 1 | 1 |
| Size of largest component | 24 | 32 | 51 | 66 | 26 | 30 |
| % main component | 100% | 88.8% | 92.7% | 94.2% | 100% | 100% |
| Size of 2nd largest component | - | 2 | 2 | 2 | - | - |
| Degree centralization | 0.63 | 0.46 | 0.58 | 0.53 | 0.53 | 0.74 |
| Betweenness centralization | 0.58 | 0.56 | 0.51 | 0.43 | 0.50 | 0.77 |
| Mean closeness score | 2.11 | 2.47 | 2.31 | 2.43 | 2.19 | 2.25 |
| Maximum distance/diameter | 3 | 4 | 5 | 5 | 3 | 5 |
| Clustering coefficient | 0.047 | 0.022 | 0.023 | 0.019 | 0.041 | 0.034 |
Network density, expressed as the relationship between the actual over the total possible number of connections is low, for a given author. It is nonetheless recommended as a measure of group cohesion and to quantify network knittedness. Network density is not, however, a particularly useful indicator if the values are small, such as in the examples studied here, for it depends on network size.
The number of links at each vertex, i.e., the normalized degree for a vertex, is a more informative parameter. The vertices having the highest degree are located in the densest part of the network. The greater the number of nodes with high degree values, the denser is the network, for it means that the vertices have more inter-connections. Accordingly, the average degree for all vertices can be used as a measure of structural coherence in networks, with the advantage that this value is independent of network size and can be used to compare networks of different sizes. Both in Medicine and Molecular Biology, this indicator was observed to increase across the two periods studied, denoting a rise in the number of links among network actors in the years in question and suggesting that a denser network was formed among relevant actors in academia, industry and government at the end of the period. Conversely, the Physiology and Pharmacology network was more sparse despite the incorporation of twelve new actors.
All the networks consisted of a very small number of subgroups or components. On these graphs, a component is the maximum number of connected sub-graphs and the main component is the largest subset of directly inter-linked organizations.The number of components was not high, an indication that there were few unconnected nodes formed part of alternate networks still in an early phase. The percentage of organizations connected to the main component was never under 88.8% of the co-authors in any of the networks. The number of Physiology and Pharmacology network components grew thanks to the existence of new entrants not linked to the main component. The Molecular Biology network, by contrast, had only one component because links can be established between any node pair and the four new entrants were linked to the existing component.
'Degree centralization of a network is the variation in the degrees of vertices divided by the maximum degree variation which is possible in a network of the same size' (Hanneman and Riddle 2005). This group level centralization index measures the variability or heterogeneity of node centralities and records the extent to which one of the actors is characterized by high and the others by low centrality. The value of this index ranges from zero to one. A value of one means that a given node is connected to all the other nodes on the network and each of the others interacts only with that initial node; the result is a star-shaped network, where one node or actor dominates the network entirely, overshadowing all the others. Zero in turn means that all nodes have the same degree, giving rise to a circular graph. The highest values found for the networks studied here, 0.63 (1995-1999) for Physiology and Pharmacology and 0.74 (2000-2003) for Molecular, Cellular and Genetic Biology, were consistent with the respective graphic representations.
A given node's importance in the circulation of information within a network can be explained by the concept of betweenness. In this case the indicator is betweenness centralization, 'which measures the variation in vertex betweenness values in a network divided by the maximum possible variation in betweenness values in a network of the same size' (Hanneman and Riddle 2005). Hence, different networks can be compared on the grounds of the heterogeneity of network members' betweenness (Wasserman and Faust 1994). At the group level, it measures whether co-authorship networks are compact, i.e., whether the distances between pairs of nodes are short because they are connected across the same intermediaries. This would be the case of the Biology (2000-2003, 0.77), but not the Medicine network (2000-2003, 0.43).
The clustering coefficient, a measure introduced by Watts and Strogatz (1998), measures the degree of cooperation of a given author's co-authors and is calculated as the arithmetic mean in each of the networks. A high clustering coefficient value suggests the formation of extremely densely connected local areas in different networks. It is an indicator of network transitivity, in other words of mean network density in the vicinity of a node. In such cooperation networks it is, therefore, an indicator of the tendency of the network to form small groups or clusters. Due to the very low values in this study, no community or group of nodes sharing similar properties could be identified in any of the networks.
To simplify the centrality data of nodes, the organizations with the highest normalized degree and betweenness values in the university-government-enterprise cooperation networks, in 1995-03, are listed in Table 4. The ten organizations with the highest normalized degree and betweenness values were selected. The organizations in normal typeface are universities, while the ones in italics are companies or public bodies.
Degree values are generally used to identify network leaders. The maximum centrality degree values are associated with the best reputation or greatest influence in a network, structurally speaking; in this case they also measure the cooperative activity of each network node. As the data show, in 1995-1999, the highest degree values were found for three universities, the Complutense University of Madrid, Autonomous University of Madrid and University of Alcalá de Henares. These three actors had the highest degree values, played the main role in the shaping of the university-government-enterprise cooperation networks in the Community of Madrid and were the most structurally influential. A smaller number of companies than of universities was found in these top ten positions, denoting a lower joint production of scientific papers. Such low betweenness values indicate that while companies cooperated with some other centre, undoubtedly a university, they had no role in network gatekeeping. Indeed, some organizations were invisible because they scored zero in betweenness: they did not serve as inter-organizational hubs.
| Organization | Physiology and Pharmacology | Medicine | Molecular, Cellular, Genetic Biology | |||||||||
|---|---|---|---|---|---|---|---|---|---|---|---|---|
| Degree* | Betweenness | Degree* | Betweenness | Degree* | Betweenness | |||||||
| 95-99 | 00-03 | 95-99 | 00-03 | 95-99 | 00-03 | 95-99 | 00-03 | 95-99 | 00-03 | 95-99 | 00-03 | |
| UCM | 0.69 | 0.51 | 0.60 | 0.57 | 0.62 | 0.57 | 0.52 | 0.44 | 0.60 | 0.79 | 0.53 | 0.79 |
| UAH | 0.34 | 0.22 | 0.19 | 0.22 | 0.27 | 0.31 | 0.22 | 0.17 | 0.28 | 0.24 | 0.36 | 0.14 |
| UAM | 0.34 | 0.28 | 0.13 | 0.19 | 0.44 | 0.43 | 0.27 | 0.29 | 0.48 | 0.34 | 0.09 | 0.12 |
| UPM | 0.11 | 0.11 | 0.01 | 0.05 | 0.16 | 0.17 | 0.13 | |||||
| UC3M | 0.05 | 0.09 | 0.10 | 0.04 | 0.13 | |||||||
| CEUM | 0.21 | 0.08 | 0.07 | 0.09 | 0.05 | 0.02 | 0.16 | 0.06 | 0.01 | |||
| UNED | 0.17 | 0.09 | 0.07 | 0.12 | 0.06 | 0.02 | ||||||
| UEM | 0.13 | 0.08 | 0.09 | 0.11 | 0.03 | |||||||
| GLAXM | 0.08 | 0.05 | 0.12 | 0.10 | ||||||||
| TEDEC | 0.08 | |||||||||||
| LILLY | 0.08 | 0.08 | ||||||||||
| INEFM | 0.08 | |||||||||||
| KNOLL | 0.14 | 0.18 | ||||||||||
| BIOMETN | 0.05 | |||||||||||
| INTM | 0.09 | 0.13 | 0.01 | 0.01 | ||||||||
| CIBEST | 0.09 | 0.02 | 0.03 | 0.02 | ||||||||
| ALK | 0.08 | 0.10 | ||||||||||
| TABAC | 0.04 | 0.03 | ||||||||||
We utilize Pajek to present a series of images of the evolution of the networks using Kamada-Kawai algorithm (Kamada Kwai 1989).
This algorithm assigns coordinates to the nodes, trying to adjust as much as possible the distances existing among them with respect to theorethical distances. Its use is widespread in the representation of social networks, owing to the assignment of an unitary distance to each link; and it offers very good results in the esthetic sense, along with adequate computation times for its application (Vargas-Quesada and Moya-Anegón 2007: 51-52).
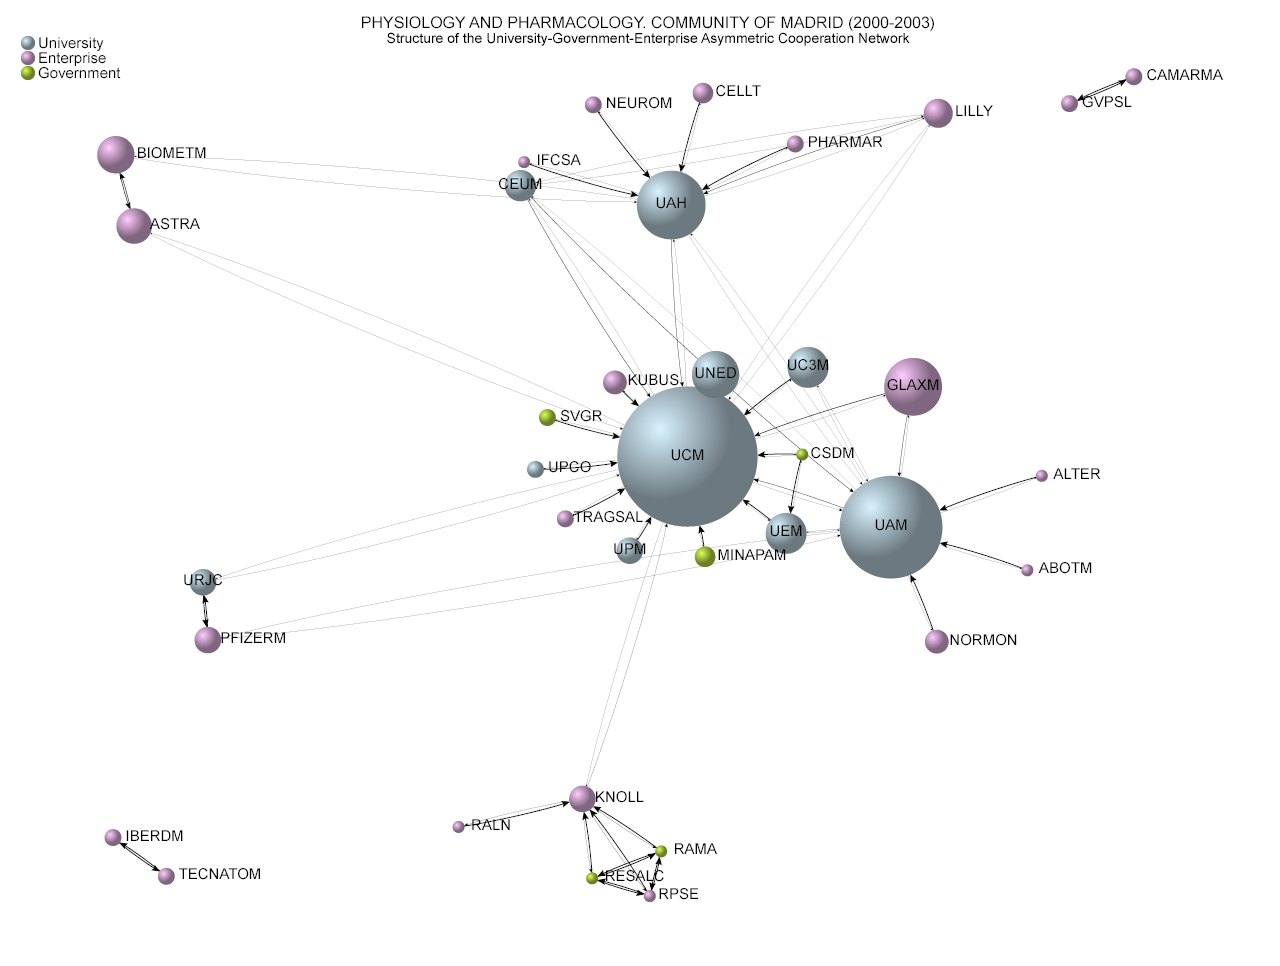
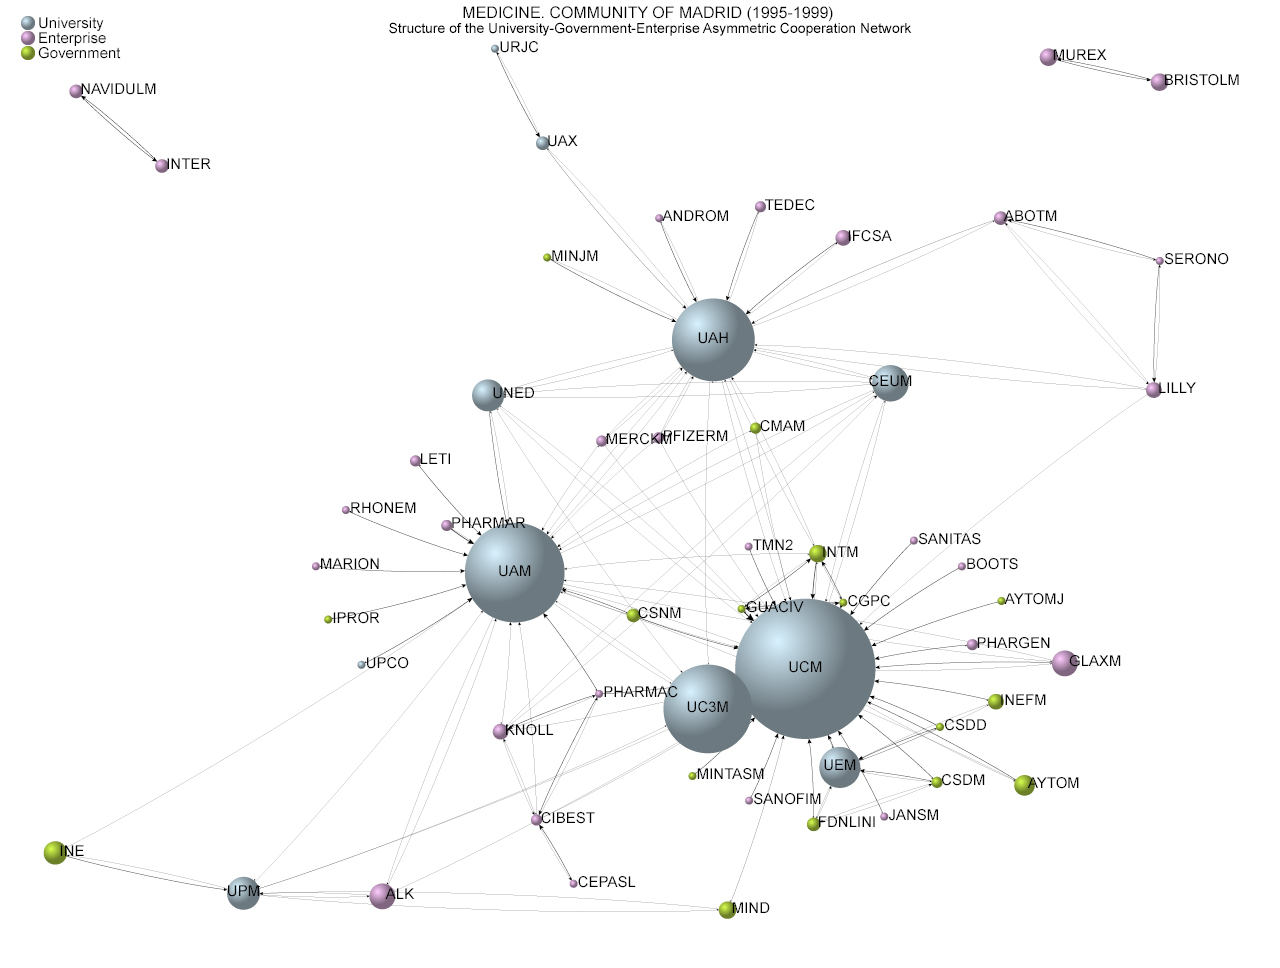
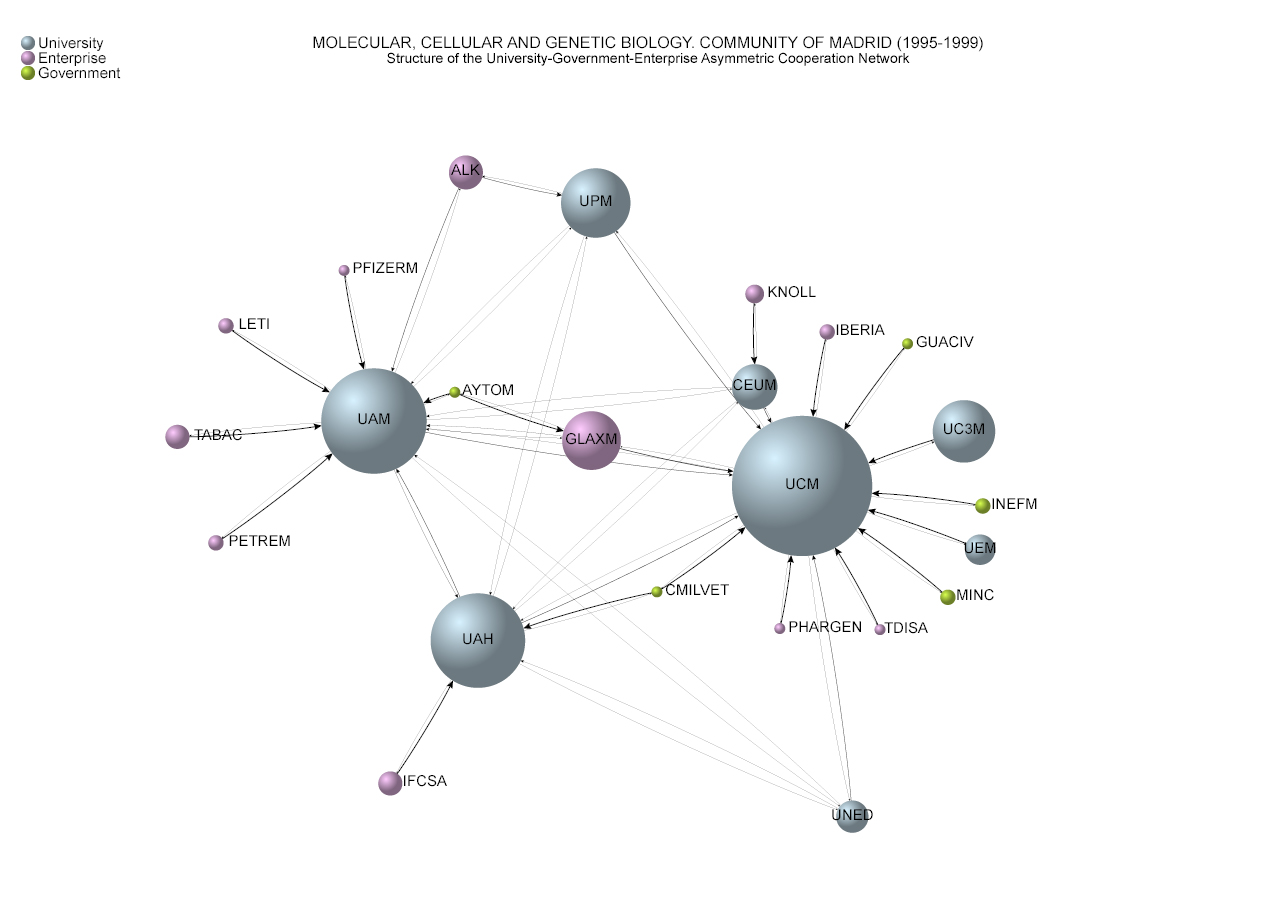
Two sets of images, 1995-1999 and 2000-2003, were plotted for asymmetric cooperation networks in each class covered by our database (Figures 2 a-b to 4 a-b). Node colour indicates the type of organization: sky blue for universities, violet for private enterprise and green for government agencies. Node diameters are proportional to each institution’s co-authorship scientific output for each period.
The graphs shows a structure with several centres and peripheries, where the universities with the highest degrees constituted the centres and the peripheries were comprised by companies and other organizations, most of which had connections with the universities only (Borgatti and Everett 1999). The figures shown below provide an overview of the different central organizations and the constellations and sizes of the peripheral organizations.
Several key features, particularly prominent in the Physiology and Pharmacology network (Figure 2a-2b), were shared by all the networks as a whole. The prevailing colours were blue followed by violet, indicating that the most active participants were universities and enterprises, with government agencies playing a minor role. The largest node in the centre of the graphic display represented the Complutense University of Madrid, the central node in this star or radial network. Note the very active role played by UCM researchers in forging co-authorship ties with multinational firms such as Glaxo Wellcome, Lilly, Merck Serono and Boehringer Ingelheim, as well as Spanish biotech firms such as Pharmar or Kubus, which specialize in assisted reproduction for swine.
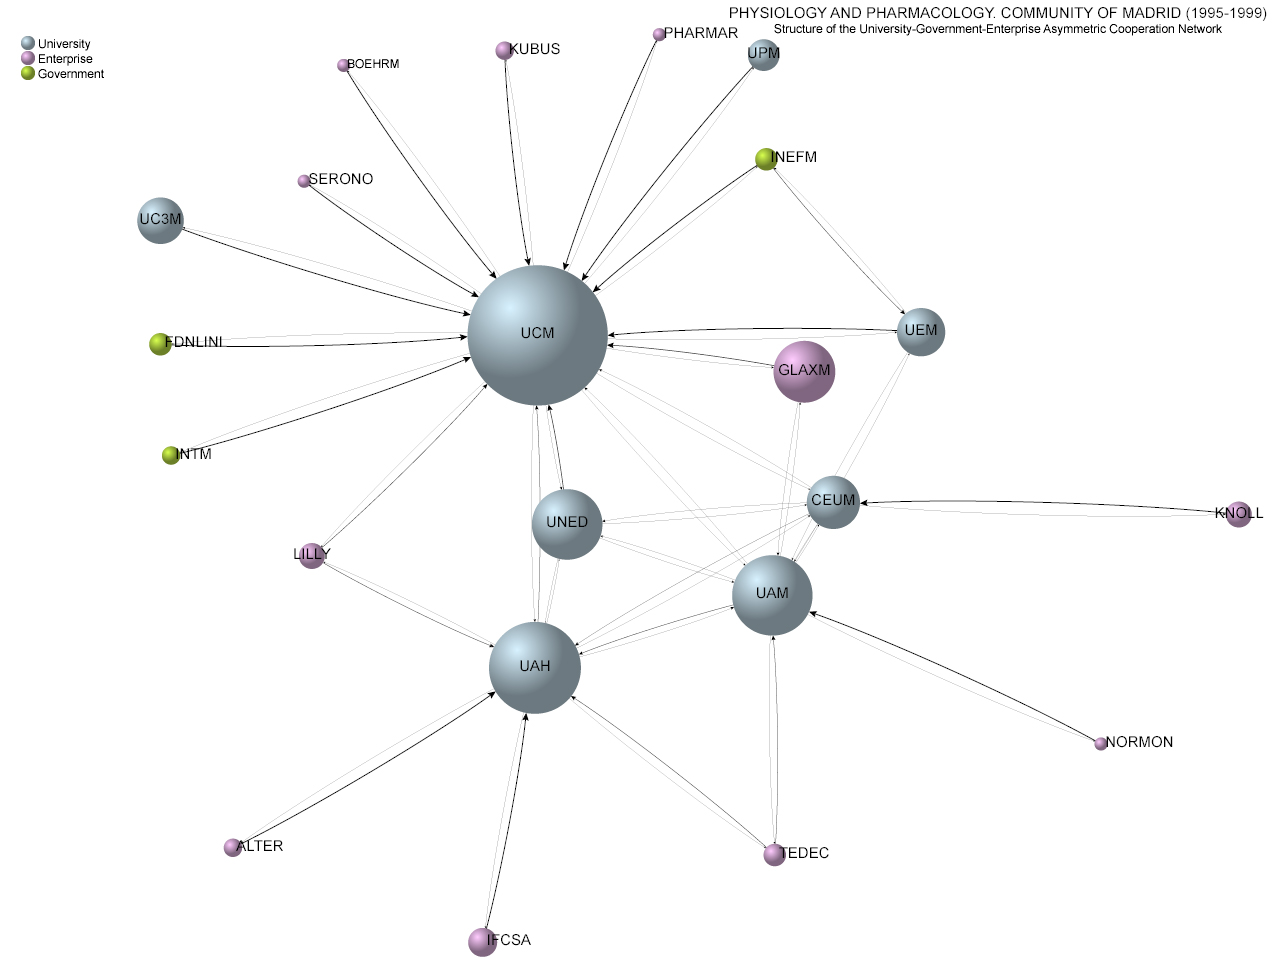
Local Spanish pharmaceutical firms such as Alter, Tedec, IFCSA or Normon established clear ties with two other universities: The Autonomous University of Madrid and the University of Alcalá de Henares, while Knoll, a subsidiary of Abbott Laboratories, partners with a private Catholic university, CEUM.
Figure 2b show the configuration of the new ties and nodes added in 2000-2003. The graph reflects the growing intricacy of participants' activity and reveals expanded collaboration. Large blue nodes can be seen at the centre of the new network, along with a shift in the composition of the most intensely connected participants. Another prominent characteristic is the diversity of types of organizations at the centre of the network (UCM) and their positions: large pharmaceutical companies (Glaxo, AstraZeneca, Lilly, Knoll), research universities (UAM, UAH, URJC, UNED) and public and private Spanish firms (Tragsal and Kubus).
Medicine networks (Figures 3a and 3b) exhibit certain similarities, along with substantial differences. Universities, particularly the UCM, predominate, orbited by government entities and many private companies. University ties, the backbone for the two networks, were intensified, as shown by the shift in the positions to closer proximity among UCM, UCH and UAM in the period 2000-2003. The government entities involved were: Forensic Division of the Police Force (CGCP), the National Toxicology Institute (INTM), the Council for Nuclear Security (CSNM) and a number of central Government departments such as the Ministries of Defence and Agriculture, Fisheries and Food (now Agriculture and the Environment), the National Sports Council and the National Institute for Consumer Affairs.
In 2000-2003 network structures increased in size, due primarily to the appearance of new companies and government bodies, a reflection of the intensification of scientific paper co-authorship. Subsidiaries of large multinationals such as Glaxo Wellcome, ALK Abello, Lilly-España Laboratories, Pfizer, Celltech-Pharma and Aventis appeared, along with small and medium-sized domestic enterprises such as Pharmamar, Laboratorios Leti, Pharma Gen, Laboratorios Normon and Biomet.
None of these small and medium-sized companies was a core participant, nor did they serve as hubs as a general rule. Rather, they entered the networks through their association with a large organization, such as a university. This finding is consistent with observations in other papers to the effect that the publication of scientific articles is not one of the most relevant activities from the standpoint of corporate relations with universities (Meyer-Krahmer and Schmoch,1998; Schartinger et al. 2002), even though companies regard scientific papers to be the prevalent channel for obtaining information from public research bodies that can be incorporated into their own research projects (Cohen et al. 2002).
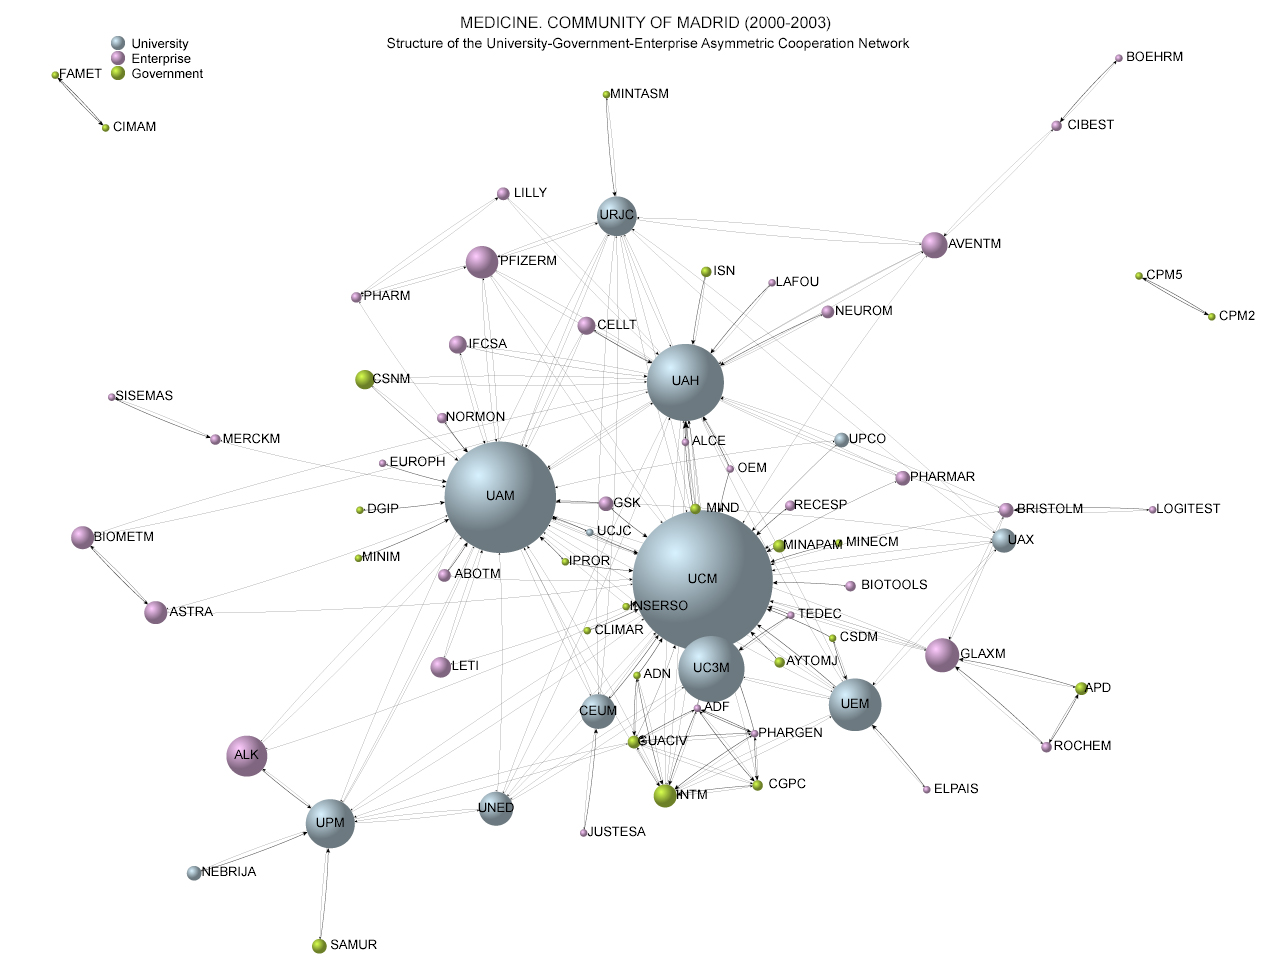
Connections in areas like Medicine are often forged with a specific goal in mind, such as conducting experiments with a new drug when financing is available. This may explain the dyadic relations between the Spanish Army’s Light Aircraft Corps (FAMET) and the Training Center of Aerospace Medicine (CIMAM) or between two penitentiaries (CPMS-CPM2).
The Molecular, Cellular and Genetic Biology network is shown in Figures 4a and 4b. In the earlier period, the centre was again occupied by the multi-connected nodes representeing two universities, the UCM and the UAM. A group of well known biomedical multinational firms appeared as UAM satellites: Pfizer Glaxo Wellcome and ALK Abello. The Spanish firms interconnected with this university included Laboratorios Leti, Tabac and Petrem. UCM researchers, by contrast, were associated with a variety of types of organizations, showing a preference for diversity in light of their ability to undertake many activities with different partners.
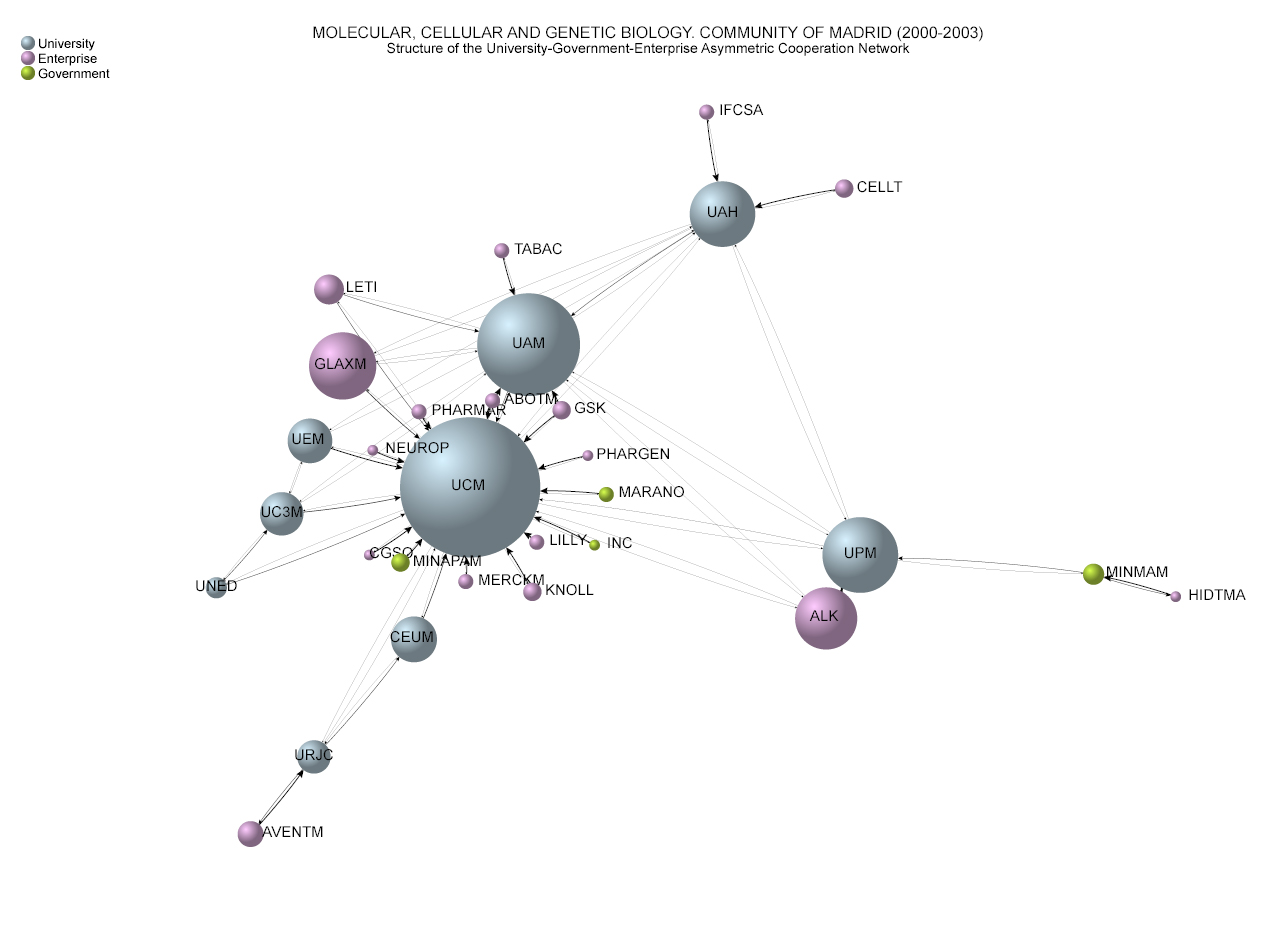
The new ties appearing in the 2000-2003 graph reflect the growing complexity in participants' co-authorship activities. Centre-left of the network, the diversity of organizations circling the UCM includes universities, local and multinational firms and government entities. Powell et al., in their article about network collaboration in the life science industry, observe that: “such diversely anchored, multi-connected networks are less likely to unravel than networks reliant on a single form of organization for their cohesiveness”. (Powell et al. 2005: 1161), such was reasoned by Albert et al. (2000).
The choices made by new entrants such as Merck, Glaxo Smith Kline (GSK), Lilly, CGSO and NeuroPharma appear to follow a rich-get-richer pattern of inter-connections. In such a model, the probability of a new vertex connecting to the existing vertices is uneven; it is more likely to be linked to a vertex that already hosts a large number of connections (Merton 1968; Barabasi and Reka 1999). Note that two large biomedical firms, Aventis and Celltech, departed from this model, linking with partners with scant diversity such as the UAH and Madrid's most recently established biomedical university (URJC), suggesting the existence of other connection mechanisms. To address these questions, information is required about the cast of participants, their repertoire of activities and the sequences linking partners and activities, none of which is available in the data studied here.
This article reviewed the formation of university-government-enterprise cooperation networks in three bio-medical and physio-pharmacological domains in the Community of Madrid. Social network analysis and data on the inter-institutional co-authorship of documents appearing in the Web of Science were used in the study.
Analysis techniques were used to build and visualize the microstructure of the intraregional cooperation network in the Community of Madrid. The mean degree values found indicate that the number of connections grew in at least in two areas, despite declines in density. The network structure was observed to rest on the public universities, which showed the highest degree and betweenness values, while the Complutense University of Madrid (UCM) was the central-most actor in all the subject categories.
The universities played a pivotal and crucial role in the establishment of cooperative networks for scientific papers, very likely facilitating the flow of scientific and technical information across the scientific communities in the three domains studied. In fact, comparing the order of magnitude of the three centrality measures, these graphs should be described as “one-cluster network which contains a circle involving a large proportion of points in the network” (Nakao 1990: 13).
Network evolution showed an increase in links among participants, creating connections with other centres working in similar areas, as can be seen in the mean closeness values given in Table 3. This affords researchers opportunities to associate with other knowledge centres and consequently to overcome the distance between organizations working in the same subject category. A shorter distance (=greater closeness) between organizations does not, naturally, mean a shorter cognitive distance, but it may infer a higher potential for the pursuit of new ideas.
In the networks studied, node distribution appears to follow the cumulative advantage model formulated by Price (1965), presently known as preferential attachment. Here, the probability of a new node’s connecting to any of the existing nodes on the network is uneven, inasmuch as it is much more likely to link up with a vertex that already hosts a large number of connections (Barabasi and Albert 1999). By associating with the node that is already more heavily inter-connected than any other, new nodes strengthen its role as the centre of the structure.
Analysing networks similar to the ones shown here, a number of authors have suggested that the clustering coefficient is an indicator of the existence of a subject-oriented approach (see, e.g., Wagner et al. 2005). Higher clustering coefficients may denote the existence of convergence around a technical solution, whereas low coefficients may reflect several competing and changing objectives. So the decline in the clustering coefficient may evince varying and competing focuses and approaches to the subject matter.
Although the scope of this research was partial and preliminary, the study showed that university researchers may play an essential role in establishing research and development networks involving universities, industries and public sectors, thereby furthering technological and institutional change in the Community of Madrid. Nonetheless, cooperative network structures and organizations suggest that initiatives should be taken to enable networking to contribute significantly to the intensification of the establishment of links among the three sectors involved.
The study also showed the possibility of applying quantitative as well as visualization and social network analysis techniques to examine the cooperative structures linking universities, private enterprise and government within a regional context of innovation. At the same time, it introduces an approach to the analysis of cooperative network dynamics in the fields studied. Although the survey was limited to Madrid and three sectors, a comparative study could be conducted to analyse the similarities and differences with others Spanish autonomous communities (or regions); this study could also be enlarged to include data from the analysis of research hospitals outputs, public bodies, projects or patents.
The authors would like to thank two anonymous referees for their valuable and helpful comments on various drafts of this paper. This research is supported by grants from Comunidad de Madrid (06/HSE/0166).
| Find other papers on this subject | ||
|
© the authors, 2008. Last updated: 23 September, 2008 |
