vol. 14 no. 1, March 2009
vol. 14 no. 1, March 2009 | ||||
Reference is a joint endeavour between an information provider and an information seeker. Although an encounter is shared and mutually developed, each participant comes to it with a set of expectations. Likewise, participants leave an encounter with their own perceptions of its success. These expectations and perceptions are often latent and must be inferred from clues during the interaction such as body language, tone of voice and expressions of gratitude. These cues are challenging to decipher in face-to-face encounters and can be completely absent in virtual reference interactions.
The best way to improve any skill is to make adjustments to behaviour based on accurate and prompt feedback (Anderson 2004). The only immediate feedback most reference providers receive is their own speculation of a user's perception of an encounter. If these assumptions about user perceptions and satisfaction are incorrect, there might be problems, particularly if providers have systematic biases. For example, virtual reference providers might feel anxious because they wrongly assume that users want them to reply quickly when instant messaging. Or, providers might assume that users are satisfied when offered only a few references, when in fact users might prefer a more comprehensive set of resources. Providers might spend too much time and effort on aspects of the interaction that users do not value and too little time and effort on things that users do value.
In this paper we make several contributions that help us understand the discrepancies between user and provider perceptions. First, we summarize and critique the limited literature on the topic and identify a phenomenon we refer to as provider pessimism. That is, users of a service are more satisfied than providers estimate. Second, we introduce the pair perception comparison method designed to systematically compare user and provider perceptions of the same encounters. Third, we use this method to study instant messaging reference encounters, showing several ways in which new reference providers underestimate satisfaction levels of undergraduate users. Finally, we discuss how knowledge of these biases can help reference providers better align their perceptions and behaviour with those of their users.
The majority of studies about reference services are designed to evaluate factors that lead to success of these services. Success is estimated using measures of accuracy (typically assessed by experts), user satisfaction and/or users' willingness to return (Saxton and Richardson 2002). Most reference studies collect data by surveying users or providers, but rarely both. Studies of virtual reference transcripts are also common (e.g., Beaubien-Bennet et al. 2004; Fagan and Desai 2002/2003; Radford 2006); however, they do not directly measure the perceptions of users and providers.
Only a few studies have compared user and provider perceptions of the same reference encounter. These studies generally examined face-to-face reference in academic libraries and relied on surveys of users and providers immediately after an encounter to measure satisfaction. Surveys typically asked multiple questions of users and providers, only some of which allowed for direct comparison of answers. All of them asked about perceived satisfaction and several asked about the appropriateness of the amount of information provided. Alternative methods include open-ended interviews (Radford 1999) and responses to videotaped reference sessions (Michell and Harris 1987). Table 1 summarizes the key articles, as well as the current study for comparison. Despite some differences in setting and methods, all of the studies found evidence for provider pessimism.
As far back as 1976 (Howell et al. 1976) and as recently as 2008 (Miller 2008), researchers have identified provider pessimism in face-to-face reference encounters using survey-based methods. Studies based on the widely used Wisconsin-Ohio Reference Evaluation Program (WOREP) survey and its predecessors have compared some answers of users and providers(Bunge 1991; WOREP 2007). Unfortunately the questions and answer choices were different, making direct comparison problematic.
The largest study to date was performed by Whitlatch who believed that evaluation of library services should be based on 'three issues: the librarian's perceptions of the quality of service; the library user's perception of the quality of service; and whether or not the information sought was located' (Whitlatch 1990: xiii). Whitlatch collected data on individual reference encounters at academic libraries by having users and providers complete separate surveys, which were later compared for analysis. Users reported their own perceptions of the encounter on a seven-point Likert scale. Librarians were asked how they thought the user viewed the encounter, using the same scale. Users consistently rated the quality of service higher than providers thought they would Whitlatch 1990: 86-87). However, Whitlatch found that providers more accurately estimated the users' satisfaction with the number of references provided and their relevance.
In her 1999 book, Radford emphasized the dual nature of communication and sought to study both librarians' and patrons' perceptions of reference encounters through qualitative interviews. In addition to other methods, she used a qualitative form of paired perception analysis. In determining whether a reference interaction was successful, she found that librarians valued content and finding the right resources; whereas patrons valued relational dimensions and personal treatment (Radford 1999: 104). In three of the twenty-seven cases, she found evidence of extreme provider pessimism: users perceived the encounter to be successful, while providers considered it a failure(Radford 1999: 102). In contrast, she did not find any cases where users were more critical than librarians. Since each encounter was classified as a failure or a success, rather than a scale of perceived success, it is difficult to determine if less extreme examples of provider pessimism existed.
Michell and Harris (1987) separately showed public library users and librarians several short videotapes of reference transactions and compared reactions to the tapes. They found that librarians (particularly female librarians) were more critical of the videotaped librarians' competence than users were. Both users and librarians thought that friendlier librarians were more competent. The major limitation of the Michell and Harris study design is that librarians and patrons are not reacting to their own reference encounter.
Despite their informative findings, previous studies have some limitations that require further work in this area. First, they were performed exclusively in face-to-face settings. Secondly, they collected data from users and providers on only a few factors of interest and these data were not always collected in a way that allows for direct comparison (Table 1). Thirdly, they do not use statistical techniques that take into consideration the paired nature of the data (Table 1). Finally, they either asked providers how satisfied they were with their own performance (A), or how satisfied they think the user was (B). These are two very different things. Both should be asked of providers so they can be compared with the user's perception of the quality (C). See Figure 1 in the Methods section for more detail on this issue.
| Study | Pairs (n) | Setting | Statistical measures | Questions asked of both provider and user* A: Provider's self-perception, B: Provider's guess about the user's perceptions, C: User's Perceptions |
Answer Type |
|---|---|---|---|---|---|
| Howell et al. 1976 | 97 | Academic Library Face-to-face |
Mean, percent different; chi-squared used to determine significance |
|
Survey 3-point scale; yes/no; open ended |
| Whitlatch 1990 | 255 | Academic Library Face-to-face |
Mean, SD, correlation matrix, percent of "substantially different" user and provider scores |
|
Survey 7-point scale |
| Radford 1999 | 27 | Academic Library Face-to-face |
No summary statistics provided |
|
Interviews open ended questions |
| Current Study Hansen et al. |
26 | Undergrad course assignment help Instant Messaging |
Mean, differences; paired t-test and Wilcoxon signed-rank test used to determine significance |
|
Survey 3-point scale; 5-point scale |
| *Actual language of questions is not used in this summary **Bracketed letters refer to the type of comparison being made (see Figure 3). For example, [A-C] compares provider self-perceptions with user perceptions (A and C in Figure 3). [B-C] compares provider guesses of user perceptions with actual user perceptions (B and C in Figure 3). |
|||||
Generational differences (Shiu and Lenhart 2004) in instant messaging usage make it challenging for providers to know what to expect from users. The lack of physical cues can also make it more challenging to accurately perceive a users' satisfaction, although text-based strategies for rapport building, relationship development and other interpersonal skills are common (Fagan and Desai 2002/2003; Radford 2006). Unfortunately for our purposes, some of the most expansive instant messaging reference surveys such as the one conducted in 2006 by the National and State Libraries Australasia (NSLA) fail to link user and provider surveys of the same encounter (Davis 2007; see also McElhill and Perry 2007). This paper aims to fill in this important gap by introducing the pair perception comparison method and then using it to study how well reference providers assess users' satisfaction levels with instant messaging reference encounters.
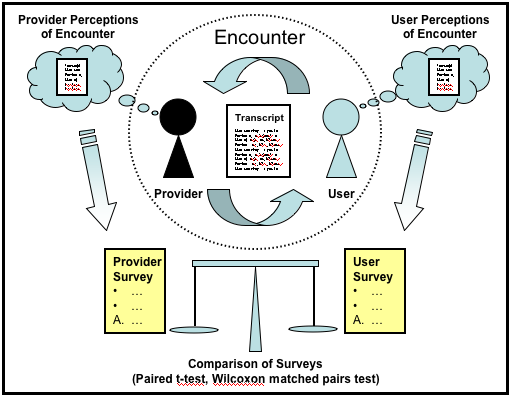
The pair perception comparison method systematically compares the perceptions of reference providers and reference users on an encounter-by-encounter basis. The method is general enough that it can be applied to a variety of reference services to understand discrepancies between a user's and a provider's perceptions of the same interaction. The method treats each reference encounter between a single reference provider and user as a unit of analysis, or pair, as shown in Figure 1. After each encounter, a survey instrument is used to independently capture the perceptions of each member of the pair. When feasible, this can be complemented with a transcript of the interaction to identify characteristics of the encounter including time of day, type of question and length of session. In the current study, we used transcripts to filter out interactions that were not reference encounters (e.g., exchanges between providers coordinating shift changes).
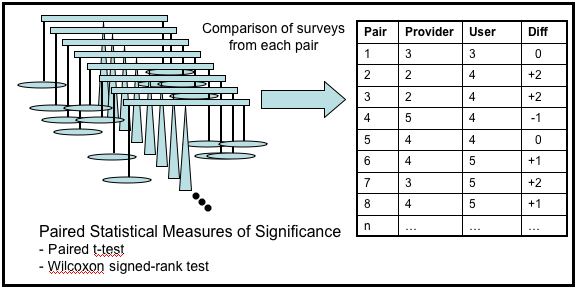
Survey results are collected from multiple pairs (see Figure 2) and compared using correlated sample statistics, such as a paired t-test or a Wilcoxon matched pairs test (Lowry 2008). The Wilcoxon matched pairs test analyses the differences between the paired measurements (see Figure 2). The p-value for the two-tailed version of this test used in the current study answers the following question: If there is no median difference between the provider survey and user survey (the null hypothesis), what is the chance that random sampling would result in a median difference as far from zero (or further) as observed in the results?
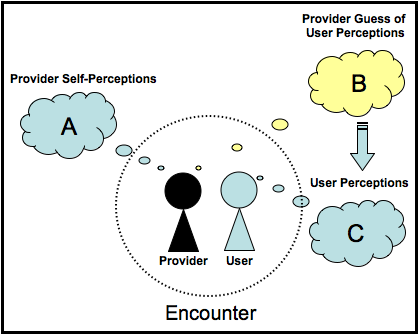
When asking providers about the encounter, the survey must distinguish between two types of provider perceptions (Figure 3). The first type (A) measures the provider's self-perception: 'How satisfied were you with your own performance on the following elements related to the instant messaging session you just completed?' (followed by a list of fourteen variables of interest). The user has a related question (C): 'How would you rate your satisfaction with the following elements related to the instant messaging session you just completed?' The second type of provider perception (B) is the provider's educated guess of the user's perceptions (C): 'How do you think the patron will rate his or her satisfaction with the following elements related to the instant messaging session you just completed?' Previous studies have not collected data on both A and B.
We used the pair perception comparison study design, where the reference providers were fifty-one Master of Library Science (MLS) students and reference users were undergraduate journalism students from a large research university. The following research questions were addressed:
A temporary Research Help instant messaging reference service was made available to 200 undergraduate journalism students working on a course assignment with a one-week deadline. Three members of the research team attended a journalism lecture session where they demonstrated how to use the instant messaging reference service, distributed flyers and asked students to complete University of Maryland Institutional Review Board-approved consent forms. The journalism instructor encouraged students to use the service and sent two e-mail reminders during the assignment period.
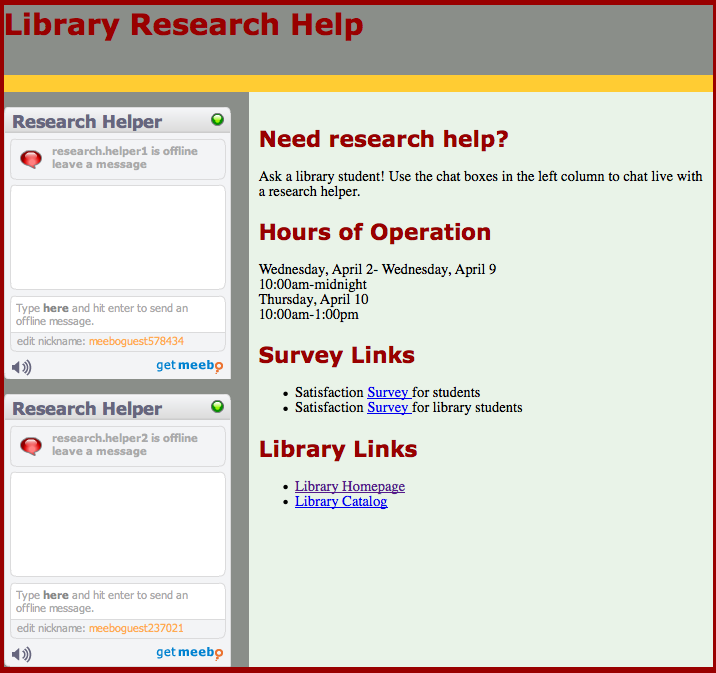
Students used the Research Help Web page shown in Figure 4 to access the instant messaging reference service. The page included two Meebo instant messaging widgets that allowed journalism students to contact one of two MLS students who were logged into the Meebo service. Students could remain anonymous by keeping the automatically generated guest ID (e.g., meeboguest83021) or provide their own nickname. The Website also provided information about the service, hours of operation (10am midnight) and links to the surveys that students were asked to fill out after their reference interaction. The service ran for one week during the Spring 2008 semester, ending on the due date of the journalism assignment.
Master's in Library Science (MLS) students enrolled in a reference services class served as reference providers for class credit. Participation in the related research activities was voluntary, although all fifty-one MLS students chose to participate. The MLS students had completed basic reference training, were familiar with Reference and User Services Association guidelines and had demonstrated their ability to use a variety of sources and techniques through in-class search assignments. Two research team members attended MLS class sections and described the research project, distributed Institutional Review Board-approved consent forms, demonstrated the Meebo instant messaging interface, discussed scheduling details for the service and offered tips on providing virtual reference.
A password-protected wiki was used to support the MLS students. It included instructions on using the instant messaging software, links to helpful resources, prepared phrases they could use during the reference session and a list of common instant messaging abbreviations. The MLS students used the wiki to sign up for two-hour shifts throughout the week. Each shift required two reference providers (Research.helper1 and Research.helper2) and an alternate in case one had technical problems.
Two surveys were developed, one for users and one for providers. Questions were refined based on a pilot test of over a dozen colleagues with varying levels of virtual reference experience. The surveys were administered online using SurveyMonkey (http://www.surveymonkey.com). Reference providers and users were asked to complete the surveys immediately after the conclusion of the reference interview. The median time to complete the user survey was four minutes and the provider survey median was eight minutes.
Survey questions fell into the following four categories:
We used statistical techniques designed specifically for paired data including the paired t-test and the Wilcoxon signed-rank test (Lowry 2008). Two statistical assumptions should be met to use these statistics. First, each pair should be independent, i.e., the same user or provider should not show up in multiple encounters. This was met in the current study as described in the Findings section. Secondly, these tests assume that each paired difference comes from a certain distribution: identically, normal distribution for a paired t-test and only continuous and symmetric distribution with the same median for the Wilcoxon test. The current study (and previoius studies) used a Likert scale to capture ordinal data about satisfaction levels rather than continuous data. While this is not ideal, it is common to treat Likert scale data with five or more options as continuous data in similar studies (e.g., Saxton and Richardson 2002; Whitlatch 1990). Non-parametric tests such as the Wilcoxon signed rank test are often recommended when dealing with Likert scale data (Gibbons 1992).
There were sixty-four unique instant messaging reference sessions initiated by the undergraduate students, fifty-five of which qualified as reference sessions based on a review of transcripts. Thirty-one of the undergraduate students completed the survey after their reference session, a response rate of 56%. The MLS students submitted surveys for fifty-four of the fifty-five reference sessions.
Twenty-six of the completed user and provider surveys represented matched pairs. In one case, two different MLS students helped the same user because of a shift change. We average the provider survey data for our analysis, except for demographics, which are reported separately. Survey results suggest that at least twenty-five of the twenty-six reference providers and all of the twenty-six reference users were unique individuals, making our independence assumption reasonable.
Since the twenty-six matches represented only 40% of the known encounters, it is possible they are a biased sample. To assess the level of bias, we compared the twenty-six provider surveys (matched providers) with the thirty-three provider surveys from those who did not have a match (unmatched providers). Results are reported for both groups when appropriate.
Figures 5-7 compare users' and providers' age, frequency of instant messaging use and comfort level with instant messaging. Data for reference providers who helped multiple users are included multiple times.
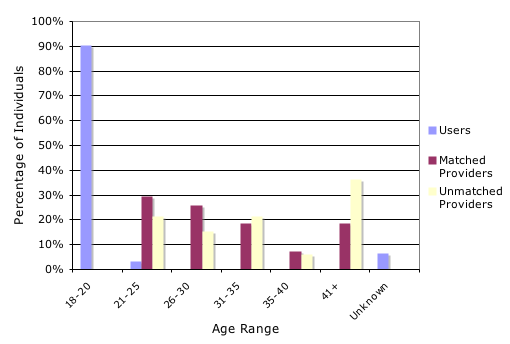
Undergraduate users were younger than graduate student providers (Figure 5). Matched and unmatched providers were similar.
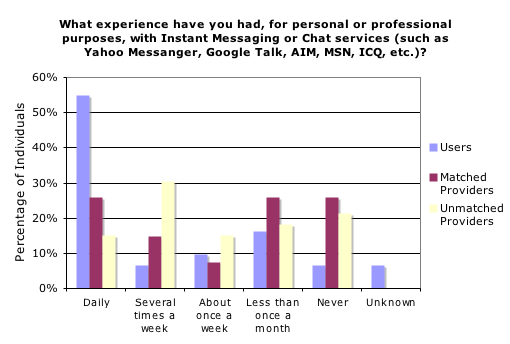
Users had a higher rate of instant messaging use (Figure 6), consistent with general trends for college age youth when compared to older adults(Shiu and Lenhart 2004).
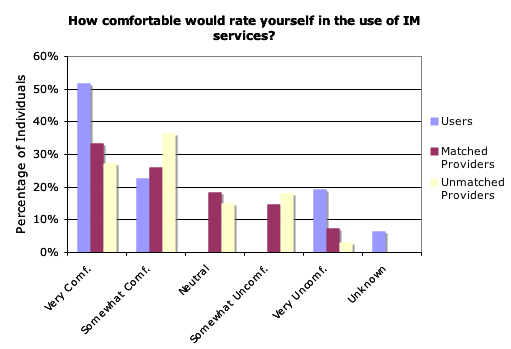
Even though providers did not use instant messaging as often as the undergraduate students, the majority of them reported comfort with the use of instant messaging (Figure 7). Most users were 'very comfortable' using instant messaging services, although 19% were 'very uncomfortable'.
Ninety percent of the undergraduate students multitasked during the session. Many users were familiar with traditional library reference services, with 58% reporting using in-person library services; however, they were much less likely to have used a virtual reference service. Only 13% reported using instant messaging or chat services and 13% reported using e-mail reference services. Only 10% had used telephone reference. Providers had varying rates of experience with instant messaging and reference services and 55% rated themselves as inexperienced. Fifty-five percent had been a provider or user of an instant messaging library service.
The users asked 58% of their questions during the three days before the assignment due date. About half of the questions were received between 10 a.m. and 6 p.m. and half were asked between 6 p.m. and midnight. The busiest shifts were 7 p.m. to 9 p.m. 10 a.m. to noon and 10 p.m. to midnight.
To gauge their willingness to return, users were asked: 'Given the nature of the interaction you just completed, if you had the option, would you return to this digital reference site again with another question?' Of the 31 reference users who completed the survey 25 (81%) answered 'Yes', 4 (13%) answered 'Not sure' and 2 (6%) answered 'No'.
Figure 8 shows overall satisfaction levels for the twenty-six matched pairs. Reference users and providers were each asked: 'Overall, how satisfied were you with the instant messaging reference interaction you just completed?' ('Users' and 'Provider self'). In addition, reference providers were asked: Overall, how satisfied do you think the patron was with the instant messaging reference interaction you just completed?" ('Provider guess').
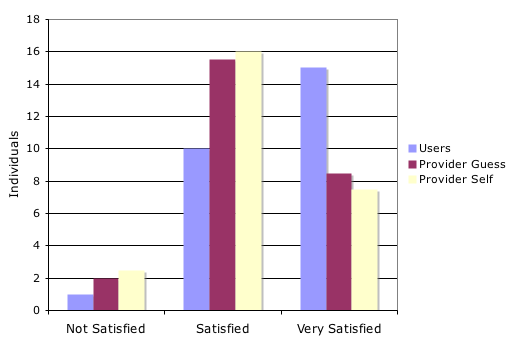
Reference providers underestimated the users' satisfaction levels, as evidenced by comparing the Provider Guess satisfaction levels with the Users' levels. A two-tailed, paired t-test comparing the Users' overall satisfaction levels with the Provider Guess levels found a significant difference at the .05 level (p-value = 0.038). The two-tailed, Wilcoxon signed-rank test had a p-value of 0.068. These tests suggest that when comparing on a transaction-by-transaction basis, providers do not typically think that users will be as satisfied with the encounter as users actually are. The difference between the Provider Self and Provider Guess satisfaction levels was not significant at a 0.1 level (two-tailed paired t-test p-value = 0.832; two-tailed Wilcoxon signed-rank test p-value = 0.844).
To help measure bias, we compared the average overall satisfaction levels of the twenty-six matched providers with the thirty-three unmatched providers. A two-tailed Wilcoxon two sample test showed no significant difference between the matched and unmatched providers at the 5% or 10% level. We also compared satisfaction levels on the fourteen variables of interest for the matched and unmatched providers' guesses of the user satisfaction levels using a two-tailed Wilcoxon two sample test. None of the differences was significant at the 5% level, but four of them were at the 10% level. In nearly all of the cases (thirteen of the fourteen factors), the average of the matched providers was higher than the average of the unmatched providers. These findings suggest that our matched pair sample (n=26) is slightly more likely to have had positive experiences than the average experiences of all those who participated in the service.
This section is based on the twenty-six matched pair encounters. Table 2 compares the results of providers' self-satisfaction levels on fourteen specified dimensions (column A), providers' guesses of user satisfaction levels (column C) and users satisfaction levels (column E). See the Appendix for exact questions that match with the satisfaction factor listed in Table 2. Mean satisfaction levels based on a five-point Likert scale are reported. However, statistical tests are based on two-tailed, paired T-tests and Wilcoxon signed-rank tests. The Difference columns (B and D) show a plus or minus sign for those factors that have a significant difference between the columns to either side (both the paired t-test and Wilcoxon signed-rank test below a 0.1 p-value).
| (A) Provider self (mean) |
(B) Difference |
(C) Provider guess (mean) |
(D) Difference |
(E) User (mean) |
|
|---|---|---|---|---|---|
| Initial time | 4.50 | 4.33 | 4.50 | ||
| Tempo | 4.27 | 4.29 | + | 4.65 | |
| Total duration | 3.98 | 4.17 | 4.38 | ||
| Ease of use | 4.31 | 4.15 | + | 4.81 | |
| Comfort | 4.46 | 4.31 | 4.54 | ||
| Friendliness | 4.37 | 4.40 | + | 4.73 | |
| Interest | 3.96 | + | 4.31 | 4.38 | |
| Understanding | 3.71 | 3.94 | + | 4.62 | |
| Resource quality | 3.98 | 3.92 | 4.27 | ||
| Resource type | 3.67 | + | 4.06 | 4.28 | |
| Resource number | 3.96 | 3.77 | 4.23 | ||
| Accuracy | 4.62 | - | 3.92 | + | 4.54 |
| Follow up | 4.29 | 4.29 | + | 4.69 | |
| Spelling | 4.33 | 4.15 | + | 4.69 |
The difference between column A and C can be interpreted as the reference provider's 'hunch' about the user. For example, the plus sign in Column B on the Interest row suggests that reference providers thought users would rate them higher on their level of interest than they would rate themselves. The difference between column C and E of Table 2 can be thought of as a measure of how accurate those thoughts were. For example, we see that the reference provider's thoughts about 'interest' were accurate (they guessed on average 4.31 with users actually reporting 4.38 and the statistics report an insignificant difference between the pairs).
Providers consistently underestimated the satisfaction levels of users (see columns C, D and E). Even for non-significant factors, providers were overly pessimistic on average.
Comparing columns A, B and C suggests that for most factors, reference providers did not expect users to have a different opinion of the experience from that of the providers. In two cases providers correctly guessed that users would be more satisfied than providers were: 'interest in his/her research needs' and 'Types (Web, print, etc.) of resources provided'. In contrast, reference providers' estimates of users' satisfaction with the accuracy of the information provided was incorrect. Providers guessed users' satisfaction would be lower than their own, when in fact it was nearly the same.
When making numerous statistical comparisons, the likelihood that one of them is spurious increases. For example, we conducted fourteen tests, each one of which had a likelihood of 5% of a Type I error, suggesting a 5% chance that a particular test found a significant relationship when such a relationship did not exist. It is impossible to know which, if any, of the significant results may be spurious, thus we must not place too much emphasis on any one factor without supporting evidence from other sources. In our case, we can have high confidence in the overall observation that providers underestimate users' satisfaction levels since this was a consistent finding overall as well as on a number of factors. Furthermore, provider and user comments (discussed below) help provide a strong rationale for several of the statistically significant differences.
It can be difficult for a reference provider to know if patrons are satisfied, particularly in a virtual environment with no visual and auditory cues. Several reference providers in this study mentioned this challenge. One provider noted:
I guess that's part of the nature of this IM beast... you really can't tell what the person on the other side is thinking/feeling about the encounter.
However, providers must estimate how well they are performing if they want to improve their own performance. Our study applied the pair perception comparison method to systematically assess the accuracy and biases of those hunches.
In our study, new providers were overly pessimistic about users' overall satisfaction levels, as well as several specific aspects of the encounter. This phenomenon of provider pessimism is consistent with studies of expert providers in face-to-face settings. Thus, the overall phenomenon is not simply explained by a lack of confidence from new providers.
Provider pessimism occurred in seven of the fourteen performance factors studied (see Appendix). Some factors were specific to instant messaging reference: the tempo of the interaction, the spelling and grammar used and the ease of use of the system. Other factors, such as the ability to follow up, understand what is requested and portray a sense of friendliness, are also likely to be affected by the virtual nature of the encounter.
Providers underestimated users' satisfaction with the pace of the interaction. They mentioned feeling 'rushed', 'overly concerned about being quick in my responsetoo quick' and 'flustered at the pace that the questions were rolling in'. In contrast, users never complained about pacing and several were complementary mentioning the interaction was 'fast', 'quick' and had a 'response time that was good'. Classroom discussions revealed that many of the providers did not expect such a high percentage of users (90%) to multitask during the encounter, a practice that frequent instant messaging users might understand better than those new to the medium. The key lesson for new practitioners is that providers need not be so anxious about replying immediately to users' comments, particularly at the expense of a quality response.
Similarly, we found that users were more satisfied than providers thought they would be with spelling and grammar. This may be because our undergraduate users did not register typographical, spelling and grammatical errors. More likely, it is because users accustomed to instant messaging do not assign meaning to these errors. In either case, providers should not overly worry about this factor during the reference encounter.
One of the largest differences in users' satisfaction levels and providers' guesses was the ability of providers to understand the question being posed. Providers were relatively dissatisfied with their own understanding of the users' question (3.71 mean). On average they believed users would be more satisfied (3.94), but their hunch was not nearly enough to reach the high level of user satisfaction on this factor (4.62). Such a discrepancy might be a result of the medium itself, where providers cannot observe users nodding their head in agreement. It might also result from different expectations established during the course the MLS students were enrolled in. The MLS students were taught to look for the underlying information need, not simply address the first question that is posed. In contrast, users may only expect the service to address the initial question.
Finally, we found that providers thought that users would be less satisfied with the accuracy of the resources than the providers were themselves. This thought was incorrect. Users were just as satisfied as providers were (see Table 2). This finding seemed counterintuitive to the authors. It was expected that reference providers would assume that the users would be less skilled than themselves at recognizing an information site as accurate. However, providers actually assumed that users would be more particular than the providers were with accuracy. This might be because the users were the ones who had to hand in the assignment for a grade, not the providers.
While the findings of this study are informative, particularly those that relate to the instant messaging experience, it is important to see this study as one instantiation of a more general type of reference study. The pair perception comparison method can be applied to address questions other than those related to satisfaction levels. For example, providers and users could be asked about their perceptions of some event that occurs during an encounter (e.g., getting disconnected from a chat service) or their expectations of a service (e.g., how much time do you expect this answer to take). When user and provider perceptions are compared using the pair perception comparison method, we can identify discrepancies and mistaken assumptions of providers and users. This will in turn help us develop more effective training and evaluation criteria for instant messaging reference providers and more appropriate educational campaigns for users. These studies can also help bolster the confidence of providers who suffer from provider pessimism.
The limitations of this study result from its context and scope. Undergraduate students were informed that MLS students would offer the service, potentially encouraging the undergraduates to be more lenient or to lower their expectations. To mitigate this, it was explained to the journalism students that their feedback was only helpful if they were completely honest in their assessments. The artificial nature of the instant messaging service used in this study might also be a limitation. To mitigate this, a professional-looking website was constructed, which students could voluntarily access at almost any time and from anywhere. While the instant messaging reference service was a construct only for this study, the assignment itself was real, created without input from the research team. The arrangement was useful in providing direct access to many users who could personally be invited to participate in the study. Using MLS students as reference providers rather than experienced library practitioners was another limitation. However, in this case it was useful as a means to complement previous studies that only looked at professional librarians in academic library settings (see literature review). Further studies that apply the pair perception comparison method in different contexts with different users and patrons will help shed light on the prevalence of provider pessimism and how it differs in various contexts.
Reference providers and users often have different perceptions of the same encounter. When misaligned, providers may spend too much time on factors that do not matter to users, or too little time on factors that do matter. Only a few studies have directly compared user and provider assessments of the same encounter. In our review of these studies, we identified a consistent pattern that we call provider pessimism, the tendency for providers to underestimate the satisfaction levels of users. We introduced the pair perception comparison method, designed to overcome some of the limitations of previous studies. We then used it to identify the discrepancies between the satisfaction levels of new reference providers (MLS students) and users (undergraduate journalism students). For the first time we found evidence for provider pessimism in a virtual setting. More importantly, we found that reference providers underestimated the satisfaction levels of users on a number of specific factors of interest including the tempo of the instant messaging interaction, the ease of use of the system, the friendliness of the provider, the accuracy of the references, the follow up of the provider and the spelling and grammar used by the provider.
We hope that novice providers of virtual reference services will take these findings to heart; that they will be more optimistic about their own abilities and not overestimate users' desire for quick or error-free responses. Leaving behind these stressors, virtual reference providers can concentrate on providing appropriate, high-quality information that result in even higher user satisfaction ratings.
We thank the reviewers of this submission, as well as reviewers of an earlier version of this paper, which received the ALISE/Dialog Methodology Paper Competition award in 2009. Most of all, we thank the undergraduate and graduate student participants in the study.
Derek Hansen is Assistant Professor and Director of the Center for the Advanced Study of Communities and Information at the College of Information Studies, the University of Maryland's iSchool. He can be contacted at shakmatt@gmail.com
Margeaux C. Johnson is Assistant Librarian, Marston Science Library at the University of Florida. She can be contacted at margeaux@ufl.edu
Elizabeth F. Norton is a contractor in the Division of Specialized Information Services at the National Library of Medicine at the National Institutes of Health. She can be contacted at nortonef@gmail.com
Anne Constance McDonough is the Photography Assistant/Image Archivist at University Publications at the University of Maryland. She can be contacted at anne.mcdonough@gmail.com
| Find other papers on this subject | ||
| RUSA Guideline | How would you rate your satisfaction with the following elements related to the instant messaging session you just completed? | |
|---|---|---|
| Approachability | 1.0 The librarian's role in the communications process is to make the patrons feel comfortable in a situation that may be perceived as intimidating, risky, confusing and overwhelming. | How comfortable you felt asking the librarian your question. |
| Approachability | 1.8 [The librarian] Should provide prominent, jargon-free links to all forms of reference services from the home page of the library's Web site and throughout the site wherever research assistance may be sought out. The Web should be used to make reference services easy to find and convenient. | How easy it was to use the Website & instant messaging system |
| Interest | 2.2 Focuses attention on the patrons. | Librarian's interest in your research needs |
| Interest | 2.7 Acknowledges user e-mail [instant messaging] questions in a timely manner. | Time it took to receive an initial response |
| Interest | 2.6 Maintains or re-establishes "word contact" with the patron in text-based environments by sending written or prepared prompts, etc., to convey interest in the patron's question. | Time in between each response from the librarian |
| Interest: listening & inquiring | 2.5 Signals an understanding of patrons' needs through verbal or non-verbal confirmation, such as nodding of the head or brief comments or questions. 3.4 Identifies the goals or objectives of the user's research, when appropriate. |
Librarian's understanding of your questions |
| Listening & inquiring | 3.2 Uses a tone of voice and/or written language appropriate to the nature of the transaction. | The spelling and grammar used by the librarian |
| Listening & inquiring | 3.1 Communicates in a receptive, cordial and encouraging manner. | Librarian's friendliness |
| Searching | 4.4 Attempts to conduct the search within the patrons' allotted time frame. | Length of the entire instant messaging session |
| Searching | 4.2 Constructs a competent and complete search strategy. This involves: Selecting search terms that are most related to the information desired, Verifying spelling and other possible factual errors in the original query, Identifying sources appropriate to the patron's need that have the highest probability of containing information relevant to the patron's query. | Quality of the resources the librarian helped you find |
| Searching | 4.2 Identifying sources appropriate to the patron's need that have the highest probability of containing information relevant to the patron's query. 4.8 Recognizes when to refer patrons to a more appropriate guide, database, library, librarian, or other resource. |
Types (Web, print, etc.) of resources provided |
| Searching | 4.2 Identifying sources appropriate to the patron's need that have the highest probability of containing information relevant to the patron's query. 4.8 Recognizes when to refer patrons to a more appropriate guide, database, library, librarian, or other resource. |
The number of resources provided |
| Searching | 4.3 Explains the search strategy and sequence to the patrons, as well as the sources to be used. | Accuracy of the information |
| Searching: follow up |
4.7 Asks the patrons if additional information is needed after an initial result is found. 5.1 Asks patrons if their questions have been completely answered. 5.2 Encourages the patrons to return if they have further questions by making a statement such as "If you don't find what you are looking for, please come back and we'll try something else." |
The librarian's interest in making sure you had the help you needed before ending the session |
© the authors 2009. Last updated: 29 November, 2009 |
|
