vol. 16 no. 4, December, 2011
vol. 16 no. 4, December, 2011 | ||||
Newspapers that have a Website with substantial content need to make several crucial strategic choices. On the highest level, they need to decide whether to monetise their online content directly (by charging for it) or indirectly (by trying to attract advertising revenues). Newspapers that decide to charge also need to decide for which type and what proportion of content they will charge, in what packages this content will be made available (subscriptions, pay-per-view or both) and, crucially, how much to charge for each access option. When pondering these choices, newspapers also need to take into account that an online offering that overlaps with the print offering and/or is attractively priced might very well cannibalise the traditional newspaper. Well-balanced pricing can obviously help in stemming such channel spill-over, as will differentiating the content across the two channels, but bundling also becomes significant. Indeed, many newspapers offer a package that contains the print as well as the online version at a special price.
In a series of related papers, we examine several of the above decisions. We do this by means of a unique, self-constructed database with data on eighty-two national daily newspapers from eight Western European countries. In Bleyen and Van Hove (2010b), we analyse how these newspapers tackle the high-level, free or fee dilemma. In Bleyen and Van Hove (20010a), we analyse why some newspaper Websites rely on subscriptions while others (also) offer pay-per-view. In this paper, we try to gauge and explain newspapers' fear of cannibalisation. Specifically, we analyse to what extent newspapers bundle their online and print subscriptions and how they price the bundle. The underlying thinking is that newspapers that offer a bundle and, particularly those that offer a bundle at a substantial discount, have a higher fear of channel spill-over.
On the newspaper level, we find that financial newspapers are more likely to opt for mixed bundling and that the price of the online subscription has a positive impact on the percentage discount offered for the bundle. Conversely, a higher importance of advertising revenues in a given country lowers the discount. Intriguingly, this is just about our only result on the country level. At least part of the explanation for the inter country differences seems to lie more on the market level. We find clear indications of mimicking behaviour for both the decision to opt for mixed bundling as well as for the level of the discount granted for a bundle containing the print and Web subscriptions, but not for the bundle containing the print and site subscriptions.
Besides its use of original data, the paper's main contributions are twofold. Firstly, it proposes novel (albeit imperfect) measures of newspapers' fear of channel spill-over and, secondly, it not only confirms the existence of inter-organizational imitation amongst online newspapers first revealed in Bleyen and Van Hove (2010a, 2010b), but actually strengthens the case, as the mimicking results presented in this paper are less open to criticism.
The remainder of the paper is structured as follows. The next Section summarises what the literature has to say about the issue of channel spill-over in the specific case of newspapers. It also provides selected anecdotal evidence on how established players have tackled it. The second Section develops our hypotheses. Section three describes how the data was collected and discusses the set-up of the analysis. This is followed by a presentation of the regression results. The final Section summarises our results, discusses the limitations of our analysis and offers suggestions for further research.
As pointed out in the Introduction, when a newspaper builds a Website with substantial content, it has to realise that there is always the danger of cannibalisation of the offline by the online channel (Choi et al. 1997). Newspapers, therefore, should analyse the costs associated with each channel, as well as the nature of the demand. Where the latter is concerned, the key question is whether readers perceive the online version as a complement to or a substitute for the print version. In the first case, the online version will add to company profits by encouraging sales of the offline product. In the substitute case, revenue erosion is a danger and costs should be recovered through online fees and/or advertising. A problem in this respect is that per-reader revenue remains far smaller on the Web than for print (Knowledge@Wharton 2009).
Below we first summarise the academic evidence on whether online news and news on paper are complements, independent goods or substitutes. We limit ourselves to newspapers here; the working paper version of the present article also discusses evidence for magazines. The second subsection discusses what newspapers might do to stem the possible channel spill-over.
Overall, it is 'widely assumed that the Internet is cannibalistic' (Porter 2001: 73). For the case of newspapers too, several authors argue that offering digital content will cannibalise print sales. However, the empirical evidence is mixed. Part of the explanation is that the studies use different methods and cover different time periods and/or countries. Also, in some cases, the online content is charged for, whereas in other cases it is gratis.
Several of the studies that point towards a complementary relationship rely on surveys. Chyi and Lasorsa (2002) find that online readers of six newspapers in Austin, Texas, were more, not less, inclined to read the same paper's print version. Chyi (2004) later conducted a similar survey for the top seven newspapers in Hong Kong. She finds, again, that there is significant overlap between online and print readership and that the relative number of users of print media among Web users are not reduced.
Turning to the Netherlands, de Waal et al. (2005) find that of those consulting an online newspaper, 88% also read a printed newspaper and 42% of those reading printed newspapers also consulted a newspaper site. In the case of Australia, Nguyen and Western (2006) find that users of Internet news use traditional media (such as TV, radio and newspapers) more frequently than non-users. For newspapers, the mean use figures are 3.99 times a week for users of online news versus 3.47 for non-users. Note, however, that unlike Chyi and Lasorsa (2002) and Chyi (2004), the analysis by de Waal et al. (2005) and Nguyen and Western (2006) is not on the level of individual newspapers.
The final survey in our overview relates to Spain. Flavian and Gurrea (2007) find that people are more inclined to consult a digital newspaper to search for up-to-date, breaking news. Conversely, reading as entertainment or out of habit has a negative impact on the use of the digital medium. This again suggests that the print and online channels are complementary, provided that the two products are sufficiently differentiated.
Pauwels and Dans (2001) use a different approach and apply cross sectional and time series analyses to twelve Spanish newspapers in the period 1998-1999. They find that circulation increases Website visits. However, they do not study the opposite impact (from Website visits on print circulation) and thus cannot provide conclusive evidence as to the degree of cannibalisation. Deleersnyder et al. (2002), for their part, use data for 1990-2001 to analyse how the addition of a (mostly free) Internet channel, at different points during that period, affects the longer-run performance of eighty-five British and Dutch newspapers. They conclude that, at least at that point in time, the threat of cannibalisation is largely exaggerated: few newspapers in their sample experienced a significant drop in either print circulation or advertising revenues. For example, only nine newspapers experienced a significant reduction in their circulation income, compared to fifty-eight that did not. On analysing the product similarity of the print and online versions for these two groups, Deleersnyder et al. conclude, predictably, that cannibalisation will more likely take place when the Internet channel closely resembles the entrenched channel (and is thus, too much of a substitute).
Switching to the evidence that points towards a substitute relationship, Filistrucchi (2005) uses monthly data on four leading Italian newspapers between 1976 and 2001 and finds that, in the short run, establishing a Website reduces a newspaper's print sales by approximately 3%. The long run impact is more drastic, at 26%.
Gentzkow (2007), for his part, uses consumer survey and media consumption data for the Washington DC market for the period 2000-2003 and finds that the online version of the Washington Post reduced the Post's print readership by 27,000 daily readers or 1.5%. The estimated $33.2 million in revenue generated by the Washingtonpost.com in 2002, came at a cost of $5.5 million in lost print profits. Taking into account the cost of operating the online division (estimated at $45 million a year), the result is a net loss (of roughly $17 million). However, between 2002 and 2004 online revenues almost doubled, resulting in a net gain of $11.5 million in 2004. Hence, Gentzkow (2007: 740) concludes that 'the initial losses of the online paper may have been an investment in anticipation of future market growth'.
To sum up, the evidence regarding the danger of cannibalisation of newspapers' print by their online channel is mixed. A problem is also that several studies take a one-sided view. As mentioned, Pauwels and Dans (2001) disregard the impact of Website visits on print. Conversely, with the exception of Gentzkow (2007), papers that study the impact on offline revenues do not take into account possible online revenue streams.
As documented above, the academic literature is not very conclusive as to the presence and magnitude of the cannibalisation threat. However, it does show that the free or fee nature of the Internet channel matters, as does content overlap. This generates two straightforward recommendations for newspapers wishing to avoid possible cannibalisation. The first is having a different version of the content across the two channels so that they become more separate offerings; the second is to give significant thought to pricing.
However, bundling or 'the practice of selling two or more distinct goods together for a single price' (Adams and Yellen 1976: 475), also enters into play. For instance, newspapers can offer a subscription that includes both the print and the online edition. When these are not made available for sale separately, this amounts to pure bundling or tying, which obviously precludes cannibalisation altogether. In the other case, the approach is referred to as mixed bundling. The bundle can then be sold at a discount, which can be set according to the perceived threat of channel spill-over.
For a sample of ten German newspaper and magazine publishers, Stahl et al. (2004) analyse which bundling (and splitting) strategy maximises demand for paid online content and thus revenues. They find that publishers offering the same information bundle online and offline generate only 46% of the revenues generated by suppliers who only offer their unbundled single articles, and merely 8% of the revenues obtained by competitors who offer rebundled information goods (e.g., dossiers on a specific topic). In their model, Venkatesh and Chatterjee (2006) find that the relative Web preference (measured as the ratio of consumers' reservation price for the online version to that for its print counterpart) matters too. When the Web preference is moderate to high, it is best to set high online prices and offer a wide product line (i.e., print + online bundle + unbundled online modules), rather than offering independent products. When the Web preference is low, publishers benefit from offering discounted online modules to complement the high priced print version.
Turning to some anecdotal evidence, the case of the Arkansas Democrat Gazette, a regional American newspaper, provides a salient illustration of the link between pricing and channel spill-over. The Democrat Gazette places its online content behind a pay wall and, as a result, had only 3,500 online subscribers in 2009, compared to approximately 170,000 daily print readers. Walter Husmann, the paper's publisher, admits that the online subscription 'does not justify itself as a revenue stream' (The Economist 2009). According to The Economist, the Gazette's pay wall is more of a 'revenue dam, intended to stop the flow of readers (and, thus, advertisers) away from print. Since 2002, when the paper began charging online, its average daily circulation has dropped by less than 1% a year – rather better than most' (The Economist 2009).
The Financial Times's approach to pricing is also interesting. For years, much of the online news was for paying subscribers only. However, in mid-October 2007, FT.com pioneered an innovative charging system whereby occasional visitors could read five articles a month for free, after which they were asked to register. Once they clicked on thirty stories in a thirty day period, they were asked to subscribe. (In the meantime, the numbers have been lowered to one and ten, respectively.) The Financial Times believed that partially opening up its online material would increase traffic to the site and thus also advertising revenues, without endangering online reader revenues. In a change in policy, The New York Times announced that, starting in early 2011, it too will be introducing a metered subscription service similar to FT.com (Pérez-Peña 2010). Subscribers to the print edition will continue to receive unlimited free access to the site (Pérez-Peña 2010).
Continuing with the issue of bundling, it is interesting to observe that several established information providers have repeatedly altered their policies. The Wall Street Journal, for example, has different policies for different editions. Print subscribers to The Wall Street Journal Europe and The Wall Street Journal Asia are given complimentary online access. But subscribers to U.S. edition have to pay an additional fee to have WSJ Online access included with their subscriptions. An interesting experiment is what one could call daily bundling. From January 2007, print copies of The Wall Street Journal Europe contained coupons that gave buyers of single copies a day's free online access. The practice was discontinued in January 2009 (although if briefly resurfaced in May 2010).
To conclude, these and other real-life cases show that even established media outlets are uncertain about the optimal extent of bundling and, what to charge for it.
We now present the theoretical underpinnings of our analysis and develop our hypotheses. In this paper we set out to gauge and explain newspapers' fear of cannibalisation. As explained above, newspapers that are afraid that readers will substitute the online version for the paper version will obviously have a higher propensity to charge for their online content. So, in principle, one could use the (relative) price of the online content as an indicator of channel-spill-over fear. But the decision to charge is clearly also driven by other considerations, such as the trade-off between reader and advertising revenues, to name but one (Bleyen and Van Hove 2010b). This is why we thought more clear-cut indications of channel-spill-over fear might be found in newspapers' meta bundling behaviour; that is, in the way they bundle (or not) their print and online subscriptions. We use the term meta bundling because subscriptions are bundles in their own right. Indeed, as is explained in Table 1 (below), under both pure and mixed bundling, newspapers actually offer a bundle of bundles.
More specifically, a crucial starting point of the paper was that newspapers that offer a meta-bundle and particularly those that offer such a bundle at a substantial discount, have a higher fear of channel spill-over. As explained above, the level of the discount can be set according to the perceived threat of channel spill-over. In what follows, we therefore try to explain two strategic decisions that online newspapers have to make (D1 and D2). The first is a straightforward binary decision, namely the choice between a mixed bundling and a no bundling strategy. The second decision that we study is how newspapers that opt for mixed bundling set the level of the discount. In explaining the first decision we used binary logistic regression analysis and we tried an extensive set of explanatory variables, grouped into three broad categories: newspaper-specific, country specific and market specific. A similar set-up is used for D2, albeit with a continuous dependent variable and ordinary least squares regressions. In other words, our framework is of the following general form:
Di = αi + βi newspaper + γi country + δi market + εi, with i = 1, 2
We now introduce our hypotheses as they related to the category of explanatory variables.
Where newspaper characteristics are concerned, there is not much literature to guide us in our hypothesis development. However, an observation that is both obvious and important is that newspapers that have to decide whether to offer a bundle of subscriptions all have some sort of online subscription. Hence, they clearly value reader revenues (as opposed to advertising revenues) and especially revenues from regular readers. Building on this, if a high price for the print subscription goes in tandem with a higher reliance on reader revenues (which we do not know for certain) then expensive newspapers might be more afraid to lose these revenues. An indication in this direction is that in our sample, the average price of the print subscription per country, which is a variant on AVGP (the average such price per market), is negatively correlated with ADVERT-CONTRIB, the contribution of offline advertising to daily newspapers' revenues; the Pearson r is -0.494*** (N = 72). Hence, our first hypothesis reads:
Hypothesis 1: More expensive newspapers are more likely to bundle print and online subscriptions (D1) and to offer a higher discount for this bundle (D2).
Building on this, it is interesting to observe that financial and quality newspapers are more expensive than other newspapers. In our sample, the average price of an annual print subscription for a financial newspaper is €354, compared to only €241 for other newspapers (N = 48; Levene's t = -3.42, p <0.01). Quality newspapers also command a higher than average price offline. In our sample, the average print subscription for a quality newspaper costs €284, compared to €240 for other newspapers (N = 57; Levene's t = -2.61, p <0.05). Hence our following two hypotheses read:
Hypotheses 2 and 3: Financial and quality newspapers are more likely to bundle print and online subscriptions (D1) and to offer a higher discount for this bundle (D2).
Looking for evidence to underpin these hypotheses, it is tempting, but admittedly speculative, to link Flavian and Gurrea's (2007) finding that (Spanish) consumers are more inclined to consult a newspaper site for breaking news with the observation often advanced by media commentators who suggest that financial newspapers have information that is more time- and business critical. A recent survey carried out by PricewaterhouseCoopers (2009) in cooperation with the World Association of Newspapers reinforces this concept. The survey estimated readers' willingness to pay for content on various platforms. It involved more than 4,900 consumers in seven countries, of which we cover four. It was shown that if the willingness to pay for high-quality content on paper is set at 100%, respondents were only willing to pay a maximum of 62% for the same type of news online. But, interestingly, respondents preferring financial content expressed a relatively high willingness to pay: for a high-quality online newspaper with a focus on finance they were prepared to pay, on average, as much as 97% of what they would pay for high quality general news on paper. However, the survey did not examine the issue of whether the higher willingness to pay for the online content of financial newspapers implied a reduced interest in their print content; in other words, whether it implied (stronger) channel spill-over.
Over the past decade or so newspapers moved to the fee model when online advertising expenditure was down and moved back to the free model when the market revived. The rationale is obvious: higher (anticipated) advertising revenues lower the need to monetise content directly. A lower reliance on reader revenues should also reduce newspapers' fear of channel spill-over, provided that they think they can reap similar advertising revenues online and offline.
Unfortunately, newspaper-level data documenting online advertising revenues are not publicly available. However, we do have country-level data about the relative importance of advertising (see the Section on data collection for details). Hence, our (second-best) hypothesis is of the following form:
Hypothesis 4: The higher the relative importance of (offline) advertising for newspapers in a given country, the less likely newspapers with online subscriptions are to opt for mixed bundling of print and online subscriptions (D1) and the less likely they are to apply a high discount (D2).
Still on the country level, we also wanted to take into account the possible impact of Internet penetration and/or usage. However, we had no clear assumption about the sign of the impact. Potentially, higher Internet usage in a given country may lead to a cannibalisation threat, or at least the perception of one. Conversely, in periods when the online advertising market is healthy, more online visitors should bring higher advertising revenues, so newspapers might be less concerned about channel spill-over. Hypothesis 5 is thus deliberately phrased vaguely:
Hypothesis 5: Internet penetration and/or usage have an impact on a newspaper's online strategy (D1-2).
Turning to market-specific variables, there is substantial anecdotal evidence that newspapers monitor each other's strategic decisions. For example, in an article about the The New York Times's recent announcement that it will introduce a metered model in 2011, NYT journalist Richard Pérez-Peña points out that any such 'changes are sure to be closely watched by publishers and other purveyors of online content' (Pérez-Peña 2010). Commenting on the same announcement, Gordon Crovitz, a co-founder of Journalism Online (a separate, multi-publisher content platform), said the NYT move 'would embolden other publishers to follow it' (Pérez Peña 2010).
We looked, therefore. into the literature on inter-organizational imitation. In a recent survey article, Ordanini et al. (2008) distinguish six different theoretical streams, each focussing on a different driver of imitation. In macro-micro order of appearance, firms copy: to gain legitimacy for their behaviour (neo-institutional theory); because they believe that other firms have superior information (information cascades models); to limit rivalry (Industrial organization); to let others bear the costs and risks of experimentation (organizational learning theory); to acquire missing capabilities and/or enhance existing resources (the resource-based view of strategic management); or to avoid search, evaluation and selection costs when pondering different strategies (decision-making theory).
Initially, we were inclined to frame the copycat behaviour of online newspapers primarily in the strategic interaction perspective of the Industrial organization literature. Indeed, a newspaper that, in a market where all other sites are free, is the first to introduce, say, an online subscription might suffer reduced profits. If competing sites also have subscriptions, this danger is smaller. Statements by publishers that can be framed into this strategic interaction view abound. For example, News Corporation's Rupert Murdoch announced on August 5, 2009, that he planned to charge for all his online newspapers by the summer of 2010. Commenting on this move, one U.K. newspaper executive said: 'Murdoch is either going to make the market or steer a lot of users our way. There is very little benefit for anyone being the first mover' (Financial Times 2009). However, as is explained in Bleyen and Van Hove (2010b), the alternative perspectives mentioned above are also potentially relevant, with the exception of the resourced-based view of strategic management (which mainly analyses imitation from the point of view of the target firm). But regardless of the theoretical framework that is deemed most relevant, the general form of the hypothesis is very similar:
Hypothesis 6: When making strategic decisions, online newspapers are more likely to do what their competitors do (D1-2).
In this Section we explain how we have collected our data and how we have operationalised the above hypotheses. During the period June-July 2006, we visited the Websites of all national newspapers with a daily circulation in eight Western European countries and listed all relevant characteristics. More specifically, our exploration included six sites in Luxembourg, eight sites in both the Netherlands and Spain, nine in Belgium, ten each in Germany and the United Kingdom, eleven in France and a total of twenty in Italy. In selecting these newspapers, we mainly relied on the list of national daily paid-for newspapers in the report of the World Association of Newspapers (2006). For more specific data we contacted the national co ordinating organizations, with the exception of Spain, for which we relied on the portal site www.spain-newspaper.com. The list of examined newspapers is available from the authors.
Regional and local newspapers were not included because of their specific orientation and generally smaller market share. National newspapers aimed at an extremely specific audience also fall outside the scope of our research. In France, for example, Bilto, La Gazette des Courses and Matin Courses are intended for fans of horse betting and Quoti is a newspaper for children. Freely distributed newspapers such as the Metro are also excluded. Such freesheets typically only generate revenue through advertising and thus do not have to make the strategic decisions analysed in this paper. As for the choice of countries, we were limited by our linguistic capacities.
We now clarify the definitions of the variables used in our analysis. Descriptive statistics for all variables, together with data sources, are available in Tables 1a and 1b in the Appendix.
As explained, the first decision that we analyse in this paper, D1, relates to our newspapers' meta-bundling behaviour; that is, the way in which they bundle their online subscriptions. In principle, we discern three possibilities, as set out below. In practice only one newspaper in our sample opted for pure bundling. We excluded this newspaper, thus turning D1 into a binary decision for which we use binomial logit analysis.
Tying or pure bundling
There is a pay wall but there is no separate online subscription. Either it can only be purchased as part of a package that also contains the print subscription or only print subscribers have access to the online facilities (at no additional cost). Importantly, since we focus on the access to online content, we disregard whether the print version is available separately or not.
Mixed bundling
The print and online versions are offered for sale individually, but can also be bought as a bundle. When print subscribers get free access to the online news, we also consider this to be mixed bundling (albeit with a very large discount) on condition that the online version is also available as a stand-alone product. Otherwise the newspaper will show up in the first category.
No bundling
The online subscription is only available as a stand-alone product. Print subscribers pay the full price. To be clear: newspapers that do not offer any online subscription formula are excluded from our analysis.
Note that the term online subscriptions is used in a broad sense here; that is, as encompassing both site subscriptions as well as so-called PDF subscriptions.
Note that the precise content of an online subscription can vary widely from one site to another. This is why we decided to split online subscriptions into site and PDF subscriptions. A site subscription gives the reader access to the site for a certain period of time. It may or may not include access to a searchable archive, a PDF version of current and/or past editions of the paper, columns, etc. However, it is also possible that the site subscription does not include the PDF version and that readers who want it have to take a separate PDF subscription. This is not true the other way around: a PDF subscription only includes a digital version of the paper of the day (or of the past couple of days).
Apart from our newspapers' meta-bundling behaviour, we also looked at the prices they charge for their subscriptions. We first calculated ratios between the price of the online and print subscriptions. We have done this both, albeit separately, for site and PDF subscriptions (see above for definitions). The underlying assumption is that, for a given breadth of online content (which we have not measured), the higher the ratio, the more the attractiveness of the online channel is limited, which may indicate a higher fear of cannibalisation. However, none of our regressions with these rough indicators yielded meaningful results. We therefore examined newspapers that apply mixed bundling separately and calculated the percentage discount:
| (price of print subscription + price of online subscription) - price of bundle
price of print subscription + price of online subscription |
In this expression, online subscription alternatively means PDF (or whatever format is adopted) and site subscription. Clearly, the higher the discount, the lower the probability that a print subscriber will defect - that is, opt for the online version alone.
In our view, this is the better (though by no means perfect) indicator of channel spill-over of the three that we investigate. Importantly, we were unable to control for the breadth and nature of the content that is offered online, whereas our newspapers may well have invested in differentiating their online from their print content. This undermines to some extent the assumption underlying our second indicator that the more expensive the online version is compared to the print version, the more a newspaper fears cannibalisation. Indeed, a newspaper with differentiated online content can have both less reason to fear channel spill-over as well as more room to charge a high price for its online content. Thus, there need not be a direct correspondence between the price that a newspaper charges for its online content and its fear of channel spill-over. Our third indicator, the discount for a print+online-bundle, is also about pricing of online and offline content, but is not invalidated by this criticism, on the contrary.
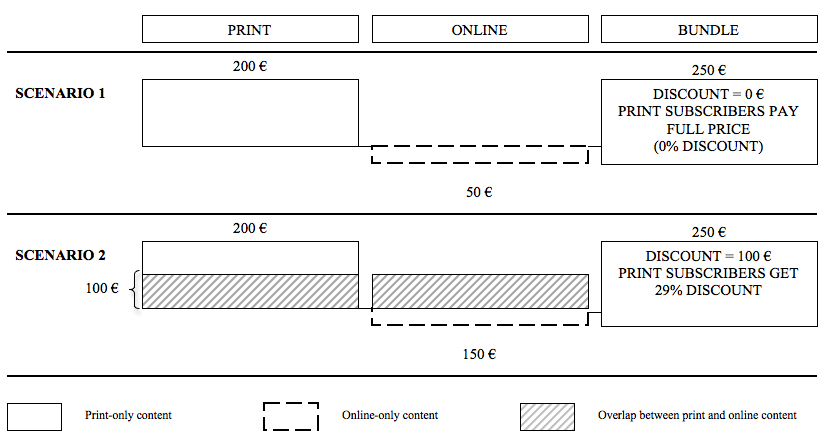
Consider, in Figure 1, a newspaper that charges €200 a year for a print subscription. Suppose, first, that this newspaper does not offer any of its print content online and only has dedicated content on its Website (Scenario 1). Such a newspaper clearly has no reason to fear channel spill-over, as the Website is fully complementary to the printed paper. As a result, it does not need to offer a discount for print subscribers and has ample room to charge for access to the site, say by means of a site subscription. Suppose that our newspaper charges €50 a year for the online content, with print subscribers paying the full price.
Let us then turn to Scenario 2 and suppose that, besides offering original online content, the newspaper starts to also replicate part of its print content online; say half, which would be worth €100 in print. This obviously increases the danger of channel spill-over, especially if one assumes, to keep matters simple, that readers exhibit no print (nor Web) preference; in other words, readers are assumed to be indifferent as to the channel through which they access a specific piece of content. The newspaper can react to this danger by charging (more) for its site subscription (to a maximum of €100), while offering a discount of, say, €100 for print subscribers (for whom only the online only content has real value added).
The crux of this example is that while the price of the site subscription (€50 initially, €150 in the second scenario) is driven both by content differentiation and by channel spill-over fear (thus, by both Online-only content and the Overlap), the level of the discount (zero initially, €100 in the second scenario) is only driven by latter (see Figure 1). Hence, any ratio of online and offline prices will only be a good indicator of cannibalisation fear in the absence of online-only content, whereas the percentage discount does not suffer from this handicap. In other words, using the discount rather than the ratio makes it possible to eliminate the disturbing influence of dedicated online content.
This said, our explanation and, in particular, our numerical example, might raise the following interrelated questions: (1) is the discount not just an emanation of fair pricing (as it would be unfair to make print subscribers pay twice for the same content) and (2) given the numbers in Scenario 2, why would the newspaper fear cannibalisation at all? If the newspaper duplicates €100 worth of its print content online, would it not be indifferent to getting paid €100 for that content in print or online? Might it not even prefer the latter (because of lower production and distribution costs)?
Giving print subscribers the duplicated content for free would indeed seem to be a prerequisite for being able to charge them (€50 in our example) for the exclusive online content. Not many print readers will be willing to pay, on top of their print subscription, the full price of the online subscription just to get access to €50 worth of online-only content. However, jumping to the second question, there are definitely reasons why our newspaper might prefer its print subscribers not to opt for the online subscription. With the numbers in Scenario 2, for every print subscriber who thinks that paying €150 for the online subscription is a better offer than paying €200 for the print subscription, the newspaper loses €50 in reader revenues. Hence, it has every reason to make the bundle attractive.
Secondly, in our example we assume that the willingness to pay for a given piece of content is the same whether it is presented on paper or online. There is no certainty about this. As mentioned above, a recent survey by PricewaterhouseCoopers (2009) estimated the willingness to pay for high-quality online content at only 62% of the willingness to pay for the same type of news on paper. Thus, it is possible that our newspaper, when it offers €100 worth of its print content online may not be able to charge €100 for that content online, thus further increasing the losses.
An interesting illustration is the implementation of a pay wall, on July 2, 2010, by The Times in the U.K. at £1 for a day's access and £2 for a week. Sensible online readers would thus pay £2 a week or about £8.50 a month. A reader of the print version who buys The Times every day of the week and The Sunday Times on Sunday spends £8.50 a week (Beehivecity 2010).
Finally and perhaps most importantly, newspapers have to optimise more than one revenue stream. John Hartigan, CEO of News Ltd, News Corporation's Australian brand, points out that, broadening the perspective to include advertising revenues, 'an online reader generates about 10 per cent of the revenue we can make from a newspaper reader. So, for every reader we lose from the paper we need to pick up 10 online' (WAN-IFRA 2010: 18). Group M, the media buying agency of media group WPP, states that 'the bulk of news surfers are useless tourists who not only pay nothing but have little advertising potential' (Gapper 2010). If a migration of readers to the online channel results in lower overall advertising revenues, this is clearly an important reason to fear such migration.
In short, there are clear reasons why, with the numbers in Scenario 2, our newspaper might fear cannibalisation of its print version and want to make its bundle attractive by offering a discount that goes further than just fair pricing. In our example, the newspaper might lower the price of the bundle to, say, €230. It could then be argued that the best measure of fear of cannibalisation is the difference between the fair price (€250) and the real price (€230). From this perspective, a problem is that we have not measured the overlap between the online and print content and thus cannot determine whether the prices and discounts that we observe are driven only by fair pricing. Also, risk attitudes may differ across publishers.
As explained above, on the newspaper level we mainly look at the genre and type of newspaper. In both cases, we contacted the national co-ordinating organizations in order to obtain a certified classification. Where genre is concerned, we initially distinguished four categories, namely general, sports, financial and other (religious, political, etc.), but ended up using only a dummy variable for FINANCIAL (as this gave the best results). For type, most professional organizations simply distinguish quality from popular newspapers. Only the Newspaper Society in the U.K. has a third, mid-market category. In the construction of our dummy variable for QUALITY, the mid-market papers (which number only two) were placed under popular. Another variable on the newspaper level is the price of the annual print subscription. We use both the unscaled price, denoted as P(PRINT) and a scaled variable, P(PRINT)/AVGP, with AVGP the average price of a print subscription in the relevant market. (What we understand by market and how it differs from country is explained below.) The benefit of using the scaled variable is that it allows for separation of newspaper- and market-specific effects.
Where advertising is concerned, in the absence of newspaper-level data we used country-level data. Specifically, we tried three alternatives: the contribution of offline advertising to daily newspapers' revenues per country (ADVERT CONTRIB); newspapers' share in total advertising expenditure in the country (ADVERT-%EXP-NP); and advertising revenues generated by paid-for dailies per country (in €, scaled by GDP per capita) (ADVERT-€REV-NP). In a bolder attempt, we also introduced the share of the Internet in total advertising expenditure in the country (ADVERT-%EXP-NET) and the level of advertising expenditure on the Internet per country (in €, scaled by GDP per capita) (ADVERT €EXP-NET). The underlying intuition for the introduction of the latter variables was that perhaps newspaper sites have a lower cannibalisation fear because they think they will be able to capture part of the bigger Internet advertising pie, but do not necessarily succeed. (In 2007, the bulk of the rapid increase in online advertising revenue went to portals, search engines and aggregators such as Google News (Isaacson 2009).) Also on the country level, we included Internet access as a percentage of the population (%INTERNET) and mean weekly hours spent on Internet (MEANHOURSNET).
Finally, we devoted special attention to the mimicking variables because the different theories of inter-organizational imitation discussed above require, at least to a certain extent, different operational measures. A useful distinction is the classification into frequency-based imitation, where the most widespread behaviour is copied; trait-based imitation, where the behaviour of specific groups of firms is copied larger firms or firms in the same strategic group); and outcome-based imitation, where the best performing players are copied (Haunschild and Miner 1997; Ordanini et al. 2008). Since we have no information on the success of the strategic decisions taken by our newspapers, we cannot test for outcome-based imitation and hence focus on frequency- and trait-based imitation, at least for D1.
In terms of operationalisation, frequency-based imitation implies that it matters whether a technology or a decision is heavily diffused in the market or not. Therefore, we tallied how many newspapers in a given country follow a specific strategy and divided that number by the total number of newspapers in that country. The goal of this was to test, across countries, whether the local popularity of a strategy affects newspapers' behaviour. However, we also wanted to give a trait-based flavour to some of our mimicking variables. Indeed, Terlaak and Gong (2008: 847) point out that, from an organizational learning perspective, it may make sense for an organization to look at 'referent organizations that are comparable'. Since one of our assumptions in Bleyen and Van Hove (2010b) was that quality newspapers might very well have an easier time charging for content, we singled out type as a relevant trait and explicitly allowed for the possibility that our newspapers' reference group could be limited to newspapers in the same segment (quality versus popular). In other words, the assumption is that quality newspapers will only look at what the other quality newspapers in the same country do. But this choice of reference group can be framed equally well in an industrial organization perspective. As Ordanini et al. (2008: 384, emphasis added) put it: '., the best way to reduce competition is to copy the decisions of similar players'.
Overall, our mimicking variables differ in three dimensions (which build on one another), so that the variables number eight (23) in total. In a first dimension, as an alternative to computing relative numbers of organizations, we also use market shares of the target firms, the additional assumption being that larger newspapers exert more influence on others. From their organizational learning perspective, Terlaak and Gong point out that firm size 'can be a proxy that is indicative of the referent firms' capabilities to identify superior practices' (2008: 846), so that it may make sense to copy larger organizations. But, needless to say, looking at market shares makes obvious sense in an Industrial organization perspective too (since larger newspapers have more market power). A second dimension of our mimicking variables is related to the question of whether the referent firm itself should be included or not in the calculations (of either numbers or market shares). We have tried both options and will discuss the ramifications when presenting specific results below. In a third dimension, we allowed for the possibility that our newspapers' reference group could be all newspapers in the country or only those in the same segment (either quality or popular), as explained above.
These three dimensions are reflected in our notations for the mimicking variables in D1. The notations consist of four parts, with the first part indicating whether we use relative numbers (#) or market shares (%), followed by an abbreviation of the strategy concerned (that is, MIXED for mixed bundling), ALL or COMP (for competitors) to specify whether the newspaper itself is included or not and MARKET or SEGM (for quality or popular) to indicate the level of analysis. For example, #MIXED-COMP-SEGM refers to the relative number of competitors in the same market segment that have opted for mixed bundling.
For our second decision (where we try to explain the level of the bundle discount) we needed different mimicking variables. In a first alternative we simply computed the average discount granted by competitors in the same country (AVDISC-COMP-MARKET). In a second alternative, we included the newspaper itself (AVDISC-ALL-MARKET). Also, as mentioned above, from both the organizational Learning and Industrial organization perspectives it is possible that bigger firms (that is, firms with a higher market share) exert more pressure on others. This is why, in a third and fourth alternative, we calculated a weighted average of the discount that all newspapers/competitors with a PDF or site subscription offer (WAVDISC-ALL-MARKET and WAVDISC-COMP-MARKET, respectively). Unfortunately, as will become clear in the next Section, the number of observations was too low to also perform these calculations on the segment level in a meaningful way. In other words, we were unable to test for trait-based imitation in D2.
Importantly, in constructing all the above variables, we have assumed that newspaper markets are national, with one exception. For the case of Belgium we have assumed that language defines the market borders and that Dutch or French language newspapers only look at their Dutch or French language counterparts. This focus on local competitors is clearly industrial organization-inspired, but is also compatible with the information cascades theory.
We now present our regression results, decision by decision. In each subsection, the results are preceded by selected descriptive results, in order to give the reader a feel for the data set. As mentioned, for D1 (the choice between mixed and no bundling) we used binary logit analysis. In D2 (the discount applied under mixed bundling), the dependent variable is of a continuous nature and we use ordinary least squares.
Our descriptive results show that pure bundling is not popular as a meta-bundling strategy: only one (Belgian) newspaper (1.2% of all newspapers) applies it. Twenty-seven newspapers (32.9%) opt for mixed bundling and twenty-nine (35.4%) choose no bundling. On a per country basis, the differences are particularly salient. In the U.K., for example, 70% of the newspapers fall into the category no bundling and only 10% choose mixed bundling. By contrast, in Germany, mixed bundling strategies (60%) have a much stronger presence than no bundling (10%).
In Table 2, we attempt to explain our newspapers' choice between mixed and no bundling. An obvious but important remark is that we only consider newspapers that have online subscriptions, since the other Websites, including those that are completely free, simply have no bundling decisions to make. Recall that we have also excluded the one newspaper that opts for pure bundling.
| VARIABLES | Model I | Model II | Model III | Model IV | Model V | Model VI | Model VII | |||||||
|---|---|---|---|---|---|---|---|---|---|---|---|---|---|---|
| B | Exp (B) | B | Exp (B) | B | Exp (B) | B | Exp (B) | B | Exp (B) | B | Exp (B) | B | Exp (B) | |
| (SE) | (SE) | (SE) | (SE) | (SE) | (SE) | (SE) | ||||||||
| Newspaper-specific | ||||||||||||||
| P(PRINT) | 0.013** | 1.013 | ||||||||||||
| 0.006 | ||||||||||||||
| P(PRINT)/AVGP | 1.112 | 3.041 | ||||||||||||
| 1.660 | ||||||||||||||
| FINANCIAL | 1.834* | 6.259 | 2.211** | 9.126 | 1.832** | 6.245 | 2.134** | 8.449 | 2.620** | 13.737 | ||||
| 1.030 | 0.961 | 0.907 | 0.962 | 1.091 | ||||||||||
| Country-specific | ||||||||||||||
| AVGP | 0.022** | 1.022 | 0.050** | 1.052 | ||||||||||
| 0.010 | 023 | |||||||||||||
| %INTERNET | 0.110* | 1.116 | 0.167** | 0.292** | 0.292** | 1.340 | 0.021 | 1.021 | 0.028 | 1.028 | 0.048 | 1.049 | ||
| 0.058 | 0.083 | 0.119 | 0.119 | 0.039 | 0.038 | 0.043 | ||||||||
| MEANHOURSNET | -0.341 | 0.711 | ||||||||||||
| 0.634 | ||||||||||||||
| ADVERT-CONTRIB | 0.002 | 1.002 | 0.010 | 0.990 | 0.037 | 1.038 | ||||||||
| 0.072 | 0.075 | 0.227 | ||||||||||||
| ADVERT-€REV-NP | 0.000 | 1.000 | 0.000 | 1.000 | ||||||||||
| 0.000 | 000 | |||||||||||||
| Market-specific | ||||||||||||||
| #MIXED-COMP-MARKET | 0.026** | 1.026 | ||||||||||||
| 0.012 | ||||||||||||||
| #MIXED-COMP-SEGM | 0.014 | 1.014 | ||||||||||||
| 0.010 | ||||||||||||||
| %MIXED-COMP-MARKET | -0.010 | 0.990 | -0.021 | 0.979 | -0.094 | 0.911 | 0.035** | 1.035 | ||||||
| 0.019 | 0.023 | 0.057 | 0.016 | |||||||||||
| %MIXED-COMP-SEGM | 0.037** | 1.038 | ||||||||||||
| 0.018 | ||||||||||||||
| Intercept | -8.213** | 0.000 | -14.133** | 0.000 | -25.661** | 0.000 | -2.980 | 0.051 | -2.980 | 0.051 | -3.332 | 0.036 | -2.913 | 0.054 |
| 3.409 | 5.934 | 10.265 | 4.448 | 4.448 | 2.210 | 11.005 | ||||||||
| Nagelkerke R Square | 0.316 | 0.310 | 0.488 | 0.288 | 0.221 | 0.323 | 0.486 | |||||||
| Cox & Snell R Square | 0.233 | 0.230 | 0.366 | 0.215 | 165 | 0.241 | 0.353 | |||||||
| -2 Log Likelihood | 46.290 | 45.723 | 34.418 | 52.278 | 55.126 | 49.396 | 29.337 | |||||||
| No. of observations | 43 | 42 | 37 | 46 | 46 | 45 | 34 | |||||||
| Chi-squared | 11.423 | 10.969 | 16.848 | 11.143 | 8.295 | 12.430 | 14.812 | |||||||
| Overall significance | 0.010 | 0.027 | 0.005 | 0.025 | 0.081 | 0.014 | 0.005 | |||||||
| Note: Superscripts *, ** and *** indicate that the coefficient is significantly different from zero at the 10%, 5% and 1% level, respectively. | ||||||||||||||
On the newspaper level, two variables stand out as having a significant impact, namely the unscaled price of a print subscription and, in particular, whether the newspaper is a financial newspaper. These two results are linked because FINANCIAL on the one hand and P(PRINT) and P(PRINT)/AVGP on the other are strongly correlated. However, P(PRINT) in Model I primarily seems to capture a country effect, because when it is decomposed, in Model II, into P(PRINT)/AVGP and AVGP, the latter is significant but the first is not. Financial newspapers are more eager to adopt mixed bundling and thus appear to have, all else being equal, a greater fear of channel spill-over (Models III-VII), in line with Hypothesis 2. On the other hand, the quality dummy is never significant. Hypothesis 3 (probably not coincidentally the hypothesis that was least well underpinned) is thus not supported. As an aside, if a recent survey by the Boston Consulting Group (2009) is to be believed, by adopting mixed bundling financial newspapers cater to the wants of their readers. According to the survey, 52% of U.S. consumers of business news would be interested in a bundled print-and-online subscription, compared with just 35% of consumers of news for 'young and personal use'.
Leaving the newspaper level, the prime observation in Table 2 is that there is indeed a country/market effect, which, interestingly, is alternatively captured by the (average) price of a print subscription - P(PRINT) and AVGP in Models I-III, alongside %INTERNET - or by our mimicking variables (Models IV, VI and VII). Reassuringly, the models remain completely intact when the newspaper itself is also included in the calculations of the mimicking variables; that is, when #MIXED-COMP-MARKET is replaced by #MIXED-ALL-MARKET and so on (models not reported). Stronger still, the mimicking variable in Model V is now also significant, at the 1% level. In Models IV and VI, the significance of the mimicking variable jumps from the 5% to the 1% level. Mimicking variables that consider all newspapers with a specific strategy are difficult to justify in the information cascades, organizational learning and decision-making frameworks that posit that firms try to capture the experience of other organizations. However, as explained in Bleyen and Van Hove (2010b), mimicking variables of the ...-ALL-... type can be justified from an industrial organization or an neo-institutional theory perspective.
This said, a potential problem with our analysis in Table 2 is that when the ...-COMP-... mimicking variables are introduced, in Models IV-VII, none of the variables on the country level remain significant. The technical explanation is that AVGP is strongly correlated with all four mimicking variables; the Pearson correlations lie between .392*** and as much as .693***. The analytical question is whether what we find in models IV, VI and VII in Table 2 (and for Models IV-VII with ...-ALL-... mimicking variables) is really mimicking behaviour or whether the variables might simply capture a country effect that is not (adequately) captured by our country-specific variables. For some of our mimicking variables, this danger is real because in practice they act as sophisticated country dummies. Indeed, the value for #MIXED-ALL-MARKET is the same for all newspapers in a given country. Suppose that there are ten national newspapers in country i and that six of them opt for mixed bundling and the remaining four for no bundling. In such a setting, the value for #MIXED-ALL-MARKET equals 6/10 for all newspapers in the country. However, this is (more or less progressively) less the case and hence less of a problem for the mimicking variables that exclude the newspaper itself (...-COMP-...), that count the (relative) number of newspapers in the same segment (...-SEGM), that exclude the newspaper itself and are situated on the segment level(...-COMP-SEGM), that consider market shares instead of numbers (%...) and so on. From this perspective, the fact that seven out of the eight mimicking variables yield significant results does seem to indicate that there is indeed mimicry among online newspapers. A drawback is that it is not possible to discriminate between the possible drivers for such behaviour mentioned in the methodology Section. Whereas the evidence in Bleyen and Van Hove (2010b) primarily seems to point in the direction of strategic interaction (and hence the Industrial organization framework), here the explanation might equally well lie in, say, the taken-for-grantedness of the Neo-Institutional Theory, which can be considered to mean that a new product, process or service is simply not questioned anymore and generally adopted (Aldrich & Fiol 1994; Haunschild & Chandler 2008).
In Table 2 the number of observations varies because of missing values for some of the variables. We have therefore repeated our regressions with overlapping sets. In putting together these overlapping sets, we ignored MEANHOURSNET (and thus Model VII), as this variable would have reduced the number of observations too drastically. The results with overlapping sets are not so reassuring: in Models I, IV and VI none of the variables remain significant. In Model II, the significance of %INTERNET drops to 10%. (Conversely, in Model V, %INTERNET becomes significant at the 5% level and so does ADVERT-CONTRIB, but with a positive sign.) The explanation is that the number of observations drops to a mere thirty-three, which is obviously problematic in a setting with eight countries and nine markets.
As explained above, when gauging a newspaper's fear of channel spill-over, one might, in principle, also want to look at how the prices of its online and print subscriptions compare. In our sample, the inter-country differences in such ratios were again striking, but our regressions (which are not reported here) either yielded virtually no results or the results were not consistent. With hindsight, this is perhaps not surprising. As stressed earlier, we cannot control for the degree of differentiation of the online offering. There may also be cost differences. Also, in our regressions, newspapers that opt for either mixed or no bundling were intermingled, whereas we assume in the previous subsection that the former have a higher fear of cannibalisation.
In a second step, we therefore examined newspapers that apply mixed bundling separately. As outlined earlier, we also constructed another indicator and now look at the discount that is granted for the bundle. There are twenty-seven newspapers that apply mixed bundling. Within this set of twenty-seven, newspapers with a PDF versus a site subscription proved to be two distinct groups. For one, our descriptive results show that our newspapers see PDF and site subscriptions as alternatives: only three newspapers offer both, compared to thirty-three that have a PDF subscription (but no site subscription) and twenty that have the latter (but not the former). Moreover, the three newspapers that offer both all opt for no bundling so that they do not appear here. As a result, there is no overlap at all between the two groups. Stronger still, not only are we talking about different newspapers, there are also strong country schisms: all French and Italian newspapers that opt for mixed bundling have site subscriptions (and no PDF subscriptions), whereas all German, Luxembourgian and Spanish newspapers that engage in mixed bundling are in the other group. Finally, even though the average discount for a print+PDF-bundle (29%) is not significantly different from that for a print+site-bundle (32%), PDF and site subscriptions are fundamentally different products. Hence, we decided to examine them separately, which is in line with our approach for the price ratios in the first part of this subsection, but obviously comes at a cost in terms of the number of observations. Another implication is that we needed separate mimicking variables. As explained above, in both cases we tried unweighted and weighted average discounts and also experimented with including the newspaper itself. (In two cases, the value of AVDISC-ALL-MARKET and WAVDISC-ALL-MARKET would have been identical to the discount offered by the one newspaper that practices mixed bundling for the relevant type of subscription in the relevant country. These observations were removed from the dataset.)
| VARIABLES | SITE SUBSCRIPTION | PDF SUBSCRIPTION | ||||||||||||
|---|---|---|---|---|---|---|---|---|---|---|---|---|---|---|
| Model I | Model II | Model III | Model IV | Model V | Model VI | Model VII | ||||||||
| B | t | B | T | B | t | B | t | B | t | B | t | B | t | |
| (SE) | (SE) | (SE) | (SE) | (SE) | (SE) | (SE) | ||||||||
| Newspaper-specific | ||||||||||||||
| QUALITY | -4.713 | -.647 | -6.288 | -.760 | ||||||||||
| 7.281 | 8.276 | |||||||||||||
| FINANCIAL | -4.314 | -1.237 | ||||||||||||
| 3.487 | ||||||||||||||
| P(SITE)/AVGP | 15.425*** | 4.258 | 14.464*** | 3.533 | ||||||||||
| 3.622 | 4.094 | |||||||||||||
| P(PDF) | 0.108*** | 3.819 | 0.104*** | 3.779 | 0.102*** | 5.008 | ||||||||
| 0.028 | 0.028 | 0.020 | ||||||||||||
| P(PDF)/AVGP | 18.358** | 2.984 | 17.670** | 2.981 | ||||||||||
| 6.152 | 5.927 | |||||||||||||
| Country-specific | ||||||||||||||
| %INTERNET | -.072 | -.331 | ||||||||||||
| 0.217 | ||||||||||||||
| ADVERT-CONTRIB | -1.310** | -2.659 | ||||||||||||
| 0.493 | ||||||||||||||
| ADVERT-%EXP-NET | -4.037** | -2.878 | ||||||||||||
| 1.403 | ||||||||||||||
| ADVERT-€EXP-NET | -.001*** | -3.658 | ||||||||||||
| 0.000 | ||||||||||||||
| ADVERT-€REV-NP | -4.463E-6 | -.170 | -5.035E-5* | -1.918 | -3.070E-7 | -.012 | -4.491E-5 | -1.757 | ||||||
| 0.000 | 0.000 | 0.000 | 0.000 | |||||||||||
| Market-specific | ||||||||||||||
| AVDISC(PDF)-COMP-MARKET | 0.833*** | 3.752 | 0.750*** | 3.882 | ||||||||||
| 0.222 | 0.193 | |||||||||||||
| WAVDISC(PDF)-COMP-MARKET | 0.857*** | 3.974 | 0.771*** | 4.068 | ||||||||||
| 0.216 | 0.190 | |||||||||||||
| Intercept | 24.996*** | 3.256 | 33.298*** | 3.399 | -11.962 | -1.276 | -4.039 | -.588 | -12.141 | -1.353 | -4.342 | -.653 | 84.562** | 2.612 |
| 7.676 | 9.796 | 9.372 | 6.868 | 8.972 | 6.652 | 32.380 | ||||||||
| R Square | 0.751 | 0.682 | 0.741 | 0.806 | 0.759 | 0.818 | 0.861 | |||||||
| Adjusted R Square | 0.676 | 0.586 | 0.643 | 0.733 | 0.669 | 0.749 | 0.768 | |||||||
| S.E. of the Estimate | 6.92303 | 7.82899 | 7.74144 | 6.69772 | 7.45644 | 6.49197 | 5.07324 | |||||||
| No. of observations | 14 | 14 | 12 | 12 | 12 | 12 | 11 | |||||||
| F | 10.059 | 7.139 | 7.611 | 11.064 | 8.412 | 11.948 | 9.279 | |||||||
| Overall significance | 0.002 | 0.008 | 0.010 | 0.003 | 0.007 | 0.003 | 0.010 | |||||||
| Note: Superscripts *, ** and *** indicate that the coefficient is significantly different from zero at the 10%, 5% and 1% level, respectively. | ||||||||||||||
As can be seen in Table 3, the only newspaper-level variable that proved significant was the price of the online subscription. We find that the higher the price of the site or PDF subscription (in Models I-II and III-VII, respectively), the higher the percentage discount for the respective bundle. However, this does not really confirm Hypothesis 1, which posits that newspapers that are more expensive offline are more likely to offer a higher discount. Prices for print and online subscriptions are correlated, but when P(SITE)/AVGP, P(PDF) and P(PDF)/AVGP are replaced by P(PRINT) or P(PRINT)/AVGP, the latter are not significant in any of the models. This being so, the results for P(SITE)/AVGP, P(PDF) and P(PDF)/AVGP do not really come as a surprise, since high-priced online content can in itself also be an indication of cannibalisation fear, just like a high discount (the dependent variable). That the QUALITY variable is not significant is only normal if one looks at the numbers: only one (two) out of the fourteen (thirteen) newspapers with a site (PDF) subscription that appear in Table 3 is (are) a popular newspaper. For FINANCIAL, the corresponding numbers are four out of ten for site and three out of eleven for PDF subscriptions.
Turning to the market level, the advertising variables always appear with a negative sign (in line with Hypothesis 4) and are significant in four of the seven models. Continuing our analysis, overall the models show that mimicking behaviour is difficult to distinguish from a possible non-imitative process where newspapers simply respond identically to a common driver. Indeed, the bulk of the models in Table 3 are either/or, in the sense that the impact of advertising and indications of mimicking behaviour do not show up together in the same model - with the exception of Model IV. Note that, at least where the PDF subscriptions are concerned, the advertising variables are strongly correlated with the mimicking variable: for example, the Pearson correlation between ADVERT-CONTRIB, ADVERT-%EXP-NET and ADVERT-€EXP-NET on the one hand and AVDISC(PDF)-COMP-MARKET (WAVDISC(PDF)-COMP-MARKET) on the other hand amount to 0.695** (0.721***), -0.615** (-0.647**) and even 0.936*** (0.936***) respectively. Only ADVERT-€REV-NP does not suffer from multicollinearity (at -0.003) and this is, not coincidentally, the variable that appears in Model IV. But allowing for this caveat, we do find unambiguously in Models III to VI that the higher the (weighted) discount granted by other newspapers in the same country or region that offer a bundle containing a PDF subscription, the higher the discount offered by the newspaper itself. Broadening the mimicking variables in Models III-IV to the average discount offered by competitors that have a PDF subscription or a site subscription yields virtually identical results (not reported in Table 3). Also, Models III-VI remain intact when the ...-COMP-... mimicking variables are replaced by ...-ALL-... variables. In Models IV and VI, the advertising variable now even becomes significant (at the 5%, resp. 10% level); and in Models III and V, P(PDF)/AVGP is now significant at the 1% level. We find no evidence of mimicking for site subscriptions.
This paper deals with an important strategic concern for newspapers, namely channel spill-over between the print and online version. In the previous Section, we presented our findings decision by decision. Here we use Table 4 to look at the impact of variables across decisions. We also compare our results with those obtained in Bleyen and Van Hove (2010a, 2010b), all the while keeping in mind the different nature of the decisions.
| D1-2 | MIXED BUNDLING | DISCOUNT | |||
|---|---|---|---|---|---|
| SITE | |||||
| Sign. | Validation | Sign. | Sign. | Validation | |
| Newspaper-specific | |||||
| P(PRINT) | (+**) | ||||
| P(PRINT)/AVGP | |||||
| P(SITE)/AVGP | +*** | (H1) | |||
| P(PDF) | +*** | ||||
| P(PDF)/AVGP | +** | ||||
| QUALITY | |||||
| FINANCIAL | +**/* | H2 | |||
| Country-specific | |||||
| AVGP(PRINT) | +** | ||||
| %INTERNET | +**/* | H5 | |||
| MEANHOURSNET | |||||
| ADVERT-CONTRIB | -** | H4 | |||
| ADVERT-%EXP-NET | -** | ||||
| ADVERT-€REV-NP | -* | ||||
| ADVERT-€EXP-NET | -*** | ||||
| Market-specific | |||||
| #MIXED-ALL-MARKET | +*** | H6 | |||
| #MIXED-ALL-SEGM | +*** | ||||
| %MIXED-ALL-MARKET | +*** | ||||
| %MIXED-ALL-SEGM | +** | ||||
| #MIXED-COMP-MARKET | +** | ||||
| #MIXED-COMP-SEGM | |||||
| %MIXED-COMP-MARKET | (+**) | ||||
| %MIXED-COMP-SEGM | +** | ||||
| AVDISC(...)-ALL-MARKET | +*** | H6 (PDF) | |||
| WAVDISC(...)-ALL-MARKET | +*** | ||||
| AVDISC(...)-COMP-MARKET | +*** | ||||
| WAVDISC(...)-COMP-MARKET | +*** | ||||
To start with the individual characteristics, the most important results is that, in line with Hypothesis 2, financial newspapers are more likely to opt for a mixed bundling strategy. In Bleyen and Van Hove (2010b) we find that they are also more likely to charge for their archive. Conversely, FINANCIAL does not appear to have an impact on the bundling discount (this paper), nor on the high-level free or fee-choice (Bleyen & Van Hove 2010b) or on the decision to offer subscriptions and/or pay-per-view (Bleyen & Van Hove 2010a). Contrary to expectations (in Hypothesis 3), QUALITY is not significant at all for the two bundling decisions. In particular for D2, this may be because of the low number of popular newspapers in the dataset. In bigger and more heterogeneous data sets, QUALITY does matter: we find that quality newspapers are clearly more likely to have a fee Website (Bleyen and Van Hove 2010b) and site subscriptions (Bleyen and Van Hove 2010a). For pay-per-view, PDF subscriptions and a paid-for archive, the evidence is less overwhelming. A final result on the newspaper level is that Hypothesis 1 is not really supported: in Table 2, P(PRINT) primarily seems to capture a country effect; in Table 3, we do find a significant impact of prices, but only for the prices of the online subscriptions.
On the country level, we have some results for %INTERNET for D1(but not for D2) and for the impact of advertising revenues for D2(but not for D1). This relatively low incidence of country-specific variables is even more outspoken for the free or fee and archive decisions analysed in Bleyen and Van Hove (2010b). Conversely, in Bleyen and Van Hove (2010a), we do find a significant impact of advertising. We find that the higher the relative importance of (offline) advertising, the lower the probability that newspapers have a site subscription or pay-per-view, apparently because they aim for the same type of revenues on- and offline. For PDF subscriptions, the advertising variables have a positive impact, perhaps because the PDF version comprises the same advertisements as its paper counterpart. However, a problem with these results, which is in fact a returning problem with just about all our country-level results, also in this paper, is that the impact of the relative importance of advertising on the one hand and mimicking behaviour on the other hand are just about impossible to disentangle as the two types of variables almost never appear together in a model (because they are strongly correlated). What we call mimicking behaviour might thus be the result of several newspapers in a given country making the same move because they are influenced by a common driver. Disentangling the two explanations is clearly a challenge for future research.
Apart from this caveat, we do find strong indications of mimicking behaviour in the present paper: for D1, seven out of the eight mimicking variables prove significant, at the 5% to 1% level; for D2, we find that the discount offered for the print+PDF-bundle is positively influenced by the (weighted) average discount set by competing newspapers, but find no such effect for the print+site-bundle. Compared to the mimicking results in our other papers, these results are less open to criticism; see in particular the discussion in Bleyen and Van Hove (2010b).
In the latter paper, we also tried to determine in which of the mimicking theories briefly discussed in this paper our findings could be framed. Our analysis provided support to the importance of the neo-institutional theory and industrial organization perspectives, with the anecdotal evidence suggesting that the framework of industrial organization is the more important of these two concepts. As already mentioned, for D1, discriminating between mimicking theories is not possible because just about all mimicking variables are significant. However, since D2 is not about adoption of new practices or technologies but all about pricing, the rivalry-based imitation of the industrial organization stream would again seem to be the most obvious framework.
An important remark is also that when interpreting our results, one has to take into account that the bundle discount would seem to be a better measure of newspapers' fear of channel spill-over than their use of mixed bundling. We find, for example, that financial newspapers are more likely to opt for a mixed bundling strategy but that FINANCIAL does not affect the bundling discount. If the second is the better indicator of the two, then one should not jump to conclusions as to the reason of the different bundling behaviour of financial newspapers.
Finally, even though we yet have to discover salient drawbacks to using the bundle discount as an indicator of channel-spill-over fear, it is clear that there is always room for improvement. In particular content analysis would seem to impose itself as the next step in our research endeavours, as this would allow to gauge the overlap between the print and online offerings and in this way would make it possible to quantify the substitute or complement nature of the content.
Steve Brown (The Newspaper Society, U.K.), Marc Thiltgen (TNS-Ilres, Luxembourg), Sabine Ozil (SPQN, France), Marlene Blonk (Cebuco, the Netherlands), Tamara van Langenhof (Vlaamse Dagbladpers, Belgium), Federico Megna (FIEG, Italy), Heike Laumer (BDZV, Germany) and Maribel Matallanas (AEDE, Spain) are gratefully acknowledged for providing data, as well as all the newspapers that helped to resolve more detailed and newspaper-specific questions.
We thank the Editor and an anonymous referee for providing valuable guidance on an earlier version of this paper. We also thank Robert G. Picard and past and present colleagues Ralf Caers, Bruno Heyndels, Marc Jegers and Ellen Loix for their constructive comments.
Valérie-Anne Bleyen obtained her PhD from the Vrije Universiteit Brussel (Free University of Brussels) in 2010. She is currently a researcher at the Center for Studies on Media, Information and Telecommunication (SMIT) of the same university. She can be contacted at vbleyen@vub.ac.be
Leo Van Hove is a professor of Economics at the Vrije Universiteit Brussel (Free University of Brussels), where he teaches courses in monetary economics, economics of information, and e-commerce. He can be contacted at Leo.Van.Hove@vub.ac.be.
| Find other papers on this subject | ||
| D1 - The decision to offer no or mixed bundling (Mixed = 1/No = 0) | ||||
|---|---|---|---|---|
| Country | Obs | Mixed | Mean | Std. Dev. Across Countries |
| BE | 6 | 4 | 0.6667 | 0.25868 |
| NL | 5 | 4 | 0.8 | |
| LUX | 4 | 2 | 0.5 | |
| FR | 7 | 5 | 0.7143 | |
| DE | 7 | 6 | 0.8571 | |
| IT | 12 | 3 | 0.25 | |
| ES | 7 | 2 | 0.2857 | |
| UK | 8 | 1 | 0.125 | |
| Total | 56 | 27 | 0.4821 | |
| N.A. | 26 | - | 0.3171 | - |
| D2 - The discount when purchasing a bundle of online and print subscription (%) | ||||||
|---|---|---|---|---|---|---|
| Country | Obs | Mean | Std. Dev. | Min | Max | Std. Dev. Across Countries |
| BE | 4 | 27.7425 | 16.79092 | 14.24 | 50 | 9.71633 |
| NL | 4 | 32.745 | 11.89705 | 24.15 | 50 | |
| LUX | 2 | 46.97 | 0.12728 | 46.88 | 47.06 | |
| FR | 5 | 31.162 | 9.05924 | 15.9 | 39.07 | |
| DE | 6 | 30.325 | 11.46983 | 11.16 | 41.16 | |
| IT | 3 | 34.2067 | 13.74002 | 25 | 50 | |
| ES | 2 | 21.8 | 4.97803 | 18.28 | 25.32 | |
| UK | 1 | 10.75 | - | 10.75 | 10.75 | |
| Total | 27 | 30.7637 | 12.14514 | 10.75 | 50 | |
| VARIABLE ABBREVIATION | VARIABLE | DESCRIPTION | % OF TOTAL SAMPLE (N=82) | Newspaper-specific |
|---|---|---|---|
| P(PRINT) | Price annual print subscription (Missing data) |
The price of an annual print subscription (in €). (Mean = 265.7310; St. Dev. = 85.98075) |
74.4 (25.6) |
| P(PRINT)/AVGP | Price annual print subscription - scaled per country/region (Missing data) |
The price of an annual print subscription (in €), divided by the average price per country/region. (Mean = 1.0000; St. Dev. =0.22683) |
73.2 (26.8) |
| P(SITE) | Price annual site subscription (Missing data) |
The price of an annual site subscription (in €). (Mean = 161.9143; St. Dev. = 96.73345) |
28.0 (72.0) |
| P(SITE)/AVGP | Price annual site subscription - scaled per country/region (Missing data) |
The price of an annual site subscription (in €), divided by the average price per country/region. (Mean = 1.0000; St. Dev. =0.45003) |
28.0 (72.0) |
| RATIO(SITE/PRINT) | The ratio of the annual site/PRINT subscription (Missing data) |
The price of the annual site subscription, divided by the price of the annual print subscription (in €). (Mean = 58.9941; St. Dev. = 29.80026) |
26.8 (73.2) |
| P(PDF) | Price annual PDF subscription (Missing data) |
The price of an annual PDF subscription (in €). (Mean = 150.2276; St. Dev. = 68.99444) |
35.4 (64.6) |
| P(PDF)/AVGP | Price annual PDF subscription - scaled per country/region (Missing data) |
The price of an annual PDF subscription (in €), divided by the average price per country/region. (Mean = 6.6033; St. Dev. = 30.32906) |
35.4 (64.6) |
| RATIO(PDF/PRINT) | The ratio of the annual PDF/PRINT subscription (Missing data) |
The price of the annual PDF subscription, divided by the price of the annual print subscription (in €). (Mean = 51.9289; St. Dev. = 20.19829) |
28.0 (72.0) |
| ONLINEREACH | Online daily reach per million of users (3 months average) (Missing data) |
Reach measures the number of users and is expressed as the percentage of all Internet users who visit a given site, averaged over the specified time period (August-September-October 2006). Source: http://www.alexa.com. (Mean = 394.4461; St. Dev. = 639.94937) |
96.3 (3.7) |
| QUALITY | Quality newspaper? | Equals 1 if this is a quality newspaper. | 68.3 |
| POPULAR | Popular newspaper? | Equals 1 if this is a popular newspaper. | 24.4 |
| (Missing data) | Source: We contacted the national coordinating organizations or the newspapers themselves in case no information could be obtained on the higher level. | (7.3) | |
| FINANCIAL | Financial newspaper? (Missing data) |
Equals 1 if newspaper is financial.Source: We contacted the national coordinating organizations or the newspapers themselves in case no information could be obtained on the higher level. | 14.6 (18.3) |
| Country-specific | |||
| AVGP(PRINT) | The average price of an annual print subscription per country/region (Missing data) |
The average price of an annual print subscription per country/region (in €). (Mean = 259.5219; St. Dev. = 55.41845) |
87.8 (12.2) |
| AVGP(SITE) | The average price of an annual site subscription per country/region (Missing data) |
The average price of an annual site subscription per country/region (in €). (Mean = 150.2333; St. Dev. = 48.12118) |
80.5 (19.5) |
| AVGP(PDF) | The average price of an annual PDF subscription per country/region | The average price of an annual PDF subscription per country/region (in €). (Mean = 145.3756; St. Dev. = 36.47752) |
100 |
| ADVERT-CONTRIB | Contribution of advertising to daily newspapers' revenues (%) | The contribution of advertising (as opposed to copy sales) to daily newspapers' revenues (in %). Source: Report of the World Association of Newspapers 2006 (Mean = 51.128; St. Dev. = 9.70788) |
100 |
| ADVERT-%EXP-NP | Advertising expenditure shares newspapers (%) | The advertising expenditure on newspapers (as opposed to magazines, TV, radio, cinema, outdoor and Internet) (in %). Source: Report of the World Association of Newspapers 2006 (Mean = 29.7659; St. Dev. = 11.0601) |
100 |
| ADVERT-%EXP-NET | Advertising expenditures shares Internet (%) | The advertising expenditure on Internet (as opposed to newspapers, magazines, TV, radio, cinema and outdoor) (in %). Source: Report of the World Association of Newspapers 2006 (Mean = 2.5061; St. Dev. = 1.98023) |
100 |
| ADVERT-€EXP-NET | Advertising expenditures on Internet (€) (Missing data) |
The Internet advertising expenditure in € per country, scaled by dividing by GDP per capita. Source: Report of the World Association of Newspapers 2006 (Mean = 12574.3882; St. Dev. = 1.55330E4) |
92.7 (7.3) |
| ADVERT-€REV-NP | Advertising revenues (€) | The advertising revenues for the paid-for dailies in each country (in €), scaled by dividing by GDP per capita. Source: Report of the World Association of Newspapers 2006 (Mean = 74746.5327; St. Dev. = 5.39780E4) |
100 |
| %INTERNET | Internet penetration | The Internet access in a given country, measured as a % of population. Source: Internet World Stats - Usage and Population Statistics, available at http://www.internetworldstats.com/stats9.htm#eu. (Mean = 52.3963; St. Dev. = 8.68196) |
100 |
| MEANHOURSNET | Internet consumption (Missing data) |
Mean weekly hours spent on Internet per country. Source: Report of the World Association of Newspapers 2006 (Mean = 3.6441; St. Dev. =0.94253) |
72.0 (28.0) |
| Market-specific | |||
| #MIXED-COMP-MARKET | Relative number of mixed bundling competitors in the relevant market (%) (Missing data) |
The number of other newspapers in the same country/region that adopt mixed bundling, divided by the total number of newspapers in
the same country/region that apply either mixed or no bundling (in %). (Mean = 48.2139; St. Dev. = 29.05623) |
68.3 (31.7) |
| #MIXED-COMP-SEGM | Relative number of mixed bundling competitors in the relevant market and market segment (%) (Missing data) |
The number of other newspapers in the same country/region and market segment as the newspaper itself (either quality or
popular) that adopt mixed bundling, divided by the total number of newspapers in the same country/region and segment that apply
either mixed or no bundling (in %). (Mean = 44.7112; St. Dev. = 36.17382) |
63.4 (36.6) |
| %MIXED-COMP-MARKET | Market share of mixed bundling competitors in the relevant market (%) (Missing data) |
The sum of the market shares of the other newspapers in the same country/region that adopt mixed bundling (in %). (Mean = 27.9652; St. Dev. = 26.72401) |
67.1 (32.9) |
| %MIXED-COMP-SEGM | Market share of mixed bundling competitors in the relevant market and market segment (%) (Missing data) |
The sum of the market shares of the other newspapers in the same country/region and market segment (either quality or
popular) that adopt mixed bundling (in %). (Mean = 18.7686; St. Dev. = 25.86244) |
62.2 (37.8) |
| AVDISC(SITE)-COMP-MARKET | The average discount granted by competitors with a site subscription (%) (Missing data) |
The average discount given by the other newspapers in the country/region that bundle their site and print subscription (in %). (Mean = 33.8200; St. Dev. = 6.61113) |
15.9 (84.1) |
| AVDISC(PDF)-COMP-MARKET | The average discount granted by competitors with a PDF subscription (%) (Missing data) |
The average discount given by the other newspapers in the country/region that bundle their PDF and print subscription (in %). (Mean = 29.0867; St. Dev. = 10.51569) |
14.6 (85.4) |
| WAVDISC(SITE)-COMP-MARKET | The weighted average of the discount granted by competitors with a site subscription (%) - related to market shares (Missing data) |
The weighted discount is calculated as DY = (DCOMP1 * MARKSHARECOMP1+ ... + DCOMPi* MARKSHARECOMPi)/ MARKSHARECOMP1 + ... + MARKSHARECOMPi (Mean = 31.857500; St. Dev. = 8.3523444) |
14.6 (85.4) |
| WAVDISC(PDF)-COMP-MARKET | The weighted average of the discount granted by competitors with a PDF subscription (%) - related to market shares (Missing data) |
The weighted discount is calculated as DY = (DCOMP1 * MARKSHARECOMP1+ ... + DCOMPi* MARKSHARECOMPi)/ MARKSHARECOMP1 + ... + MARKSHARECOMPi (Mean = 28.678333; St. Dev. = 10.4355344) |
14.6 (85.4) |
| RATIO-COMP-SITE | The average ratio SITE/PRINT subscription of competitors (Missing data) |
The average ratio of the annual SITE subscription divided by the annual print subscription, adopted by the competitors in the same
country/region. (Mean = 61.9520; St. Dev. = 17.38923) |
24.4 (75.6) |
| RATIO-COMP-PDF | The average ratio PDF/PRINT subscription of competitors (Missing data) |
The average ratio of the annual PDF subscription divided by the annual print subscription, adopted by the competitors in the same
country/region. (Mean = 51.4330; St. Dev. = 13.79970) |
24.4 (75.6) |
© The authors, 2011 Last updated: 21 November, 2011 |
|
