Analysis and visualization of the dynamics of research groups in terms of projects and co-authored publications. A case study of library and information science in Argentina
Sandra Miguel
Instituto de Investigaciones en Humanidades y Ciencias Sociales (IdIHCS).
Universidad Nacional de La Plata. Facultad de Humanidades y Cs. De la
Educación FaHCE/UNLP - CONICET. 48 e/ 6 y 7 s/n - 8vo piso - oficina
803, La Plata, Argentina.
Zaida Chinchilla-Rodríguez
SCImago Research Group. Instituto de Políticas y Bienes
Públicos. Centro de Ciencias Humanas y Sociales, Consejo Superior de
Investigaciones Científicas, C/ Albasanz 26-28. Madrid, Spain.
Claudia González
Instituto de Investigaciones en Humanidades y Ciencias Sociales (IdIHCS).
Universidad Nacional de La Plata. Facultad de Humanidades y Cs. De la
Educación FaHCE/UNLP - CONICET. 48 e/ 6 y 7 s/n - 8vo piso - oficina
803, La Plata, Argentina.
Félix de Moya Anegón
SCImago Research Group. Instituto de Políticas y Bienes
Públicos. Centro de Ciencias Humanas y Sociales, Consejo Superior de
Investigaciones Científicas, C/ Albasanz 26-28. Madrid, Spain.
Introduction
One characteristic that defines evolution in the modes of knowledge production is the transition from research carried out on an individual basis to research done by a team and through networks of collaboration (Gibbons et al. 1997). Indeed, collaboration in science is a sign of the maturity and efficiency of branches of knowledge, demonstrating the adequacy of infrastructures and the coordinative capacity of multiple actors (Sonnenwald 2007).
At the social level, this phenomenon has given rise to a reassessment of human resources and the links established among these "actors", who constitute the basis of the social-scientific capital of institutions and countries. Such a notion of capital is much more than the sum of knowledge and skills (or know-how) of the individual researchers and the capacity of each to generate and divulge products of knowledge (Bozeman 2005).
At the political level, governments and funding agencies express the need to instigate evaluation of scientific activities and collaboration at all levels and in all productive sectors. Together with the traditional instruments of supporting research (that is, competitive financing of R&D projects), new policies and programs are destined to promote mobility and enhance lasting associations among actors as a means of increasing scientific excellence, visibility and the international reputation of countries as they divulge and exchange knowledge and innovation (Chinchilla-Rodríguez et al. 2008).
The literature offers many examples of scientific collaboration at the macro level (Wagner 2005; Olmeda-Gómez et al. 2008; Chinchilla-Rodríguez et al. 2010; in press 2012), whereas analysis of co-authorship at the micro level is not very common, possibly due to the complexity of retrieving and standardizing the data (Newman 2004). However, such studies are increasingly relevant, especially at the level of research group, as they constitute the smallest unit able to characterize the structure and dynamics of the research process carried out by institutions (Zulueta et al. 1999) and to analyse them via advanced citation studies (Van Raan 2000; Moed 2005). Considering the growing importance of networks in academia (Ziman 1996), such knowledge is assumed to be useful for orienting or making decisions regarding the assignment of resources and incentives, optimising the use of available infrastructures, favouring the integration of researchers in to existing groups, and thereby increasing the potential of individual capacities as well as those of the scientific institutions involved.
Defining research groups
Cohen (1991), Zulueta et al. (1999) and Perianes-Rodríguez et al. (2010) highlight the absence of an agreed criterion for defining a research group. The members of a research group could be all the persons who belong to the same department or research centre, or the participants on a given research project, or the co-authors of scientific publications, for example. At any rate, the identification or delimitation of groups should reflect how they are conceived or defined. If we accept the conception of a research group as a collective of scientists who collaborate on the approach to and development of a line of research, sharing material and economic resources (Zulueta et al. 1999), the definitive criterion could lie in the joint participation of researchers in the projects. If the group is defined in terms of the publications signed in collaboration (Perianes-Rodríguez et al. 2010), then co-authorships would be the best criterion. However, if we understand the research group to be a set of persons joining forces to carry out research on a given topic, formulating one or several problems of interest, tracing a strategic mid- or long-term work plan and producing further knowledge of a given matter (Colciencias 2006), then the identification and analysis of research groups is more complex and must be done from at least two dimensions, corresponding with the key moments of the research process: the input (represented by the research projects) and the output (determined by the co-authorship of scientific publications). Whereas some studies explore the network of collaboration from the perspective of programmes and projects (Cabo 1997), most recognise groups on the basis of co-authorship (Barabási et al. 2001; Newman 2001; Sanz Casado et al. 2004; Perianes-Rodríguez 2007; Gaete-Fiscella and Vázquez 2008; Herrero-Solana and Moya-Anegón 2009; Vargas-Quesada et al. 2010).
Cohen (1991), was one of the first authors to underline a need for analyses combining both perspectives (-input and output-) when analysing the relationship between the size and the age of research groups and their scientific productivity. More recently, van den Besselaar and Leydesdorff (2009) analysed the relationship between peer review decisions in the accreditation of new projects presented to the Netherlands Economic and Social Science Research Council and the previous appraisal of applicants in terms of their publications and citations, without arriving at any correlation between the two factors. Braam and van den Besselaar (2010) tackle questions about the management and life cycles of research groups: 'what kind of measures taken by research management and policy-makers may be effective in influencing the development of a research group' and 'to what extent may such measures have unintended effects on group development and performance?'.
Funding and evaluation measures have effects documented in studies that point to a certain distortion of the system (Sanz Menéndez 2001; Moed 2008; Perianes-Rodríguez 2009). Within the framework of scientific policy, the criteria used by funding agencies and academic institutions when evaluating scientific activities are not always clear. In forming research groups, incentivating mobility (domestic and international collaboration, interdisciplinarity, etc.) is required for accrediting R&D Projects (input); yet little is known about how these groups translate into research results through publication in co-authorship (output). An analysis of the correspondence between inputs and outputs can shed light on the design of strategies and trajectories throughout the life cycle of research groups. It can also provide usefull information for designing cooperation policies, accrediting new projects, and promoting individual scientists and/or research groups
Objectives and research questions
The overall objective of our research is to provide a new methodological approach for the longitudinal analysis of the configuration and dynamics of research groups, by means of a comparative input/output perspective, combining bibliometric and social network techniques.
The underlying assumption is that input groups are defined by the joint participation of researchers on a research project, while output groups are determined on the basis of co-authorship of publications. From this perspective, the identification of input groups presents no real problem, as all the actors who participate in a common project are mutually connected. But the delimitation of output groups is not quite so simple. Co-authorship is not the only result of joint activity in the framework of a research project, and moreover, it is unlikely that publications are actually co-authored by all the integral members of a project. Hence, the proposed methodology aims to provide a strategy for delimiting output groups that will facilitate their comparison with the input groups as previously defined. This strategy entails a longitudinal perspective, interpreting the individual careers and group yields over time.
Meanwhile, the influence wielded by researchers who put to together these groups (by which we mean their role in connection, intermediation, cohesion, etc.) may not correspond to their professional or academic category inside or beyond the institutions they ar related to (Gaete-Fiscella and Vázquez 2008). The thematic specialization of actors can likewise determine the disciplinary profile of the group, as can the researches' capacity for establishing intra- and inter-institutional relations, or national and international projection. All these elements can be influential when evaluating the popularity and prestige of researchers and research groups (Perianes-Rodríguezet al. 2009), or when adopting strategies for the design of collaborative networks.
Against this background, we hold that identifying different strategies in the design of input/output groups in relation to the academic or professional category of the actors, their institutional pertinence, geographic origin or disciplinary profile is a useful contribution made effective through the proposed methodological approach.
The study intends to address questions such as: Are the groups participating in projects (input) and groups publishing and co-authoring papers (output) the same? Does the definition of input or output groups obey a certain institutional structure, or is there some strategy related to extramural collaboration? When interdisciplinary groups exist, what motivates their configuration? Is such a group rooted in the input? Is there a relationship between the makeup of input groups and that of output groups? And if so, what is the role of the actors at those two key points in the research process? How have individual and group trends evolved over time?
In order to answer these questions and test the proposed methodology, we studied research groups at the Departamento de Bibliotecología (DHUBI) of the Universidad Nacional de La Plata, Argentina, for the period 2000-2009.
Material and methods
Data source
The data source was the resumés (or curricula vitae (CVs)) of the current research professors of the Departamento de Bibliotecología (DHUBI), Universidad Nacional de La Plata, Argentina. At a later date we included researchers associated with them through projects or publications within the period 2000-2009. The choice of source is justified in that these CVs represent the academic career of the researchers as well as their scientific backgrounds, and are requiered documents when requesting funding for new research projects or divulging the results of research efforts (Cañibano and Bozeman 2009).
Data gathering and processing
Having gathered the CVs of the research professors, we extracted and uploaded into a relational database (elaborated ad hoc) all data on projects and publications within the period 2000-2009. Moreover, we consulted the institutional registers of research projects in order to complete the missing data and, when necessary, we standardised researchers' names both for projects and for publications. A total of 17 projects gave rise to 146 publications (52 journal articles and 94 conference proceedings), produced by 77 authors, including those involved in single authorship and co-authorship. The mean co-authorship index was 2.4, with 60% of the publications involving collaboration.
The projects studied had been assigned two to four years for development. For this reason we established periods of three years for exploring networks. Hence, three time segments were defined for input:- 2000-2002, 2003-2005 and 2006-2008; the periods 2001-2003, 2004-2006, and 2007-2009 were the timeframes for output. As established in previous studies (Borner et al. 2005), our temporal window for output did not coincide with that of input. The reason is twofold: 1) output data should be gathered one year after the initiation of the project, as it is unlikely to produce publications within the first year; and 2) adding one year after completion of the project accounts approximately for the delay involved in editorial review and final publication. Of course, project periods are often longer (e.g., a Ph.D.), and output necessarily lags behind; this is not limited to, the field under consideration (library and information science). We discuss this matter later on.
In terms of publications, we considered articles and conference proceedings as the only types of documents with optimal presence. They accumulate 85% of the total library and information science production specially in Argentina (Miguel 2009; Chinchilla-Rodríguez et al. 2012), but also in other representative cases of library and information science (Shaw and Vaughan 2008). Our reflections are therefore fully focused on the kind of results expected in R&D projects.
Each of the actors was associated with an identifier of the project or publication with which they had been associated. We added, data about their institutional origin, professional category and thematic area, and noted their academic position or situation within the department for the intra-institutional proyecs; plus their institutional origin and disciplinary profile for the inter-institutional proyects. A total of six mutually exclusive categories could thereby be established:
- Departamento de Bibliotecología (DHUBI) researcher (R-DHUBI);
- DHUBI graduate student or undergraduate (UGS-DHUBI);
- Library and information science (LIS) researchers from other institutions in the country (LIS-ROIC);
- Library and information science (LIS) researchers from foreign institutions (LIS-RFI);
- Researchers of other disciplines in Argentinian institutions (ODAIR), and
- Researchers of other disciplines from foreign institutions (ODFIR).
The creation of these categories is arbitrary and responds to an ad hoc classification to detect professional category (1 and 2), intra-institutional collaboration (1 and 2), national and international collaboration (3, 4, 5 and 6) and interdisciplinarity (5 and 6). Of course, other kinds of information such as gender, age, mobility, academic degree, etc. could be added to analyse groups according to their objectives, depending on the scope of study.
Generation of matrices
On the basis of the data obtained, the frequencies of co-participation of each actor in the projects and co-authorship of publications were calculated. Then we obtained the frequencies of co-occurrence for both elements and generated symmetric matrices, where the actors headed the rows and columns, producing non-directional reciprocal coincidences. As suggested by other authors (Perianes-Rodríguez et al. 2009), the absolute values for co-occurrence frequencies were used and the values of the main diagonals were eliminated. In this sense, several authors postulate that the incorporation of normalisation measures will produce distortions when distributing information, with the raw data proving valid and sufficient basis for their transformation into distances (Leydesdorff and Vaughan 2006; White 2003).
Structural analysis and calculation of indicators
To study the attributions of the nodes in determining actor's roles, we used classical measures of network centrality, namely degree, betweenness and closeness (Wasserman and Faust 1999). Degree is the number of nodes with which a given node in the network is directly connected. Although degree is the simplest indicator of the social capital that a node wields, a high degree does not necessarily mean that a node is determinant in the scientific context in which it participates (Degenne and Forsé 1999; Mrvar 2000; Hanneman and Riddle 2005). Other indicators can more precisely reflect the role of the actors, responding to questions such as: How much control does a given vertex exert over communications between other vertices? The indicator of betweenness measures the extent to which one node is situated within the structure of the network, as a bridge of communication between other nodes (Freeman 1977). A node with high betweenness, even if it has low degree, can carry out a central role in the network; its weight is considerable since, if it disappeared from the network, the group of nodes that it connects would no longer be able to achieve the some importance. When a research group is led by a researcher who largely controls the communications (e.g., senior researcher with two projects, each with different groups of collaborators and co-authors), key decisions depend on this actor. As groups mature, they establish more horizontal relations, above all among the most well-established members, and the betweenness weakens and is shared with other nodes (Mrvar 2000; Sanz-Menéndez 2001). In turn, the closeness of a node represents its capacity to link with other nodes of the network and would answer the question: How many stops do I need to reach another vertex? It is calculated as the sum of the distances to the rest of the nodes. That is, a node with a low sum of distances is closer to the other nodes; it has a greater power of interaction, or of making contacts. In group dynamics, the fact that one has high nearness means it is firmly embedded in the system of communication, implying easy access to resources that will contribute to the development of group activities.
In addition to these relational indicators, we used others that helped us to study the structural properties of networks: density, component analysis and, clustering coefficient, plus hybrid indicators such as popularity index. Density allows us to determine the degree of cohesion that exists among the nodes, revealing whether the network has a thick or thin consistency. In a non-directed network (such as that studied here), this indicator is obtained by relating the number of links (lines) of the network and the total number of links possible (2L/n(n-1)), where L is the number of lines and n is the number of nodes (Wasserman and Faust 1999). Another indicator used is the clustering coefficient, which indicates how dense the relations in the realm of collaboration of a given node are. It indicates the proportion between the number of links in the neighbourhood of a node and the number of links possible in the entire network. This indicator is normalised because aside from taking into account the number of links of the neighbours of each node and the number of links of the whole network, it also considers the maximal degree of the network (Watts and Strogatz 1998). Values close to 1 show a high rate of relationships with collaborators, and also among the collaborators themselves. Values close to 0, meanwhile, indicate that the node is the only link among collaborators (Barábasi 2002). Finally, the popularity index employed here was adopted from Perianes-Rodríguez (2007) CC' (v) x ndoc(v) , where ndoc (v) is the total production of node v in the time period and CC is the clustering coefficient. The clustering coefficient connects the number of documents with the collaboration of the author at hand. Consequently, it is possible to obtain a new measure that allows us to distinguish between two authors with exactly equal figures for production. According to Perianes and collaborators, the more popular author would be that having a more cohesive and visible network of collaboration.
Delimiting the output groups called for revising several techniques of social network analysis methodology with regard to the criteria of cohesion, stability, synergy, etc. We chose the technique of cliques because, based on the criterion of reciprocity and adjacency of the nodes, it allowed us to detect the most complete subgroups, in which all of the nodes were mutually connected. We hold this to constitute the criterion in closest agreement with the groups defined as input groups. Moreover, it serves to identify the parameters of the groups insofar as input and output figures.
Network visualization
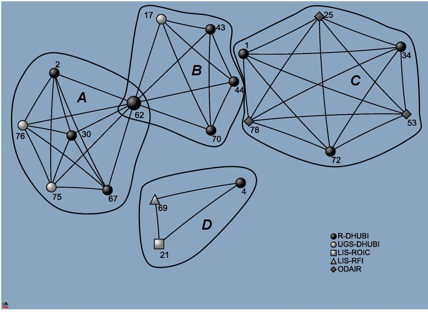
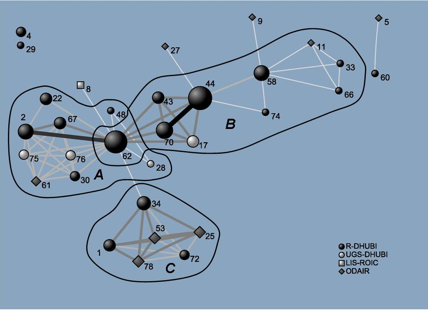
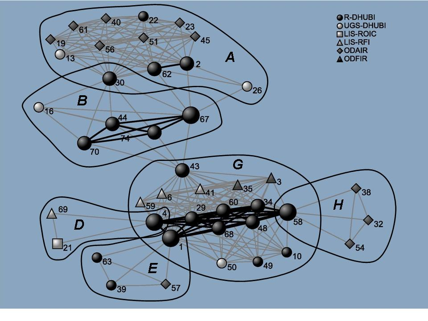
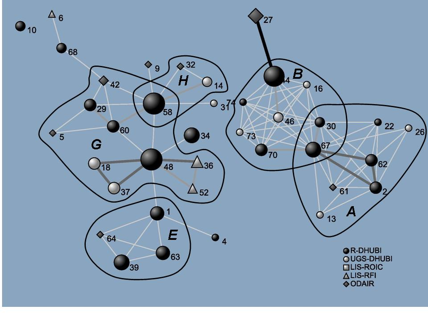
To position the nodes we applied the Kamada-Kawai algorithm (1989), characterised by its ability to assign coordinates to the vertexes while adjusting the distances to a maximum with respect to theoretical distances (Vargas-Quesada et al. 2008). The size of the input nodes reflects the number of projects in which each network actor has participated; the zise of the output network nodes reflects the number o publications. Lines indicate the relations among actors, with the colour (on a scale of grey tones) indicating the intensity of the connection. In the input networks they represent the number of projects entailing joint participation, and in the output networks the number of co-authored publications. In output networks, they can therefore reveal disconnected actors that published in single authorship endeavours (see Figures 2, 4 and 6). Different colours and shapes were used to distinguish the various categories of actors: R-DHUBI, black circle; UGS-DHUBI, white circle; LIS-ROIC, white square; LIS-RFI, white triangle; ODAIR, grey diamond, and ODFIR, grey triangle.
To calculate the indicators and to create the visualization scheme we used the Pajek program (Batagelj and Mrvar 2004), whereas for the clique analysis UCINET was applied (Borgatti et al. 2002). The display was presented in three time periods to offer a general view of the structure and evolution over time of both the input and the output networks.
Finally, the findings were discussed and analysed through interviews with members of the department studied. This allowed us to interpret the strategies followed in the design of the groups and the academic factors that explain the evolution of relations, and also enabled us to check the validity and significance of the proposed methodology.
Results
Owing to the methodological nature of this study, this section only presents examples in our analysis applied to DHUBI in which the methodology actually demonstrated its potential to elucidate group dynamics: that is, delimiting the group, showing its intramural composition and national or international projection, the overall trend of the group and its actors, general features of interactions, multidisciplinary activity and the input-output correspondence between research groups.
Delimiting the groups
In the first period there is not a precise correspondence between the groups of input and those of output. Input has four groups (A, B, C, D, see Figure 1); whereas for output, using the clique technique, we identified just three (Figure 2). The absence of group D is due to the fact that the results of its projects are visualised in the second time period. In terms of network makeup, we see that all of the members of the input groups also appear in their respective groups in the output network. Nonetheless, groups A and B are larger in the output, integrating new members.
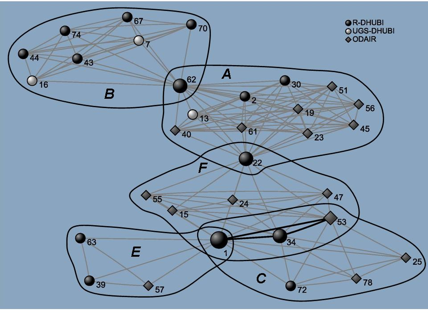
In the second period (Figures 3 and 4) two new groups appear (E and F) in addition to the others, and in general a lesser level of correspondence is seen between output and input (though group B presents complete correspondence, A loses five of its previous thirteen nodes, and gains one new node; group E loses one of the four previous nodes, and adds a new one). What is most remarkable here is that groups C and F are only configured in terms of input, and do not appear in the output display. Group D is unaltered in its composition with respect to the input of the first period.
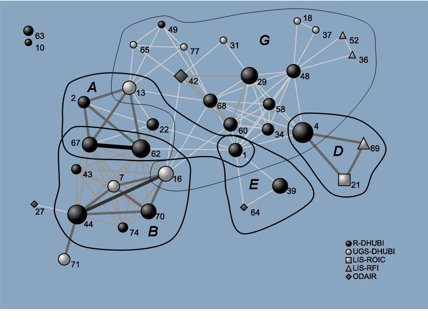
In the networks of the third period (Figures 5 and 6), group B continues to present full input/output correspondence, and groups A and E show exactly the same configuration of absent nodes and new nodes as in the time period before. Groups C and F are not seen in these networks; and we should recall that in the previous period they presented no results. Group D is not seen in the output visualization, possibly because again its results were published at a later date, as in the first period. Group G loses thirteen of its previous seventeen nodes, while gaining six new ones.
Characteristics of the composition and multidisciplinary, national and international projection of the groups
In this case, the group traits are based on set of attributes including academic category, the disciplinary, institutional, and geographic origins of the members, and the information obtained by interviews, which allows us to distinguish strategies in the design of intramural and extramural groups and their evolution. Tables 1 and 2 show the distribution of the actors who make up the input and output groups, revealing a considerable (proportional) weight among the research professors of the Department itself. Yet this noteworthy presence diminishes over time due to a relative increase in the participation of other actors, especially the students and graduates, whose presence doubles in the second period and is maintained in the third. Such an evolution suggests there is an intentional strategy of human resource formation at work.
| Actor's category | 2000-2002 | 2003-2005 | 2006-2008 | |||
|---|---|---|---|---|---|---|
| Actors | % | Actors | % | Actors | % | |
| R-DHUBI | 11 | 57.9 | 14 | 43.8 | 21 | 48.8 |
| UGS-DHUBI | 3 | 15.8 | 3 | 9.4 | 4 | 9.3 |
| LIS-ROIC | 1 | 5.3 | 0 | 0.0 | 1 | 2.3 |
| LIS-RFI | 1 | 5.3 | 0 | 0.0 | 4 | 9.3 |
| ODAIR | 3 | 15.8 | 15 | 46.9 | 11 | 25.6 |
| ODFIR | 0 | 0.0 | 0 | 0.0 | 2 | 4.7 |
| TOTAL | 19 | 100.0 | 32 | 100.0 | 43 | 100.0 |
| Actors' category | 2001-2003 | 2004-2006 | 2007-2009 | |||
|---|---|---|---|---|---|---|
| Actors | % | Actors | % | Actors | % | |
| R-DHUBI | 19 | 59.4 | 20 | 55.6 | 19 | 50.0 |
| UGS-DHUBI | 4 | 12.5 | 9 | 25.0 | 9 | 23.7 |
| LIS-ROIC | 1 | 3.1 | 1 | 2.8 | 0 | 0.0 |
| LIS-RFI | 0 | 0.0 | 3 | 8.3 | 3 | 7.9 |
| ODAIR | 8 | 25.0 | 3 | 8.3 | 7 | 18.4 |
| ODFIR | 0 | 0.0 | 0 | 0.0 | 0 | 0.0 |
| TOTAL | 32 | 100.0 | 36 | 100.0 | 38 | 100.0 |
Tables 3 and 4 also shed some light on the overall disciplinary profile of the groups and their national and international profile. Focusing on this aspect we discover different design strategies. Thus, for instance, we detect a strategy of group configuration that is quite endogamic, with a greater presence of persons coming from the academic department studied (group B); although later evolution shows more receptiveness towards extramural collaboration with other researchers in the same field of study. Other groups reflect a strategic search for associates with geographic proximity (especially from the same country) but from different disciplines, giving rise to research with a strong interdisciplinary nature (both subject matter and methodology). Such is the case of groups A, C, F, H. Notwithstanding, group C shows an ephemeral existence, while A and F are interdisciplinary in their input, but not in the coauthorship of publications. The newest group (H) is seen in the third period to be the only one that maintains interdisciplinary collaboration in input as well as output, though its evolution is unknown. Finally, groups D and G are the only ones to achieve an international profile in their collaborative relations in both input and output. Group G is furthermore seen to have a strategic design unlike all the others. This group appeared in the outputs during the second period, to claim a place in both the input and output in the third period.
Tables 3 and 4 also shed some light on the overall disciplinary profileof the groups and their national and international profile. Focusing on this aspect we discover different design strategies. Thus, for instance, we detect a strategy of group configuration that is quite endogamic, with a greater presence of persons coming from the academic department studied (group B); although later evolution shows more receptiveness towards extramural collaboration with other researchers in the same field of study. Other groups reflect a strategic search for associates with geographic proximity (especially from the same country) but from different disciplines, giving rise to research with a strong interdisciplinary nature (both subject matter and methodology). Such is the case of groups A, C, F, H. Notwithstanding, group C shows an ephemeral existence, while A and F are interdisciplinary in their input, but not in the coauthorship of publications. The newest group (H) is seen in the third period to be the only one that maintains interdisciplinary collaboration in input as well as output, though its evolution is unknown. Finally, groups D and G are the only ones to achieve an international profile in their collaborative relations in both input and output. Group G is furthermore seen to have a strategic design unlike all the others. This group appeared in the outputs during the second period, to claim a place in both the input and output in the third period.
| 2000-2002 | 2003-2005 | 2006-2008 | |||||||||||||
|---|---|---|---|---|---|---|---|---|---|---|---|---|---|---|---|
| A | B | C | D | A | B | C | E | F | A | B | D | E | G | H | |
| Total actors | 6 | 5 | 6 | 3 | 12 | 8 | 6 | 4 | 8 | 14 | 6 | 3 | 4 | 15 | 3 |
| % R-DHUBI | 66.7 | 80.0 | 50.0 | 33.3 | 33.3 | 62.5 | 50.0 | 75.0 | 8 | 35.7 | 83.3 | 33.3 | 75.0 | 66.7 | 33.3 |
| % UGS DHUBI | 33.3 | 20.0 | - | - | 8.3 | 37.5 | - | 25.0 | 37.5 | 14.3 | 16.7 | - | - | 6.7 | 33.3 |
| % LIS-ROIC | - | - | - | 33.3 | - | - | - | - | - | - | - | 33.3 | - | - | - |
| % LIS-RFI | - | - | - | 33.3 | - | - | - | - | 62.5 | - | - | 33.3 | - | 20.0 | - |
| % ODAIR | - | - | 50.0 | - | 58.3 | - | 50.0 | - | - | 50.0 | - | - | 25.0 | - | 33.3 |
| % ODFIR | - | - | - | - | - | - | - | - | - | - | - | - | - | 6.7 | - |
| Degree | 0.28 | 0.22 | 0.28 | 0.11 | 0.35 | 0.23 | 0.24 | 0.97 | 0.27 | 0.45 | 0.24 | 0.71 | 0.12 | 0.48 | 0.12 |
| Betweeness | 0.00 | 0.00 | 0.00 | 0.00 | 0.00 | 0.00 | 0.00 | 0.00 | 0.00 | 0.01 | 0.00 | 0.00 | 0.00 | 0.12 | 0.00 |
| Closeness | 0.36 | 0.34 | 0.32 | 0.16 | 0.54 | 0.42 | 0.45 | 0.37 | 0.51 | 0.45 | 0.33 | 0.32 | 0.32 | 0.46 | 0.32 |
| Clustering Coeff. | 0.28 | 0.13 | 0.56 | 0.22 | 0.30 | 0.09 | 0.12 | 0.01 | 0.12 | 0.42 | 0.02 | 0.00 | 0.00 | 0.47 | 0.00 |
| Nproy | 1 | 1 | 1 | 1 | 1 | 1 | 2 | 1 | 2 | 1 | 2 | 1 | 1 | 2 | 1 |
| Popularity | 0.28 | 0.13 | 0.56 | 0.22 | 0.30 | 0.09 | 0.20 | 0.01 | 0.20 | 0.42 | 0.04 | 0.00 | 0.00 | 0.41 | 0.00 |
| 2001-2003 | 2004-2006 | 2007-2009 | |||||||||||
|---|---|---|---|---|---|---|---|---|---|---|---|---|---|
| A | B | C | A | B | D | E | G | A | B | E | G | H | |
| Total actors | 10 | 10 | 6 | 6 | 8 | 3 | 2 | 18 | 8 | 8 | 4 | 11 | 3 |
| % R-DHUBI | 60.0 | 80.0 | 50.0 | 83.3 | 75.0 | 33.3 | 66.7 | 50.0 | 62.5 | 62.5 | 75.0 | 45.5 | 33.3 |
| % UGS DHUBI | 30.0 | 10.0 | - | 16.7 | 25.0 | - | - | 27.8 | 25.0 | 37.5 | 25.0 | 18.2 | 33.3 |
| % LIS-ROIC | - | - | - | - | - | 33.3 | - | - | - | - | - | - | - |
| % LIS-RFI | - | - | - | - | - | 33.3 | - | 11.1 | - | - | - | 18.2 | - |
| % ODAIR | 10.0 | 10.0 | 50.0 | - | - | - | 33.3 | 11.1 | 12.5 | - | - | 18.2 | 33.3 |
| % ODFIR | - | - | - | - | - | - | - | - | - | - | - | - | - |
| Degree | 0.19 | 0.13 | 0.16 | 0.26 | 0.20 | 0.57 | 0.57 | 0.19 | 0.24 | 0.30 | 0.15 | 0.19 | 0.11 |
| Betweeness | 0.00 | 0.00 | 0.00 | 0.46 | 0.00 | 0.00 | 0.00 | 0.25 | 0.02 | 0.00 | 0.00 | 0.06 | 0.00 |
| Closeness | 0.37 | 0.37 | 0.29 | 0.45 | 0.38 | 0.31 | 0.35 | 0.43 | 0.24 | 0.26 | 0.18 | 0.23 | 0.21 |
| Clustering Coeff. | 0.19 | 0.09 | 0.30 | 0.17 | 0.26 | 0.01 | 0.00 | 0.13 | 0.14 | 0.27 | 0.14 | 0.10 | 0.01 |
| Ndoc Journal | 1 | 1 | 0 | 1 | 1 | 1 | 2 | 1 | 1 | 1 | 1 | 1 | 0 |
| Ndoc Proceed. | 1 | 2 | 3 | 4 | 2 | 2 | 2 | 3 | 3 | 2 | 2 | 3 | 3 |
| Ndoc Total | 2 | 3 | 3 | 4 | 5 | 3 | 4 | 3 | 2 | 2 | 4 | 3 | 2 |
| Popularity | 0.38 | 0.12 | 0.90 | 0.66 | 1.20 | 0.03 | 0.00 | 0.53 | 0.32 | 0.68 | 0.46 | 0.30 | 0.02 |
Structural analysis: cohesion and centralization
The indicators already discussed are complemented by those in Table 5 which give more precise data about the professional trends of groups and actors. We observe that, from a structural standpoint, the number of actors increases more in input groups (12, 39 and 43 respectively) than output groups (32, 36 and 38) in each period analysed. We also see how the average degree of the input networks increases over time, with a rise in the number of links among the nodes. In the output networks, this measure remains more or less stable, but below the value of the input networks which greatly surpass it in all three periods because not all the actors who participate in a project also publish works in collaboration. Meanwhile, the capacity of connection of the nodes (centrality of degree) is close to 0.30 in all three series in both networks. This low connection among the nodes means that only a few are responsible for binding together all the relationships. These groups are structured hierarchically as in the scale-free model defined by Moody (2004)where prominent scientists are responsible for connecting the network. This model is organized on the principle of preferential attachment (the Matthew effect). Scientists who are highly visible in their field mainly through publications are preferred as co-authors and leaders of groups. Similarly, the clustering coefficient is surprisingly low in all periods for both input and output. Despite a drop during the second period, it is stronger in the input than in the output networks. This is to be expected, as all the participants in a project are indeed interrelated through their activity, but might not participate in co-authoring subsequent publications.
| 2000-2002 | 2001-2003 | 2003-2005 | 2 004-2006 | 2006-2008 | 2007-2009 | |
|---|---|---|---|---|---|---|
| Input | Output | Input | Output | Input | Output | |
| Number of nodes | 19 | 32 | 32 | 36 | 43 | 38 |
| Density | 0.45 | 0.16 | 0.44 | 0.19 | 0.34 | 0.13 |
| Average degree | 8.10 | 5.19 | 13.87 | 6.67 | 14.32 | 4.84 |
| Degree | 0.28 | 0.38 | 0.32 | 0.22 | 0.32 | 0.25 |
| Betweenness | 0.13 | 0.54 | 0.48 | 0.18 | 0.48 | 0.2 |
| Closeness | - | - | 0.55 | - | 0.46 | - |
| Number of components | 3 | 4 | 1 | 3 | 1 | 3 |
| Main component size | 10 | 28 | 32 | 34 | 43 | 22 |
| Main component size (%) | 53% | 88% | 100% | 94% | 100% | 58% |
| Secondary component size | 6 | 2 | - | 1 | - | 15 |
| Secondary component size (%) | 32% | 6% | - | 3% | - | 39% |
| Clustering Coefficient | 0.36 | 0.12 | 0.19 | 0.14 | 0.34 | 0.13 |
We can observe on the one hand that the centrality and popularity of the actors in input terms is not necessarily reflected in the output (not all those leading projects stand out as co-authors). This is very evident for group A, which started with a single leader (actor 62), a great number of links (degree) and strong betweenness and popularity during the first two periods. The leader then began to resemble the rest of the members; at the same time three new actors began to stand out, sharing the leadership role and, at the end of the period, harvesting the highest values in popularity. This could be understood as a demonstration of the maturity of a research group, where more horizontal relations are established as betweenness tends to spread out among the different nodes. But expert opinion reveals that the actor who was once leader and who motivated the group in the last period, was in fact in the final stretch of their academic career. Finally, we should point out that this group conducts research mainly on Reference and Information Users.
A closer look at group B will reveal its strong links with A, both in input and output. They share a number of members, most notably actor 62 who was the leader of group A in its early years. Group B is the most cohesive one, establishing strong connections among the participants; all of them have high clustering coefficient values. However, we can see that over time the group loses centrality and popularity in its input, and it presents a rather erratic output behaviour, with the most influential nodes (for example, actor 44) being the ones who concentrate the greatest potential. This may have some bearing on the endogamous tendency of the group, with nearly all its members being DHUBI research professors or graduate students from this department. This group is characterised by a systematic replacement of actors A nucleus of DHUBI researchers is stable over the years in both input and output, while the graduate students change: they appear in the input-output of a specific time period and then disappear, making evident their participation in certain projects, while also demonstrating that not all graduate students who begin to collaborate in research will later evolve to become part of the core of the group. According to our interviews, this is due to a strong power to attract students, research fellows and PhD students studing under the direction of a leader. Although this is a strong point for the group within the department, it can also be perceived as a weakness in that it shows the difficulty of retaining these human resources. There are obviously specialisations in information processing, which is the focus of group B.
Group C, meanwhile, is a good example of an ephemeral team, its short-lived existence limited to presence in the input and output of the first period and input of the second. Their research is terminology, an interdisciplinary field, which would explain the participation of researchers from language studies (three DHUBI and three Argentinian researchers are from other disciplines). Throughout its existence all the members were present in both input and output networks, with a high level of attraction and cohesion among themselves. In the second period of the input, a leader arises (actor 1), with greater degree, betweenness and popularity, although this is not reflected in the productivity or output of the group. The group then disappears, and four of its members have no presence in later networks. The other two actors (1 and 34) apparently join other groups. This is the pattern of the group that does not manage to consolidate itself, and exists only through the objectives of a particular project and time period; then, the component members who wish to further their academic career must hope to find a place in other groups. The dynamics of group F, dedicated to the publishing industry, are similar.
We note the slow pace in publication of group D's research results, which in turn suggests the need to broaden the time window for output analysis. The members participate in the input of the first and last periods, and in the output of the second period. This small group maintains its composition and is highly cohesive. Another significant trait of its evolution is that, despite being somewhat isolated in its early stages, it eventually joined forces with of group G's network by means of a node (4) with high popularity and betweenness capacity connecting both groups. The specialisation of this group is metric studies of information.
Group E, which is small in size, appears from the second period onward and is dedicated to information policy and communication media. Its nodes exhibit a limited potential in terms of establishing new communication with the rest of the network, presenting low centrality of degree and little betweenness. Here, actor 1 is seen to wield a capacity of interconnection and control, and is integrated in various groups, most likely due to an academic category enabling him/her to direct projects. This team gains greater internal cohesion over time while maintaining its level of production and harvesting high levels of popularity. We see no close correspondence between the input and output composition of the group.
Group G is the most heterogeneous one. It presents a nucleus and several subgroups with actors from other categories. In terms of output, this group features a noteworthy number of cliques with various actors in common joined by the thematic axis that goes through it, explaining the existence of the different connected subgroups. The subject area is evaluation of libraries, of collections, of science, etc. Moreover, the number of actors is clearly on the rise and two actors are highlighted by their popularity and betweenness capacity (see nodes 48 and 58). These are young R-DHUBI researchers with training in Master and PhD studies abroad who secured international contacts for the group in both input and output.
Finally, group H appears in the last period of study, and is seen to be small. There is no input-output correspondence, but its interdisciplinary character is revealed by an actor (58) that is linked with members of other academic departments.
Discussion
On the composition and dynamics of the groups
The results show that the configurations of groups in the input and the output phases do not necessarily coincide. Some groups are more structured than others, and some are very flexible in terms of their correspondence and dynamics. Some research groups disappear while others persist over time. The manifest permanence of some groups and the ephemeral nature of others are all indicators that research groups follow different dynamics, despite being governed by the same patterns of project accreditation (input) and evaluation of results (output).
The methodology used also makes it possible to discover information about trends of individual actors and their roles at different points in their academic careers. In general, groups present a pattern of replacement of actors and permanence of leaders who maintain their identity over time. From the data collected, it is possible to distinguish three different situations. The groups who persistently maintain their identity include researchers who fulfil a function of directing projects and some R-DHUBIs directly linked with them; whereas other members have a sporadic participation, linked to a certain period or project. This is the case for students or graduate students, even PhD students, and of researchers from other disciplines, who seem to be more related with specific projects than with stable groups per se over time. Once their work and publication in co-authorship with the leader of the group are over, they cease to take part in the group dynamics. Finally, the appearance of new groups can be explained by the incorporation of new professors with research functions within the department, giving rise to fresh ideas or new lines of research and attracting new actors, with some rotation of actors having related interests.
Deserving mention is the fact that in some cases we find groups formed through output and then firmly established in their input, appearing in a research project. This means that inception is not always a matter of building up a pool of suitable researchers in order to obtain project accreditation, but may be traced to other motives. According to the interviews, these groups work in collaboration owing to affinity with the research topic. This leads them to present works together, and then to jointly submit project applications.
On the other hand, there is a gradual increase in the overall number of actors, more acute in input than in output, and some variation in the presence of different categories of actors. In output, we see considerable variation in the professional category with a noteworthy influx of students and graduates, along with a marked decline in participation by researchers from other disciplines.
In the output networks, it is very evident how the weight of the actors in terms of production changes over time. The size of the nodes reveals that the ones who produced more publications in the first period (44 and 62) gave way to other protagonists (nodes 48 and 58) who were in the middle years of their research careers and had a faster pace of production. We perceive different phases of publication activity: from newcomers to transient and continuing authors to late-career researchers. This is perhaps the essence of research group dynamics: the collective transfer of knowledge, along with personal experience and know-how acquired over the years, to future generations of researchers. According to Braam and Van den Besselaar (2010), this fact implies that the groups in the start-up phase of their development will have a more individual performances than stabilised groups. This phase-dependency facet of performance is commonly overlooked in evaluation exercises.
Strategies of group design
The eight groups identified here are of different sizes and makeup, and follow different strategies in their configuration: some attract young researchers, some are more interdisciplinary, and some have a notable international profile. Such differences may in part be influenced by the resources available, yet also by the academic profiles of the researchers. Research groups are often active in several domains, involving different types of activities, products and contacts. This leads to profiles that reflect the strategic mission of a group (Larédo and Mustar 2000). In this case we found that groups who approach interdisciplinary topics tend to include researchers from different subject areas, in contrast to research groups who exclusively focus on library and information science. However, deserving mention in this sense is the marked interdisciplinarity seen in the configuration of input groups versus its absence in output. According to our interviews, in the early years, the presence of researchers from other disciplines in input was a strategy adopted to improve the accreditation of projects. In later years, however, integrating researchers from other areas was due to the interdisciplinary nature of the research itself.
Two variants of institutional origin can be distinguished from our findings. Some groups are endogamic, tracing borders around their own departments, while others more openly associate with external library and information science researchers, either on the national or international front. Although the indicators applied here do not allow us to clearly affirm that these factors impact on group productivity, they do appear to have some repercussions for group prestige, measured by the citations of published work. In fact, there are studies that point out how the presence of the endogamy model (small-world model in co-authorship) is an obstacle to internationalisation. That is, the authors within this model publish less in international journals than authors outside this model (Mali et al. 2010). This practice eventually means lesser productivity and visibility in the academic community and does not encourage the mobility of the researchers. Future studies will allow us to explore the influence of institutional origins in more detail.
Professional category would also seem to be an important factor for group design, fundamentally because only a few R-DHUBIs can direct research projects. For this reason, they appear as central actors. However, a better look at the different time periods studied shows a lack of consistency in the presence of the most influential professors in the input and output groups. This finding could be attributed to the fact that some groups stem from occasional co-authorship but then evolve towards steadier participation in joint research projects. Group G appears to have followed this path, as in its early stages there was no actor with the capacity to accredit projects. Moreover, the professors have a central or key role in the transfer and exchange of information over the network. This is above all true in the case of input, since the persons who actually apply for project funding are normally well-consolidated researchers, with impressive CVs, who do not wish to risk rejection of the proposed funding or project.
On group cohesion
Our findings signal that there is less cohesion in the output networks than in the input networks, which is to be expected, since relationships established through joint participation on a project would imply interconnection of all the actors. With co-authorship, some collaboration is expected to take place among those joining forces on a single common project, but in practice this is not always true. We must bear in mind the division of work and the specialisation of the members who may participate in different stages of a project, leading to different tangible results produced by their particular tasks. Furthermore, it is important to remember that not all the results of a project necessarily become part of a publication or presentation. This limitation must be addressed and assumed when we adopt co-authorship as a unit of analysis of output.
Granted, one aspect revealed by our findings is the existence of collaborative links that go beyond the participation in formal research projects. The activities of research and collaboration tend to spill beyond the framework of accredited programmes and research projects, and can take place, in the core of the academic arena: occasional events such as applying for chairmanship, preparing graduate theses and suchlike would call for interaction between and among professors and researchers.
One key aspect of research group dynamics is the capacity to train departmental members and attract highly qualified foreign researchers so as to obtain resources via mobility and/or competitive projects at the international level. This is related to the idea of 'breeding research', with the capacity to create programmes of mobility, both internal and external, in order to encourage the international training of junior researchers and establish permanent contacts and interchanges between senior researchers. Such relationships will produce higher international profile and visibility. Given the evidence of constrained resources at a global level, providing information about optimal practices can be helpful when financing international projects or taking on staff, trained internally or externally, to optimise departmental resources via collaboration.
Finally, we must again point out that the visualisation of the three periods shown here demonstrates, especially in terms of output, how the emergence of the studied field begins with disconnected or weakly connected nodes that slowly join to form a great number of connected clusters, and eventually become consolidated into a vast network that can clearly be differentiated in view of the thematic specialisation of the component members. The methodology serves to illustrate the extent to which the configuration of input groups is seen reflected in the output groups. It further serves to compare the positions and relations of members, providing for a dual analytical perspective over time.
Conclusions
Given the complexity of the phenomenon studied (research group dynamics) the first thing we must clarify rather than conclude is that our proposal cannot account for those social aspects of knowledge transfer that also exert some effect on the overall process of generating knowledge. That is, we necessarily focus on quantifiable results and information extracted by interviews of group members about the most influential academic aspects for research group composition and dynamics; and accordingly, the contribution lies in the dual perspective of the approach, with the comparison of two key moments in the research process.
In short, the results show that regardless of size, profile, affiliation or professional category, there is no precise correspondence between input-output groups. These two facets of research obey different configuration strategies, and the groups involved have different dynamics, despite sharing rules of project accreditation (input) and evaluation of performance (output). In some cases the strategies are related to training of researchers, in some with an endogamic tendency, in others with geographic and thematic proximity. Although most groups are firmly established in input, this is not necessarily so, since there are groups that first emerge through their output of co-authored publications.
The formation of groups is generally not determined by institutional structure, even though most members, both in input and output, belonged to the academic department we studied. The group leaders are those with the best professional knowledge and skills to address specific projects, and they maintain the group identity during its life cycle, despite a ongoing change of actors. However, the positions and relations of these actors do not coincide in input and output in all cases.
From a methodological standpoint, our proposed contribution to the field of scientometrics consists of a new approach for studying the configuration and dynamics of research groups, through a comparative perspective in terms of the projects funded (input) and publication through co-authorship (output). Furthermore, the present study shows that the complementary potential of bibliometric and relational analysis can be a useful tool for bringing to light patterns that govern the configuration and dynamics of research groups. This methodology could be used to analyse groups of other scientific domains at the micro level in any similar institution.
Regarding the implications for research policy, as some authors have suggested (Moed 2008), the financing agencies should periodically revise the systems of evaluation that oversee each discipline. We believe that the methodology applied in this study can aid in making decisions about the assignment of resources and incentives, optimising the use of available infrastructures, and favouring the integration of researchers in already existing groups.
We should bear in mind that the ability of any actor to join a collaboration network depends on their attractiveness as a partner, as well as the individual interests of researchers seeking resources and reputation. Thus, collaboration is characterised by strong pragmatism and a high degree of self-organisation. For this reason, collaboration policies need to be coordinated with domestic efforts to increase research and development spending and build capabilities. As Wagner and Leydesdorff (2005) point out, links among government and research institutions should be fortified, and individual researchers should be made stakeholders in the process of decision-making about collaboration investment. Any review should take into account the indicators habitually used (number of publications and journal impact), and might also incorporate new criteria, methods or indicators, such as the ones presented in this study. The proposed methodology makes it possible to distinguish individual research profiles: not just the figures on publications and impact, but also the capacity for establishing contacts, configuring research teams, and publishing the results of joint efforts. Aside from possible applications for the evaluation, promotion and funding of research groups by agencies, our proposal may be useful to provide incentives for researchers toward training and mobility, for the establishment of awards or merits, or to promote extramural collaboration.
Some aspects of our study constitute limitations and must be addressed to improve future results. The availability of data resources and the very substantial investment in time, given the detail and type of information needed (the analysis of CVs) are limitations that need to be considered. In this regard, the solution adopted by most academic institutions is to design and implement Current Research Information Systems (CRIS) to have updated information about the activities of their researchers. Aside from serving as a tool for the management of scientific information, these systems can become a valuable resource for analysing research performance. The data should be complemented with other bibliographic resources (Scopus or Web of Science) to analyse additional indicators, such as citations of papers, to establish to what extent group design enhances the visibility of results. Finally, we suggest that institutions include a listing of comprehensive and standardised data (both input and output) in their annual reports. This information will help the institution to manage funding and staff.
Another obstacle is defining, a priori, the temporal delimitation of the groups. This depends on the dates of applications and requests for funding of different projects and the average years of their development. The timeframe is therefore specific to each study. Furthermore, it is not possible to establish a fixed window of years to analyse the results of projects in terms of publications, because groups have different paces, number of components, profiles of specialization, etc. This paper looks at just one case to test out the methodology. Ideally, further initiatives will tackle long life cycles to produce more consolidated results.
Finally, there is a need to further explore, in other thematic areas or institutions, the dynamics of network structures and support our interpretations with scientometrics, relational indicators, and hybrid indicators. This further analysis will allow us to generalise and theorise about the implications of all such studies in the context of managing scientific or technological activities and establishing policies to override the institutions concerned.
Acknowledgements
The authors thank María Benavent Pérez, Carlos Olmeda Gómez, Antonio Perianes Rodríguez, Benjamín Vargas Quesada for corrections and suggestions, Elena Castro Martínez for advice about the incorporation of interviews, and Jean Sanders for translating and editing the text and Amanda Cossham for copyediting. We also acknowledge the useful comments of reviewers on an earlier version of this text. This study was made possible in part by funding from the CSIC under the project "Generación de herramientas cienciométricas para el análisis de la colaboración científica" (Proyecto Intramural CSIC 200810I210).
About the authors
Sandra Miguel is Full Professor in the Department of
Library an Information Science, University of La Plata, Argentina. She is
member of the SCImago Research GroupShe can be contacted at: sandra@fcnym.unlp.edu.ar
Zaida Chinchilla-Rodríguez has been a member of the
SCImago Research Group since its inception, she has a tenured position as
Researcher at Institute of Public Goods and Policies (IPP) of Spanish
Research Council (CSIC) in Madrid.She can be contacted at: zaida.chinchilla@cchs.csic.es
Claudia González is Associate Professor in the
Department of Library and Information Science, University of La Plata,
Argentina. She can be contacted at: cgonzalez@fahce.unlp.edu.ar
Félix de Moya Anegón is the main researcher
of the SCImago Research Group. He is Full Professor at the Institute of
Public Goods and Policies (IPP) of Spanish Research Council (CSIC) in
Madrid. He can be contacted at: felix.demoya@cchs.csic.es