Measuring patients’ preferences and priorities for information in chronic kidney disease
Paula Ormandy
School of Nursing, Midwifery & Social Work, University of Salford
Claire Hulme
Academic Unit of Health Economics, Leeds Institute of Health Sciences, University of Leeds
Introduction
Key policy drivers worldwide focus on the need to optimise the role of patients in the management of their care; focusing services on patient needs and preferences to facilitate choice; and providing information to help them make those choices. Over the past decade there has been an increased interest in how patients’ information needs are identified and measured reflecting these health policy initiatives (Rutten et al. 2005; Ormandy 2010). Indeed without robust evidence both education and information provision for patients will be based on inferred rather than actual patient information needs (Jenkins et al. 2001).
Quantitative measurement of information needs has employed summated and differential scales to obtain accurate, representative findings, at minimal cost and with the least measurement error (Mesters et al. 2001). Use of such scales adds breadth to the research and targeting of large samples (McDowell 2006). Large numbers, in turn, provide an opportunity to identify information needs of distinct groups and how demographic characteristics can influence both the need and type of information (Luker et al. 1995; Degner et al. 1997; Wallberg et al. 2000; Brownall et al. 2004; Kumar et al. 2004).
Summated scales such as the Likert scale are easy to develop and use a subject-centred approach to scale responses at different points along a continuum. One of the first summated scales to focus on information needs was the information needs styles questionnaire (Cassileth et al. 1980). The questionnaire, generated for cancer patients in the UK, has since been modified by others within the same field (Fallowfield et al. 1995; Meredith et al. 1996; Kumar et al. 2004). Within nephrology modified questionnaires have been used to measure the information needs of patients with chronic kidney disease (Orsino et al. 2003; Fine et al. 2005, 2007). Items within the developed questionnaires (Cassileth et al. 1980; Fallowfield et al. 1995; Meredith et al. 1996; Fine et al. 2005) have face-validity, but criterion-related validity has not been tested and internal consistency scales are not provided making it difficult to assess reliability (Pinquart and Duberstein 2004).
Studies, predominantly in oncology, have used differential scales to measure patients’ priorities and preferences for information (Luker et al. 1995; Degner et al. 1998; Beaver et al. 1999; Wallberg et al. 2000; Caress et al. 2002; Brownall et al. 2004; Beaver and Booth 2007). Degner et al. (1998) were one of the first to develop and apply Thurstone’s paired comparisons approach (Thurstone 1974). Using a set of items that possess some attribute in varying degrees an individual makes a preference judgement regarding the importance of an item when compared with another. The approach allows not only for the items to be ranked in terms of importance but for distance between items to be measured. This approach was piloted in the UK and Canada with breast cancer patients (Luker et al. 1995, 1996; Bilodeau and Degner 1996; Degner et al. 1997, 1998). These studies identified nine core information needs by way of literature review. The core needs were ordered into 36 pairs, with one item compared against another and respondents asked to choose the most important in each pairing.
Evidence from information needs research with chronic kidney disease patients is limited; no study to date has tested and applied differential measurement within this context; yet the advantages of a paired comparison approach, not only to rank information items but also to measure the distance between items giving a clearer idea of the significance of certain information needs over others is confirmed by the work of Degner et al. (1998). Indeed the ceiling effect whereby patients identify wanting to know everything within a summated scale is avoided.
The aim of this paper is to evaluate an information needs questionnaire, which uses a differential scale, Thurstone’s paired comparison approach, to measure the information needs of patients with chronic kidney disease. The paper presents the findings of a two phased cross-sectional survey study reporting the sequential development and testing of the questionnaire.
Methods
In a study carried out in 2006-2007, information needs items were identified in the first phase using semi-structured patient interviews. Patients were identified from a clinical network in the Northwest of England which encompassed: hospital-based haemodialysis; home-based haemodialysis; peritoneal dialysis (use of an abdominal catheter); transplanted and a pre-dialysis patient population. Twenty interviews were carried out using a purposive sampling frame targeting patients of different ages, gender and representative of different treatment modalities (Table 1). Ethical approval for the study was obtained from the Local Research Ethics Committee, University of Salford, and Trust Research and Development Committee.
| Sex | (N) | Age (yrs) | Age Groups | (N) | |
|---|---|---|---|---|---|
| Male | 11 | Mean 52.55 | 18 - <40 | 4 | |
| Female | 9 | Median 48.50 | 40 - <60 | 9 | |
| Range 29 - 81 | Over 60 | 7 | |||
| Modality group | (N) | Time on renal replacement therapy | (N) | Ethnic group | (N) |
| Pre-dialysis | 5 | Less than 1 year | 6 | White | 20 |
| Hospital haemodialysis | 8 | 1 year to less than 5 years | 6 | ||
| Peritoneal dialysis | 7 | More than 5 years | 3 | ||
| No experience | 5 | ||||
| Cause of chronic kidney disease | (N) | Socio-economic group | (N) | ||
| Glomerulonephritis or sclerosis (I) | 3 | Professional | 8 | ||
| Pyelonephritis (II) | 4 | Associate professional and technical | 2 | ||
| Polycystic kidneys (adult) (III) | 2 | Administrative and secretarial | 4 | ||
| Diabetes (VI) | 3 | Skilled trade | 2 | ||
| Miscellaneous (VII) | 7 | Process, plant and machine operatives | 2 | ||
| Unknown (VIII) | 1 | Elementary occupations | 1 | ||
| Unclassified (in education or never worked) | 1 | ||||
Core information items were elicited using a combination of content and thematic analyses (Miles and Huberman 1994). After sixteen interviews thirty-one broad themes were identified, a further four interviews generated no new themes, thus data collection was considered saturated (Straus and Corbin 1998). Independent analysis of a sub-set of five interview transcripts confirmed the themes.
Four fundamental analytical concepts, direct (expressed need), indirect (unexpressed need), coincidental and information deficit underpinned identification and extraction of information needs clarified by descriptor statements (Williamson 1998; Nicholas 2000; Shenton and Dixon 2004). Phrases containing multiple meanings were grouped under each pertinent theme. The initial thirty-one theme framework was merged into twelve core themes with forty-five sub-themes (Table 2).
| Theme 1: Chronic kidney disease, progression of the disease, what why when not working, what to expect in the future – Not too much information – too soon – Cause of kidney disease – What the kidneys actually do? – What to expect - what will happen? – Prognosis and future |
Theme 2: Physical symptoms as a result of renal replacement therapy and disease, what to expect and information, altered body image or sexual health – Physical symptoms – side effects from renal replacement therapy or disease – what to expect – What to do if experiencing symptoms – Sexual health – Altered body image |
| Theme 3: Renal replacement therapy (options, advantages and disadvantages of different treatments, practicalities, access, shifts, transplantation issues) – Different treatment options for dialysis – What does the treatment involve – how effective? – When will I start? – Transplant options |
Theme 4: Practical aspects of renal replacement therapy – Practicalities of having renal replacement therapy – How to do it? – Amount of stock – Transport issues (hospital haemodialysis) – Access for dialysis (fistula/Tenchkoff catheter) – Changes in treatment regime – Dialysis long-term – Listed and waiting for a transplant |
| Theme 5: Complications and side effects of renal replacement therapy and disease, what to expect and information – Don’t want to know possible complications – What to do if experiencing complication; how to recognise a complication; what to expect? – How to avoid complications? – Chance of getting a complication |
Theme 6: Medication information and possible side effects – Side effects of medication – Why am I on this medication; what is it for? |
| Theme 7: Family and lifestyle issues and information – Impact of renal replacement therapy and chronic kidney disease on your lifestyle – Fitting dialysis round your life – Holidays and travel |
Theme 8: Work and financial related issues and information – Able to continue working – Fitting dialysis round work – Impact on ability to work, career progression and self-esteem – Financial implications |
| Theme 9: Diet and fluid restrictions, what and why – Diet and fluid restriction information for different renal replacement therapy – Fitting the diet restrictions alongside your lifestyle |
Theme 10: Tests, investigations and blood results – What should my blood results be; what can I do about it? |
| Theme 11: Psychological issues, coping, feeling down and fed up – How to cope, normality, staying positive – Peer comparison – Adapting to the shock of needing dialysis – Threat to survival – Denial: deal with it when it happens – Feeling depressed; discussing emotions |
Theme 12: Other patient experiences; talking to other patients – Other patients experiences – Opportunity to talk to other patients |
The thematic information items generated were compared and contrasted with existing research evidence (Ormandy 2008). Using an expert group (clinicians, researchers and chronic kidney disease patient) data items were merged and reduced. Nine core information need themes emerged. New theme labels were created and agreed, ensuring language and meaning of the theme remained transparent.
- Information about what is chronic (long-term) kidney disease, what is the cause, how will it progress, what is the future.
- Information about how the kidney disease may affect me, physically or in other ways, how to recognise symptoms and what to expect.
- Information about the different treatment options, the advantages and disadvantages of each treatment, what the different treatments look like (such as machines etc) (Haemodialysis, peritoneal dialysis, transplant, automated peritoneal dialysis).
- Information about the practical issues of starting or changing treatment, what will happen to me and what can I expect (such as having a fistula, or peritoneal catheter, the frequency and length of time of treatment sessions or exchanges, fluid restrictions, base weight, ordering stock, using different strength bags, to up to date information on treatment changes).
- Information about what complications or side effects may occur as a result of the treatment or medication I’m taking.
- Information about ways in which I can manage and influence my own condition such as food restrictions, medication, how to keep my blood tests results stable or improve them.
- Information about the ways in which the kidney disease and the treatment may affect my daily life, social activities, work opportunities and financial situation (benefits and allowances available).
- Information from other patients about what it can be like living with chronic kidney disease and receiving regular treatment (such as practical tips on what I can do).
- Information about how to cope with and adjust to chronic kidney disease and who can provide support if I need it.
A summary of the nine core items (above) was sent to all participants for verification to establish content and face validity. Based on their feedback the items were re-worded and taken forward as the content of the paired comparison component of the questionnaire, within which the optimal method of pairing the nine items was determined using Ross’s matrix (Ross 1974) to prevent presentational bias. The number of pairs of items was determined by the formula [n (n-1)/2] (n=number of core items) (Degner et al. 1998).
In phase two the questionniare was used in interviews with patients identified from the same managed clinical network. Of the 386 patients identified, all were invited to take part in the study and eighty-nine were recruited (23%) (Table 3). The sample was representative of the wider population. No statistically significant differences were found between age (p=0.131), treatment mode (p=0.502), and time on renal replacement therapy (p=0.885). The proportions of male (59.6%) patients were comparable to the population (male 57.5%).
| Sex | N (%) | Age (yrs) | Age groups | N (%) | |
|---|---|---|---|---|---|
| Male | 53 (59.6%) | Mean 56.67 | 18 - under 40 | 10 (11.2%) | |
| Female | 36 (40.4%) | Median 59.00 | 40 - under 60 | 39 (43.8%) | |
| Range 25 - 83 | Over 60 | 40 (44.9%) | |||
| Treatment mode | N (%) | Time on renal replacement therapy | (N) | Time since diagnosis | (N) |
| Pre-dialysis | 23 (25.8%) | Less than 1 year | 16 | Less than 2 years | 21 |
| Hospital dialysis | 38 (42.7%) | 1 - less than 2 years | 19 | 2 - 10 years | 27 |
| Peritoneal dialysis | 28 (31.5%) | 2 - 5 years | 17 | 10 - less than 20 years | 28 |
| More than 5 years | 14 | More than 20 years | 13 | ||
| No experience of renal replacement therapy | 23 | ||||
| Ethnic group | (N) | Co-morbid conditions | (N) |
|---|---|---|---|
| White | 83 | No | 45 |
| Black Caribbean | 1 | Yes | 44 |
| Pakistani | 2 | Groups: | |
| Indian | 1 | 1 – Diseases causing chronic kidney disease | 11 |
| Chinese | 1 | 2 – Diseases unrelated to chronic kidney disease | 14 |
| Not disclosed | 1 | 3 - Cardiovascular disease | 24 |
| Current situation | (N) | Cause of chronic kidney disease | (N) |
| Full-time employment | 14 | Glomerulonephritis or sclerosis (I) | 8 |
| Part-time employment | 8 | Pyelonephritis (II) | 11 |
| Unable to work due to ill health | 27 | Polycystic kidneys (adult) (III) | 9 |
| Unemployed | 4 | Hypertension (IV) | 9 |
| Full-time education | 1 | Renal vascular disease (V) | 0 |
| Retired | 35 | Diabetes (VI) | 14 |
| Miscellaneous (VII) | 20 | ||
| Unknown (VIII) | 18 | ||
| Education qualification | (N) | Socio-economic group | (N) |
| No formal qualifications or secondary education only | 28 | Managers and senior officials | 10 |
| Pre-University, technical and skilled trade qualifications | 20 | Professional | 18 |
| College or university first or higher degree; professional qualification | 36 | Associate professional and technical | 15 |
| Other | 5 | Administrative and secretarial | 15 |
| Skilled trade | 11 | ||
| Personal service | 2 | ||
| Sales and customer service operators | 1 | ||
| Process, plant and machine operatives | 9 | ||
| Elementary occupations | 4 | ||
| Unclassified (in education or never worked) | 4 |
Within the interviews the nine core items were explained to clarify understanding and patients identified their current top-priority information need item. For the paired items, patients were asked if they could have information on only one of the two items which item s/he would choose. Other pairs on the same page were hidden to prevent distraction and to focus selection. On completion of the paired comparisons each patient was asked if the information needs identified were relevant to them and whether important information needs had been omitted. Duration of the face-to-face interviews was 45-60 minutes, with the setting determined by the patient: home, hospital, or workplace.
Demographic data were collected and ethnicity coded using the UK Renal Registry taxonomy (Ansell et al. 2007). Current occupations were classified using the Standard Occupation Classification (2000). Patients not working were classified using previous occupation.
A consecutive sample of the first ten patients was used as a pilot. Patient feedback on the questionnaire indicated items were clear, relevant and easy to understand and no revisions were made to the instrument.
Analysis was carried out using the Statistical Package for the Social Sciences (SPSS) and the Statistical Analysis Software package, using Thurstone’s paired comparison analysis (Sloan et al. 1994). The analysis is based on Case V and III of Thurstone’s law of comparative judgment. The difference between the two cases being that; Case V stringently assumes that there is no correlation among different rankings an individual gives, whereas the more lenient Case III allows for and estimates differences among individual item variability. The basic underlying assumption of the law is that when two stimuli are presented together they could be ranked in terms of some attribute, the attribute in this study being perceived importance (McIver and Carmines 1981). Each item will vary in terms of the attribute when investigated, although an individual may vary in their judgment of an item from one instance to the next, but overall there will be a frequent occurring response (Luker et al. 1995). Agreement between ratings of core information items was measured using Kendall’s coefficient of agreement for paired comparisons (Edwards 1974). Kendall’s coefficient of consistency measured consistency and logic in patients’ answers. Logical comparisons of items were determined when an individual preferred item A over item B, then item B over item C, and then logically chose item A over item C. When item C was selected over item A then an inconsistent comparison had been made, referred to as a circular triad (a mismatch of the comparative judgement between items) (Edwards 1974). Sloan et al. (1994) suggest a maximum of thirty circular triads before individuals are considered inconsistent in their ratings.
The Mosteller χ2 test of internal consistency, a goodness of fit test, assessed how well the data fit the underlying assumptions of Thurstone’s scaling Case V and Case III models was calculated. Gulliksen and Tukey’s (R2) measure of reliability that calculated the scalability of the data, the extent to which the Thurstone scale scores account for the variability of the individuals’ responses. The higher the R2 score the more scalable the data (Sloan et al. 1994). Descriptive statistics were used to analyse rank ordering of items and satisfaction with information giving. Independent-samples t-tests and one-way analysis of variance were used to compare the mean scale scores for the core items by subgroups on each of the demographic variables in turn.
In addition the averaged preferred proportions test was used to compare sub-groups and their comparative judgements. When significant differences are identified between the test scale values of items it indicates that the groups selected items differently and had contrasting preferences. The Bonferroni correction was used to protect against Type I error; p-values of less than p=0.0055 indicate that the test value for each item is found to be significantly different for each group.
Results
Priorities and preferences
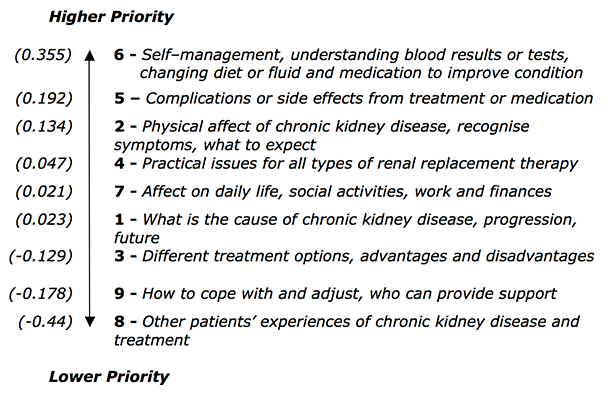
Core information needs are presented in Figure 1 in rank order based on the priorities determined for the whole sample (n=89). Scale values highlight the priority patients gave to items by rank order, the higher the value the more important this information need is compared with the others. Those with a negative scale value indicate that this item was preferred by less than 50% of the sample.
Items ranked highest comprise of information needs of recognising symptoms (item 2, scale value 0.134) and complications (item 5, scale value 0.192) and, most importantly, what they themselves can do about it (item 6, scale value 0.355). Lower ranked items were concerned with psychological rather than physical aspects, including experiences of other patients (item 8, scale value –0.44) and adapting and coping with a chronic illness (item 9, scale value –0.178). A significant difference (p<0.001) was found in the distance between the top three ranked items 6, 5 and 2, and the bottom item 8, as well as the top ranked item 6 and item 9 (second to the bottom).
When asked to identify the most important current information need 22.5% identified item 6, receiving information to enable self-management of their condition. However, items 4 and 1 were both identified by 20.2% of respondents as the most important current information need. The least number of patients (2.2%) selected item 8, information regarding other patients’ experiences as the most important (Table 4). The current most important item (6) selected by the highest number of patients and the item (8) selected by the least number of patients corresponds with the highest and lowest ranked items determined by the paired-comparison approach.
| Item no. | Item descriptor | Patients | |
|---|---|---|---|
| N | % | ||
| 6 | Self–management, understanding blood results, tests, diet and medication to improve condition | 20 | 22.5 |
| 4 | Practical issues for all types of renal replacement therapy | 18 | 20.2 |
| 1 | What is the cause of chronic kidney disease, progression, future | 18 | 20.2 |
| 3 | Different treatment options, the advantages and disadvantages | 10 | 11.2 |
| 2 | Physical effects of chronic kidney disease, recognise symptoms, what to expect | 7 | 7.9 |
| 5 | Complications or side effects from treatment or medication | 6 | 6.7 |
| 7 | Affects on daily life, social activities, work and finances | 4 | 4.5 |
| 9 | How to cope and adjust, who can provide support | 4 | 4.5 |
| 8 | Other patients' experiences of chronic kidney disease and treatment | 2 | 2.2 |
| Total | 89 | 100 | |
Questionnaire reliability, validity and fit
Kendall’s coefficient of agreement (Kendall's u) (0.06, p=<0.001) indicated agreement amongst participants. None of the participants had >30 circular triads (range 28-0, mean 9.29 (SD 7.045), median 7.00) therefore it was appropriate to conclude participants demonstrated consistency in their responses. Gulliksen and Tukey’s R2=0.6175, indicated an acceptable degree of reliability with just under two thirds of variance accounted for by scale scores.
The Mosteller chi-squared test of internal consistency determines how well the data fits the underlying assumptions of the Thurstone scaling Case V and/or Case III statistical model (Sloan et al. 1994). For the data to fit the Case V model the chi-squared and Mosteller p-value are used. A non-significant result indicates the scale values fit the observed data. In this study of eighty-nine participants, the χ2=52.21 (with 28.00 degrees of freedom) and p= <0.05, produced a significant result. This indicated that the expected scale values were not a particularly good fit with the model, despite the Gulliksen and Tukey’s measure indicated an acceptable degree of reliability.
Comparable results were observed when the data was tested for goodness of fit against the Case III scaling model. Although the fit was marginally better the χ2=49.49 (with 20.00 degrees of freedom) and p=<0.05, produced a significant result, indicative that the expected scale values were not a good fit with this particular model either. The Gulliksen and Tukeys measure of reliability (R2) was higher (R2=0.6352) for the Case III model, which again indicated an acceptable degree of reliability with again just less than two thirds of variance accounted for by scale scores.
The lack of fit with both scale models could indicate the sample size is not large enough to overcome individual inconsistencies or more likely that confusion existed amongst individuals in making the comparisons. To explore this further a sub-set of individuals who had circular triads of >16 (p=<0.90) and were thus considered to be less consistent in their responses were excluded from the analysis (n=16). The result of which then produced a lower Mosteller χ2=31.791 and non-significant p-value (p=0.283) indicative of improved cohesiveness, a better fit between the data and the model.
Similar results were found within the sub-group analysis where the data, for the majority of sub-groups, fit the model with smaller sample sizes producing non-significant results (p=<0.05). Those sub-groups where the model did not fit as well (groups such as males, hospital dialysis group, those with lower educational qualifications, and those with no co-morbidity) contained participants with a higher number of circular triads (≥16) (Table 5).
| Sample group | Mosteller χ2 | Mosteller p-value | Kendall’s u | Kendall’s p-value | Circular triads | R2 | ||
|---|---|---|---|---|---|---|---|---|
| Mean | Median | SD | ||||||
| Whole sample (n=89) | 52.21 | 0.0036 | 0.064 | 0.00 | 9.29 | 7.00 | 7.04 | 0.61 |
| Sample with circular triads <16 (n=73) | 31.79 | 0.283 | 0.078 | 0.00 | 6.80 | 6.00 | 4.77 | 0.75 |
| Males (n=53) | 44.15 | 0.027 | 0.062 | 0.00 | 9.75 | 9.00 | 6.76 | 0.52 |
| Females (n=36) | 25.79 | 0.585 | 0.054 | 0.00 | 8.61 | 6.00 | 7.49 | 0.57 |
| Under 50 yrs (n=28) | 35.69 | 0.151 | 0.031 | 0.00 | 9.92 | 6.50 | 8.74 | 0.24 |
| Over 50 to under 60 (n=21) | 20.13 | 0.859 | 0.015 | 0.97 | 8.61 | 6.00 | 7.34 | 0.34 |
| Over 60 years (n=40) | 39.44 | 0.074 | 0.161 | 0.00 | 9.20 | 9.00 | 5.56 | 0.74 |
| Haemodialysis (hospital-based) (n=38) | 38.12 | 0.096 | 0.075 | 0.00 | 10.63 | 10.00 | 8.15 | 0.50 |
| Peritoneal dialysis (n=28) | 36.72 | 0.124 | 0.089 | 0.00 | 6.82 | 6.00 | 5.73 | 0.53 |
| Pre-dialysis (stage 5) (n=25) | 16.50 | 0.957 | 0.04 | 0.00 | 10.12 | 11.00 | 6.12 | 0.60 |
| Higher educated (n=36) | 28.58 | 0.434 | 0.065 | 0.00 | 7.80 | 6.50 | 6.37 | 0.59 |
| Lower educated (n=28) | 51.82 | 0.004 | 0.106 | 0.00 | 10.75 | 8.00 | 8.68 | 0.36 |
| Employed (n=22) | 9.31 | 0.999 | 0.036 | 0.00 | 5.90 | 4.00 | 5.22 | 0.74 |
| Unable to work - ill health (n=27) | 38.59 | 0.087 | 0.031 | 0.00 | 11.03 | 11.00 | 8.82 | 0.19 |
| Retired (n=35) | 34.72 | 0.178 | 0.188 | 0.00 | 10.11 | 11.00 | 5.99 | 0.79 |
| No co-morbidity (n=45) | 48.66 | 0.009 | 0.064 | 0.00 | 9.82 | 7.00 | 8.12 | 0.44 |
| Co-morbid condition (n=44) | 26.21 | 0.562 | 0.064 | 0.00 | 8.75 | 7.50 | 5.78 | 0.64 |
| Less than 2 years receiving renal replacement therapy (n=35) | 26.95 | 0.521 | 0.061 | 0.00 | 8.06 | 7.00 | 6.23 | 0.57 |
| More than 2 years receiving renal replacement therapy (n=31) | 40.12 | 0.065 | 0.084 | 0.00 | 10.19 | 9.00 | 8.49 | 0.49 |
| Less than 2 years since diagnosis (n=21) | 30.56 | 0.337 | 0.038 | 0.00 | 9.48 | 9.00 | 7.03 | 0.29 |
| 2-10 years since diagnosis (n=27) | 27.82 | 0.474 | 0.072 | 0.00 | 10.77 | 11.0 | 7.95 | 0.53 |
| More than 10 years since diagnosis (n=41) | 30.12 | 0.358 | 0.074 | 0.00 | 8.21 | 6.00 | 6.39 | 0.64 |
| Values in bold - significant at 1% level; Values in italic - significant at 5% level | ||||||||
Sub-group analysis
There were subtle differences in the order of scale items between demographic groups (Table 6). Closer scrutiny using the averaged preferred proportions test indicated no significant differences between information need priorities by gender, time on therapy, education level or co-morbid condition. However, significant differences were observed between; age groups, treatment, time since diagnosis, and current work situation.
| Group | Scale items | ||||||||
|---|---|---|---|---|---|---|---|---|---|
| High rank | Low rank | ||||||||
| Whole sample (N=89) | 6 | 5 | 2 | 4 | 7 | 1 | 3 | 9 | 8 |
| 0.35 | 0.19 | 0.13 | 0.04 | 0.02 | -0.02 | -0.12 | -0.17 | -0.44 | |
| Sex | |||||||||
| Male (N=53) | 6 | 5 | 2 | 4 | 1 | 7 | 3 | 9 | 8 |
| 0.35 | 0.19 | 0.11 | 0.04 | 0.02 | 0.02 | -0.13 | -0.16 | -0.44 | |
| Female (N=36) | 6 | 5 | 2 | 4 | 7 | 1 | 3 | 9 | 8 |
| 0.35 | 0.20 | 0.17 | 0.05 | 0.02 | -0.07 | -0.10 | -0.18 | -0.44 | |
| Age | |||||||||
| More than 60 years (N=40) | 6 | 5 | 2 | 4 | 1 | 3 | 7 | 9 | 8 |
| 0.55 | 0.27 | 0.19 | 0.17 | -0.11 | -0.04 | -0.06 | -0.11 | -0.95 | |
| Over 50- under 60 years (N=21) | 1 | 5 | 6 | 2 | 7 | 8 | 4 | 3 | 9 |
| 0.25 | 0.19 | 0.18 | 0.07 | -0.02 | -0.12 | -0.12 | -0.21 | -0.23 | |
| Under 50 years (N=28) | 6 | 7 | 2 | 5 | 4 | 8 | 3 | 9 | 1 |
| 0.24 | 0.16 | 0.12 5 | 0.11 | 0.02 | -0.11 | -0.16 | -0.17 | -0.20 | |
| Treatment mode | |||||||||
| Pre-dialysis (N=23) | 6 | 4 | 5 | 7 | 2 | 3 | 8 | 9 | 1 |
| 0.43 | 0.30 | 0.07 | 0.06 | -0.01 | -0.03 | -0.27 | -0.27 | -0.28 | |
| Hospital dialysis (N=38) | 6 | 5 | 2 | 1 | 7 | 4 | 3 | 9 | 8 |
| 0.38 | 0.19 | 0.13 | 0.08 | 0.06 | 0.04 | -0.15 | -0.18 | -0.54 | |
| Peritoneal dialysis (N=28) | 5 | 6 | 2 | 1 | 7 | 9 | 3 | 4 | 8 |
| 0.33 | 0.27 | 0.26 | 0.07 | -0.06 | -0.07 | -0.15 | -0.17 | -0.47 | |
| Time since diagnosis | |||||||||
| Less than 2 years (N=21) | 6 | 2 | 7 | 1 | 5 | 3 | 4 | 9 | 8 |
| 0.35 | 0.09 | 0.09 | 0.06 | 0.05 | -0.05 | -0.05 | -0.17 | -0.38 | |
| More than 2 years to under 10 years (N=27) | 5 | 6 | 2 | 3 | 1 | 4 | 7 | 9 | 8 |
| 0.30 | 0.22 | 0.10 | 0.08 | 0.08 | 0.04 | -0.07 | -0.09 | -0.65 | |
| More than 10 years (N=41) | 6 | 5 | 2 | 4 | 7 | 1 | 9 | 3 | 8 |
| 0.44 | 0.20 | 0.18 | 0.10 | 0.05 | -0.12 | -0.22 | -0.29 | -0.35 | |
| Time on renal replacement therapy | |||||||||
| Less than 2 years (N=35) | 6 | 2 | 5 | 1 | 7 | 4 | 9 | 3 | 8 |
| 0.35 | 0.21 | 0.13 | 0.10 | 0.03 | -0.06 | -0.08 | -0.17 | -0.49 | |
| 2 years or more (N=31) | 5 | 6 | 2 | 1 | 7 | 4 | 3 | 9 | 8 |
| 0.39 | 0.29 | 0.19 | 0.08 | -0.03 | -0.05 | -0.13 | -0.22 | -0.53 | |
| Current situation | |||||||||
| Employed (N=22) | 6 | 5 | 7 | 2 | 8 | 4 | 1 | 9 | 3 |
| 0.40 | 0.29 | 0.09 | 0.08 | -0.09 | -0.10 | -0.11 | -0.11 3 | -0.46 | |
| Unable to work (N=27) | 2 | 6 | 5 | 1 | 7 | 8 | 4 | 3 | 9 |
| 0.22 | 0.19 | 0.16 | 0.04 | 0.01 | -0.10 | -0.15 | -0.16 | -0.20 | |
| Retired (N=35) | 6 | 4 | 5 | 2 | 3 | 1 | 7 | 9 | 8 |
| 0.62 | 0.31 | 0.21 | 0.09 | 0.08 | -0.03 | -0.04 | -0.11 | -1.14 | |
| Education level | |||||||||
| O level or less (None) (N=28) | 6 | 4 | 2 | 5 | 1 | 3 | 7 | 9 | 8 |
| 0.37 | 0.21 | 0.18 | 0.09 | 0.07 | 0.04 | -0.06 | -0.32 | -0.57 | |
| Degree or higher (N=36) | 6 | 5 | 7 | 2 | 4 | 9 | 1 | 3 | 8 |
| 0.31 | 0.24 | 0.14 | 0.13 | -0.01 | -0.06 | -0.07 | -0.17 | 0.51 | |
| Co-morbidity | |||||||||
| No co-morbidity (N= 45) | 6 | 5 | 2 | 7 | 1 | 4 | 9 | 3 | 8 |
| 0.36 | 0.22 | 0.11 | 0.03 | 0.01 | -0.07 | -0.08 | -0.18 | -0.41 | |
| Co-morbidity (N=44) | 6 | 5 | 2 | 4 | 7 | 1 | 3 | 9 | 8 |
| 0.34 | 0.17 | 0.16 | 0.15 | 0.02 | -0.04 | -0.06 | -0.26 | -0.47 | |
For patients aged under fifty years of age there was a significant difference (t-test, p=<0.05) between the distance in the top-ranked item 6 (scale value 0.24) and the lowest item 1 (scale value –0.20) (Table 7, Scale 2). Information about managing their condition (item 6) and the impact upon their lifestyle (item 7) were of a greater priority to younger patients than information about the cause of kidney disease and the future (item 1). In contrast, patients between the ages of 50 and 60 years ranked item 1 (scale value 0.25) the highest. The rank order of core items by patients over 60 years of age showed a significant difference (t-test, p=<0.05) between the lowest ranked item 8 (scale value -0.95) and the distance between all the other core items. The experiences of other patients were considerably lower in priority to older patients, compared with patients in lower age groups.
Patients in the pre-dialysis group (waiting to start treatment) typically rated information about the practicalities of therapy (item 4) higher than patients in the treatment groups (hospital dialysis and peritoneal dialysis) (Scale 4) (Table 7, Scale 3). Indeed, there were significant differences recorded between the distance of item 4 (scale value 0.30) compared with the lower ranked items 1, 8 and 9 (scale values –0.28, -0.27 and –0.27 respectively), for this group of patients causing this item to stand out. Of further interest was the low scale value assigned to item 1 (information about the cause of kidney disease and the future) by the pre-dialysis group compared with the higher priority given to this information need by both the hospital dialysis and peritoneal dialysis patients. For the hospital dialysis and peritoneal groups the top three ranked items were the same. Although for the peritoneal dialysis group the highest ranked item changed from item 6 to item 5 signifying that information about complications and side effects was slightly more important.
Patients who had been diagnosed less than two years previously gave a lower scale value (-0.05) to item 4 (practicalities of different treatments) for which there was a significant difference noted between this and the top-ranked item 6 (scale value 0.35) (Table 7, Scale 4). Those patients who had been diagnosed between 2-10 years gave the experiences of other patients (item 8) such low priority (scale value –0.35) that significant differences were shown with the distances between this particular item and the other core items. In addition for patients who had been diagnosed over ten years previously, item 3 (different treatment options) was ranked lower (scale value –0.29) resulting in a significant difference between this and the top-ranked item 6 (scale value 0.44).
Although it would appear from the findings that the information needs of patients change as time progresses from diagnosis, in particular, that information about the practicalities of renal replacement therapy increases in importance, it must be viewed with caution. On closer examination of the sub-sample groups, for example, of those who had been diagnosed for less than two years, 52% were unable to work and 71% were receiving replacement therapy. These two factors most probably influence the low priority given to the information about the practicalities of therapy not necessarily the time since diagnosis.
Within the employment sub-analysis (employed, unable to work due to ill health and retired) there were significant differences with regard to the distance and importance placed on specific items (Table 7, Scale 5). Patients in full or part-time employment rated item 6 (scale value 0.40) and item 5 (scale value 0.29) as the first and second most important information needs but then rated item 7 (information regarding the impact of the disease on their lifestyle) as third highest (scale value 0.09). The top-ranked item for those patients unable to work due to ill health was item 2 (physical affects and symptoms) with a scale value of 0.22.
| Scale 2: Age | Scale 3: Treatment group | Scale 4: Time since diagnosis | Scale 5: Current work situation | ||||||||
|---|---|---|---|---|---|---|---|---|---|---|---|
| Under 50 (n=28) | 50 to 60 (n=21) | Over 60 (n=40) | Pre-dialysis (n=23) | Hospital dialysis (n=38) | Peritoneal dialysis (n=28) | Less than two years (n=21) | Two to ten years (n=27) | Over ten years (n=41) | Employed (n=22) | Unable to work (n=27) | Retired (n=35) |
| higher priority | higher priority | higher priority | higher priority | ||||||||
| 6 (0.24) | 1 (0.25) | 6 (0.55) | 6 (0.43) | 6 (0.38) | 5 (0.33) | 6 (0.35) | 5 (0.30) | 6 (0.44) | 6 (0.40) | 2 (0.22) | 6 (0.62) |
| 7 (0.16) | 5 (0.19) | 5 (0.27) | 4 (0.30) | 5 (0.19) | 6 (0.27) | 2 (0.09) | 6 (0.22) | 5 (0.20) | 5 (0.29) | 6 (0.19) | 4 (0.31) |
| 2 (0.12) | 6 (0.18) | 2 (0.19) | 5 (0.07) | 2 (0.13) | 2 (0.26) | 7 (0.09) | 2 (0.10) | 2 (0.18) | 7 (0.09) | 5 (0.16) | 5 (0.21) |
| 5 (0.11) | 2 (0.07) | 4 (0.17) | 7 (0.06) | 1 (0.08) | 1 (0.07) | 1 (0.06) | 2 (0.08) | 4 (0.10) | 2 (0.08) | 1 (0.04) | 2 (0.09) |
| 4 (0.02) | 7 (-0.02) | 1 (-0.11) | 2 (-0.01) | 7 (0.06) | 7 (-0.06) | 5 (0.05) | 1 (0.08) | 7 (0.05) | 8 (-0.09) | 7 (0.01) | 3 (-0.08) |
| 8 (-0.11) | 8 (-0.12) | 3 (-0.04) | 3 (-0.03) | 4 (0.04) | 9 (-0.07) | 3 (-0.05) | 4 (0.04) | 1 (-0.12) | 4 (-0.10) | 8 (-0.10) | 1 (-0.03) |
| 3 (-0.16) | 4 (-0.12) | 7 (-0.06) | 8 (-0.27) | 3 (-0.15) | 3 (-0.15) | 4 (-0.05) | 7 (-0.07) | 9 (-0.22) | 1 (-0.11) | 4 (-0.15) | 7 (-0.04) |
| 9 (-0.17) | 3 (-0.21) | 9 (-0.11) | 9 (-0.27) | 9 (-0.18) | 4 (-0.17) | 9 (-0.17) | 9 (-0.09) | 3 (-0.29) | 9 (-0.11) | 3 (-0.16) | 9 (-0.11) |
| 1 (-0.20) | 9 (-0.23) | 8 (-0.95) | 1 (-0.28) | 8 (-0.54) | 8 (-0.47) | 8 (-0.38) | 8 (-0.65) | 8 (-0.35) | 3 (-0.46) | 9 (-0.20) | 8 (-1.14) |
| lower priority | lower priority | lower priority | lower priority | ||||||||
Implications for practice
High priority information needs
Patients prioritised information about managing their own disease, understanding and recognising physical symptoms, complications and side effects as the most important. Gathering information that increases knowledge about the disease, through symptom management and overseeing aspects of treatment facilitates survival (Curtin and Mapes 2001).
The highest ranked information need, managing their own condition through controlling their diet and/or fluid intake and to a lesser degree understanding their blood results, was important to patients because it was concerned with aspects of their care for which they have direct control. Fostering and encouraging patients’ self care skills and increasing independence is a key driver within UK national policy (Department of Health 2004), particularly to free up the availability of in-centre services for those patients for which self-care is not possible. Self-management information is crucial to patients at all stages of the disease, particularly those patients who are deciding which replacement therapy to choose. Targeted education about self-care has been shown to increase the number of patients who go on to choose peritoneal dialysis, home dialysis or self-care dialysis and remain independent (Piccoli et al. 2000; Manns et al. 2005). To identify that both patients and professionals are working towards the same priorities, is not only reassuring but also increases the possibility of developing a renal service that meets the needs of both groups.
Diet and fluid restrictions, have a cosiderable impact on the quality of life of patients (Bass et al. 1999) and information that could help them minimise the effects was considered a high priority (Groome et al. 1994; Schatell et al. 2003a, 2003b; Harwood et al. 2005). Patients attending out patient clinic have blood taken to monitor their disease and treatment stability. Interpreting the blood results, what would be normal for them and what action could be taken to make improvements was important information to patients (Coupe 1998; Schatell et al. 2003a). As Renal PatientView (Renal Association 2005) (a system by which patients can access their electronic records including their blood results) becomes more established throughout the UK then information and education that increases their understanding and knowledge of what these mean, is crucial.
Information that enables a patient to recognise a physical symptom, complication and/or side effect and understand its cause was ranked closely together in second place. In this sample it was interesting to note the high priority given to these topics for patients who had been on renal replacement therapy for many years, signifying an unmet or continuous need for information need and/or an increase in physical complications as a result of the disease progression. In practice information about physical symptoms and possible complications must be formalised and be continued over time to prevent patients having to learn from experience in a disorganised and unsystematic manner.
Medium priority information needs
A number of information needs clustered in the middle of the scale with minimal distance between them, indicating comparable levels of importance for the whole sample. These included the cause of chronic kidney disease and the future, practical issues regarding replacement therapy and different treatment options, the affects of the disease and treatment on coping with, and adapting to life with ,the disease.
Of interest was the importance given to the information need about what chronic kidney disease is and the cause, an important theme for those who had been on renal replacement therapy for many years and had not received appropriate information. Clarifying at the outset that the disease can be diagnosed without ever establishing the cause would help to allay these patients' concerns, and go some way to satisfying or reducing the significance of this need over time.
A key aspect of theme 7 (information about the effects on daily life, social activities, work and finances) was the affect the disease has on employment. As shown in other studies (Whitaker and Albee 1996; Orsino et al. 2003), sustaining a career and continuing to work was important to those who were the family breadwinner and/or single with no family to rely on for financial support. The early provision of targeted information addressing employment issues and realistic career advice could reduce the number of patients starting therapy being forced to make a major lifestyle change, by giving up work, becoming dependent on social security benefits, managing a reduced standard of living or having unrealised life goals and low self-esteem.
Lower priority information needs
Comments made by patients during the interviews intimated that although information on other patients’ experiences was not considered particularly important there was a degree of pertinent information to be gleaned from others’ experiences. This has been highlighted by patients in other studies (Juhnke and Curtin 2000). Tweed and Ceaser (2005) suggest that patients receive reassurance and experience reduced feelings of isolation when they compare themselves with others. Two patients prioritised information from other patients as their most important current information need, suggesting it cannot be dismissed.
Discussion and conclusion
Measuring information needs
The instrument is easy to complete and useful in identifying the information needs and priorities of a group of patients and within sub-groups. The paired comparison approach enabled the distance as well as the rank order of items to be measured which was invaluable when interpreting the data providing a deeper understanding than would have been achieved using a simple Likert scale. It was clear patients found it easier to choose between two items at a time than trying to choose one most important item from the list of nine.
The approach was, however, cumbersome given the time required to develop and ensure item accuracy. Administering the instrument using face-to-face interviews was labour intensive. Therefore, as a tool for use in clinical practice, it would be both time consuming and of limited benefit to the individual patient. Nonetheless, compiled within a condensed format (a topic guide), the nine core information needs could be used to initiate patient discussion and draw out more specific individual information needs, or used as an evidence base for deriving the content of education programmes.
Core information need items were relevant to patients and the reliability of data scalability and agreement between participants was acceptable. Overall 70.79% of patients agreed all items to be relevant; there was an acceptable degree of reliability for data scalability (R2 =0.6175); a degree of agreement found between patients (Kendall’s coefficient 0.06); and patient’s responses were consistent. Despite this, there was not a good fit between data and Case V and Case III models (Mosteller χ2 =52.21, p=0.003, χ2=49.49 p=<0.001 respectively).
The lack of fit to the model is likely to have been distorted by inconsistent comparative judgements of a small number of patients. Although the numbers of circular triads, from this group of patients, did not exceed the recommended maximum they clearly influenced data reliability. What is interesting to note is that from the studies using this method, with similar numbers of circular triads only Wallberg et al. (2000) report the results of the Mostellar χ2 or Gulliksen and Tukey’s measure of scalability. If it is assumed that more than sixteen circular triads are indicative of inconsistent judgements then the data suggests that patients found it problematic to decide between particular items although when examined there was no pattern to the items involved. These inconsistencies may signify that many of the themes were personally relevant to the patient and the confusion was created when two or more were of comparable priority (clustering around the middle of the scale is indicative of this). When the inconsistent judgements were extracted, the data fitted the model. It is possible that within a larger sample the inconsistent judgements may be less prominent. Alternatively the solution may be much simpler in as much as some respondents may be unclear of their own priorities.
In phase one an information topic identified from one study Groome et al. (1994), indicated that patients required information about the availability and quality of nursing and physician care and to a lesser degree what facilities were available. This item was not included because of a lack of corroborating evidence either the literature or the patient interviews. However, six patients suggested information about clinic visits, their consultant and service delivery were missing information needs on the questionnaire, albeit not as important as the other core items listed. The majority of these patients had been re-located to a satellite unit and, as a result, expressed concerns about their reduced contact with the medical team and inappropriate clinic visits. Concern about missing items that are important to a minority has been expressed previously (Degner et al. 1998) and the issue cannot be ignored. Whilst in this study the missing item appears context specific, future testing of the instrument within this patient population should consider inclusion of this information need.
The importance of qualitative methods for identifying information needs cannot be underestimated. Indeed face-validity of many questionnaires using differential scales has been determined using preliminary patient interviews or focus groups to agree and confirm the content (Luker et al. 1995; Degner et al. 1997; Fallowfield et al. 1995; Hepworth and Harrison 2004; Fine et al. 2005; Hylands et al. 2006). Failure to involve patients at the outset in instrument design draws doubt on whether the tool can successfully address the needs of the patient and brings into the spotlight whether patients’ information preferences are determined by professionals and not grounded in what patients themselves consider important (Scott and Thompson 2003).
The study is limited by the relatively small sample size in phase two. Only eighty-nine patients were recruited, just under half the anticipated number, which may have introduced selection bias. A contributory reason for this shortfall was problems identifying the population; the shifting status of patients in terms of treatment mode made eligibility assessment difficult. Where status could not be confirmed potential recruits were lost to the study. Despite this, only one quarter of patients contacted chose to be involved, maybe because they valued their time when not on dialysis and were not prepared to encroach on it. Hines et al. (1997a, 1997b) recruited 197 hospital-based dialysis patients by interviewing them whilst receiving therapy. Although initially this did not seem appropriate, some participants in this study preferred to meet during treatment, indicating it was a better use of their time. This additional strategy could possibly have increased the sample size and should be considered as viable method in future research.
A further weakness of the study sample was failure to recruit patients from ethnic minority groups, despite offering translation services. However, this reflected a wider problem of low prevalence rates within the local population signifying ethnic minority patients at risk of chronic kidney disease were not being identified and referred to the service (Greater Manchester Renal Strategy Group 2008).
Conclusion
In summary, the study has shown that, using the paired comparison approach , it is not only possible to identify the information needs but also measure the strengths of preferences for information of patients. Such needs exist on an individual level and, when patients are grouped, there is consensus about what is most important. However, further testing of the reliability and validity of the questionnaire is required.
Acknowledgements
We are very grateful and would like to recognise the valuable contribution of the wider research team Dennis Crane (patient representative), Mrs Jane Macdonald, Professor Donal O’Donoghue, and Professor Ann-Louise Caress. The study received funding from the British Renal Society and we thank them for their support. The analysis could not have been performed without access to the SAS computer program developed in Canada by Sloan et al. (1994) used to produce profiles of information needs based on Thurstone’s law of comparative judgment.
About the authors
Professor Paula Ormandy is a health service researcher, leading the research programme for long-term conditions with specific research interests in chronic kidney disease, patient information needs, self care and self-management, and the use of digital media in health. She holds a BSc (Hons) in Nursing Studies, and MSc in Practitioner Research, Manchester Metropolitan University and a PhD in Nursing from the University of Salford; she is a Registered General Nurse. Paula can be contacted at: p.ormandy@salford.ac.uk
Professor Claire Hulme is Director of the Academic Unit of Health Economics in the Leeds Institute of Health Sciences, University of Leeds. She holds a BSc (Hons.) in Economics, MA in Higher Education Practice and Research, and PhD in Health Economics from the University of Salford. Claire's research interests are in the economic evaluation of community programmes spanning the health and social sectors and economic evaluation alongside clinical trials. She can be contacted at c.t.hulme@leeds.ac.uk