The rise and fall of text on the Web: a quantitative study of Web archives
Anthony Cocciolo
Pratt Institute, School of Information & Library Science, 144 W. 14th St. 6th Floor, New York, NY 10011 USA
Introduction
Casual observations of recent developments on the World Wide Web may lead one to believe that online users would rather not read extended texts. Websites that have gained recent prominence, such as BuzzFeed.com, employ text in short segments and rely heavily on graphics, videos and animations. From a design perspective, BuzzFeed articles share more in common with children's books, with layouts including large graphic images with short text blocks, rather than with the traditional newspaper column. With respect to Website visitors, newcomers such as BuzzFeed outrank more established and text-heavy media outlets, such as WashingtonPost.com and USAToday.com, which are ranked by Alexa.com as 71st and 65th most visited Website in the United States (BuzzFeed ranks 44th). Other sites that specialize in visual information such as photography and video have seen major popularity surges, including YouTube.com (ranks 4th), Pinterest.com (ranks 12th), Instagram.com (ranks 16th), Imgur.com (ranks 21st), Tumblr.com (ranks 24th) and Netflix (ranks 26th).
This project seeks to determine if these anecdotal observations might signal a more general trend toward the reduction of text on the World Wide Web. To study this, the following research questions are posed: Is the use of text on the World Wide Web declining? If so, when did it start declining, and by how much has it declined?
To study this, six hundred captures of one hundred prominent and popular Webpages in the United States from a variety of sectors were analysed to determine if the amount of text they present to users has declined over the past fifteen years. However, before the method will be discussed, relevant literature related to reading text online and its relationship with reading more generally will be discussed.
Literature review
The internet has continued to challenge traditional forms of literacy. Early work on the internet and language highlight the difference between ‘netspeak’ and traditional literacy, such as the language of emails, chat groups and virtual worlds (Crystal, 2001). Noteworthy new forms of communication spawned by the internet include the use of text to create graphical representations, such as the ubiquitous smiley face (Crystal, 2001). Recent research on the impact of the internet on literacy include its convergence with mobile telephony. For example, Baron (2008) studies writing from its earliest forms to the present, mobile age, and projects that writing will be used less as a way for clarifying thought and more as a way of recording informal speech. Other theorists see more changes to our traditional notions of literacy. Sociologists such as Griswold, McDonnell and Wright (2005) look at reading and find that ‘the era of mass reading, which lasted from the mid-nineteenth through the mid-twentieth century in northwestern Europe and North America, was the anomaly’ and that ‘we are now seeing such reading return to its former social base: a self-perpetuating minority that we shall call the reading class’ (p. 138). In their conception, most people in Europe and North America will be able to read, however, most will not engage in extended reading because of ‘the competition between going online and reading is more intense’(p. 138).
The need to both understand and work within this transformed literacy landscape has led to a variety of concepts that look to capture this change, including ideas such as multiple literacies, new literacies, multimodal literacy, digital literacies, media literacy and visual literacy. Although each of these concepts are different, they emphasize a need for understanding and being able to operate in a communicative landscape that includes more than print literacy. Kress (2010) argues that digital technology allows for easy and effective means for humans to communicate multimodally, which involves the use of images, sounds, space and movement. In writing about the maturation of digital media, Kress and Jewitt (2003) note that ‘now the screen is dominant medium; and the screen is the site of the image and its logic’ and finds that even in books ‘now writing is often subordinated to image’ (p. 16). Miller and McVee (2012) agree and find that ‘increasingly, the millennial generation (born after 1981) immersed in popular and online cultures, thinks of messages and meanings multimodally, rarely in terms of printed words alone’ (p. 2). Adults interested in engaging youth more fully are thus encouraged to understand – and begin to teach – multimodal literacy, such as making use of blogs and wikis in the classroom (Lankshear and Knobel, 2011). For educators who have adopted multimodal projects, Smith (2014) has found that the use of multimodal composition ‘is an often engaging, collaborative, and empowering practice’ (p. 13).
While educators explore ways to communicate multimodally – both for enhancing their own ability but also for teaching youth – Web designers and those offering expertise on Web design recommend shrinking the amount of text on Webpages. Nielsen Norman, a company that provides advice and consulting on Web user-experience, consistently recommend that Web developers reduce the amount of text online. Examples include articles such as ‘How little do users read?’, which finds that Web users read only about 20% of the words on a Webpage (Nielsen, 2008). Others articles recommend brevity. ‘Don't require users to read long continuous blocks of text,’ and ‘modern life is hectic and people simply don't have time to work too hard for their information’ (Nielsen, 1997a; Nielsen, 1997b). Other Web design experts offer similar advice. Krug (2006) – well-known for his dictum ‘don’t make me think’ – suggest that Web designers remove ‘half of the words’ on a Web page because ‘most of the words I see are just taking up space, because no one is ever going to read them,’ which makes ‘pages seem more daunting than they actually are’ (p. 45). Thus, those designing texts for the Web are encouraged to shrink their texts or risk being skipped or ignored.
Methods
Website selection
This study is interested in uncovering if the use of text on the World Wide Web is declining, and if so by how much and since when?. To study this, one hundred prominent and popular Webpages in the United States from a variety of sectors were subjected to analysis. First, the author created a set of categories that encompass the commercial, educational and non-profit sectors in the United States. These categories were then filled with Websites using Alexa’s Top 500 English-language Website index, including archived versions of that index available from the Internet Archive. For example, the Alexa Top 500 Websites index from 2003 available on the Internet Archive. Since many popular Websites from today were not available in the 1990s, only those sites that were available in the late 1990s were included. Similarly, notable Websites from the late 1990s that lost prominence more recently (e.g., site was shutdown), were excluded from the list. The categories of Websites and respective Websites are included in Table 1.
| Category | Total Websites | Websites |
|---|---|---|
| Consumer products and retail | 10 | Amazon.com, Pepsi,com, Lego.com, Bestbuy.com, Mcdonalds.com, Barbie.com, Coca-cola.com, Intel.com, Cisco.com, Starbucks.com |
| Government | 11 | Whitehouse.gov, SSA.gov, CA.gov, USPS.com, NASA.gov, NOAA.gov, Navy.mil, CDC.gov, NIH.gov, USPS.com, NYC.gov |
| Higher Education | 10 | Berkeley.edu, Harvard.edu, NYU.edu, MIT.edu, UMich.edu, Princeton.edu Stanford.edu, Columbia.edu, Fordham.edu, Pratt.edu |
| Libraries | 8 | NYPL.org, LOC.gov, Archive.org, BPL.org, Colapubliclib.org, Lapl.org, Detroit.lib.mi.us, Queenslibrary.org |
| Magazines | 12 | USNews.com, TheAtlatnic.com, NewYorker.com, Newsweek.com, Economist.com, Nature.com, Forbes.com, BHG.com, FamilyCircle.com, Rollingstone.com, NYMag.com, Nature.com |
| Museums | 10 | SI.edu, MetMuseum.org, Guggenheim.org, Whitney.org, Getty.edu, Moma.org, Artic.edu, Frick.org, BrooklynMuseum.org, AMNH.org |
| Newspapers | 9 | NYTimes.com, ChicagoTribune.com, LATimes.com, NYDailyNews.com, Chron.com, NYPost.com, Suntimes.com, DenverPost.com, NYPost.com |
| Online service | 8 | IMDB.com, MarketWatch.com, NationalGeographic.com, WebMD.com, Yahoo.com, Match.com |
| Technology site | 11 | CNet.com, MSN.com, Microsoft.com, AOL.com, Apple.com, HP.com, Dell.com, Slashdot.org, Wired.com, PCWorld.com, IBM.com |
| Television | 11 | CBS.com, ABC.com, NBC.com, Weather.com, PBS.org, BBC.co.uk, CNN.com, Nick.com, MSNBC.com, CartonNetwork.com, ESPN.go.com |
| Total | 100 |
Web archives
To study these Websites, Web archives from the Internet Archive were used. Based in San Francisco, USA, the Internet Archive's goal is to ‘provide permanent access for researchers, historians, scholars, people with disabilities, and the general public to historical collections that exist in digital format’ (Internet Archive, 2014). Although the Internet Archive began collecting Websites in 1996, more thorough and complete Web archives began a few years later. Thus, 1999 was chosen as an appropriate starting year to begin analysing Websites because by this point the Internet Archive was able to produce quality Web crawls for a wide variety of sites.
Because any given Website can include hundreds, if not thousands or millions of pages, the Internet Archive only crawls through a small selection of the top-level pages of a given site. Thus, the Internet Archive does not keep complete copies of the Web but rather a select number of all the top-level domains names. Also, some Web site owners may prevent crawling by the Internet Archive and other Web crawlers through blocking access through a robots.txt file. Websites that were blocked from crawlers were excluded from investigation. Also, since there is a large amount of variability between years in how many pages of a Website were downloaded by the Internet Archive, only the top-level page (or homepage) was considered in this analysis.
After creating an initial index of Websites to investigate, a computer script was created to retrieve the addresses of Web archives from the Internet Archive's Memento interface for the years 1999, 2002, 2005, 2008, 2011 and 2014. Memento is a ‘technical framework aimed at a better integration of the current and the past Web,’ and provides a way to issue requests and receive responses from Web archives (Van de Sompel, Nelson, Sanderson, Balakireva and Shankar, 2009). For each of the one hundred URLs, the Memento interface was queried for sites near the date January 15, for the aforementioned years. If no Web crawl is available for January 15 of that year, the nearest crawl is used instead. January 15 is an arbitrary date and any other date of the year could be chosen.
Three-years is a logical segment of time to analyse Websites since it is enough to show changes over time without the need to create a repetitive dataset. In sum, using the one hundred Website seed index, six hundred URLs were generated which pointed to Web archives in the Internet Archive.
Using the six hundred URLs, screen captures of the Websites (including areas below any scrolling) were created using the Mozilla Firefox plugin ‘Grab Them All’ (Żelazko, 2014). This plugin creates screenshots of Webpages using text listings of URLs. Since archived Web pages in the Internet Archive can sometimes take many seconds to load fully, the plugin was setup to allow up to twenty-five seconds to load the archived Webpage, and save it as a screenshot.
The six hundred pages were manually checked for quality. For example, sites that did not have Web archives for the given years (e.g., Wall Street Journal, Time Magazine, USA Today) were excluded from this investigation, and replaced with other relevant sites in their categories. Also, because Websites need to be manually checked for quality, which is a labour-intensive project, this provided an additional reason to rely on images produced for every three-year period.
Text detection using computer vision
Websites make use of text encoded in HTML and also use text in graphic images. Use of text within graphics is a popular way to stylize text with fonts that are not available to all Web clients. Thus, text detection must occur within both HTML text blocks and within images.
The method used to detect text within images employed a computer vision algorithm called the stroke width transform. This algorithm was created by Microsoft research staff Epshtein, Ofek and Wexler (2010), who observe that the ‘one feature that separates text from other elements of a scene is its nearly constant stroke width’ (p. 2963). During their initial evaluation the algorithm was able to identify text regions within natural images with 90% accuracy.
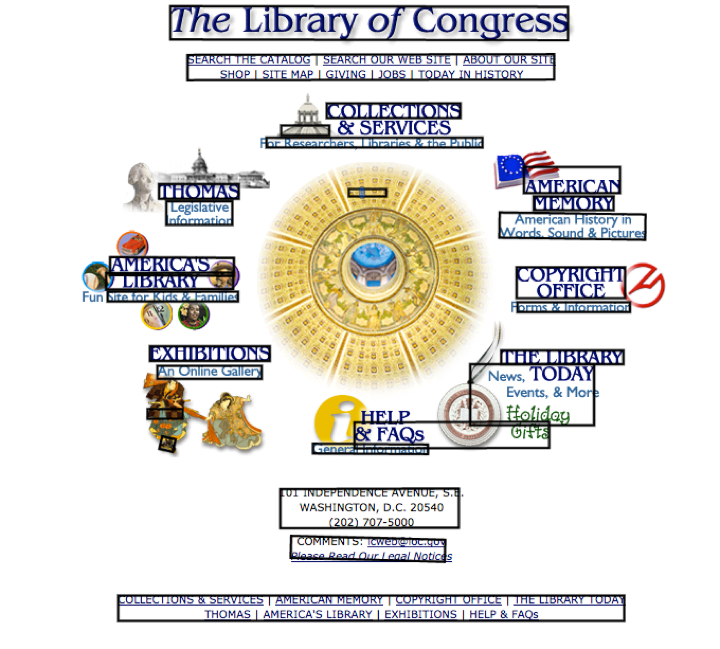
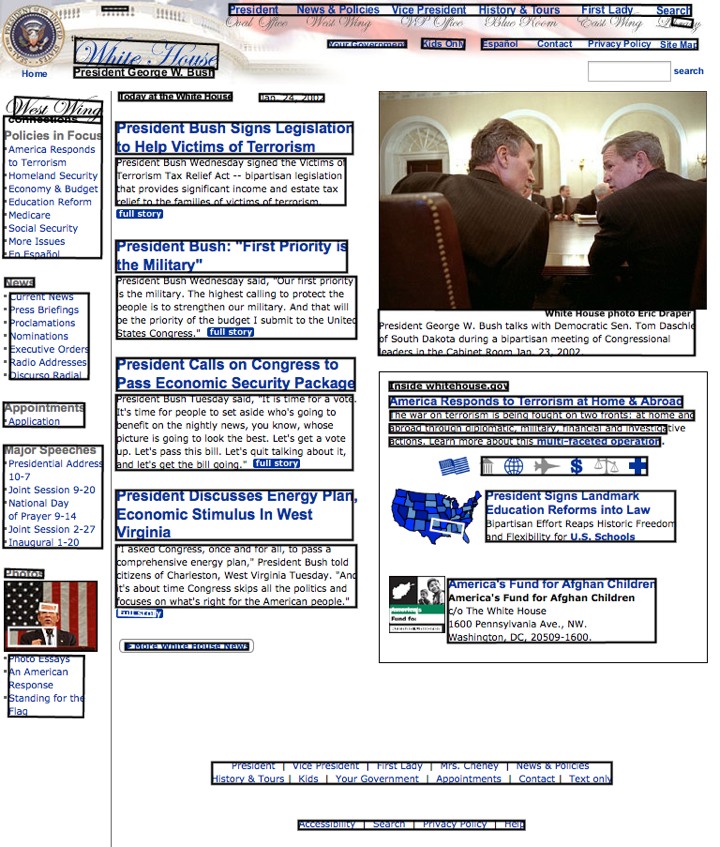
This project used an implementation of the stroke width transform created by Kwok (2014) for the Google Chrome extension Project Naptha. This extension allows text within images to become accessible as unicode text. It accomplishes this by running the algorithm on the images of a Webpage to detect text regions, and then runs those regions through an optical character recognition process (Kwok, 2014). Figure 1 shows this process used on the Library of Congress Webpage from Internet Archive's 2002 collection, with the black boxes identifying the text regions from the images. The algorithm is not without minor inaccuracies. It has identified part of the dome incorrectly as a text area, as well as some other very small areas. Nevertheless, it has an accuracy that is consistent with the findings of the Microsoft researchers. A second example provided is that of the White House Website from 2002 using this same process (shown in Figure 2).
The source code for Project Naptha is open source and was modified to analyse the six hundred images, produce the bounding boxes for each image that identified the text from the non-text, and export metadata on the bounding boxes to a MySQL database. The database holds information such as the total size of the captured Webpage image in pixels, the total area dedicated to text in pixels, and the percentage of text to total image area. This percentage is particularly insightful: a high-percentage would be a text-heavy page, where a low one would indicate a lack or sparing use of text. The formula to compute this percentage is as follows:
Percentage text = Onboundingboxwidth i x bounding box height i x 100
image width x image height
This percentage is used for making comparisons between years. For example, using this method the Webpage shown in Figure 1 is 23.33% text, and the Webpage shown in Figure 2 is 46.10% text.
From the survey of the literature, Project Naptha is unique in that it is one of the first applications of the stroke width algorithm to detect text on Webpages. The most frequent use of the algorithm is to detect text within natural scenes, such as photographs taken with mobile phones. For example, Chowdhury, Bhattacharya and Parui (2012) use it to identify Devanagari or Bangia text (which are the two most popular scripts in India) in natural scene images Similarly, Kumar and Perrault (2010) use the algorithm to detect text in natural images using an implementation for the Nokia N900 smartphone. The Microsoft researchers who are credited with creating the algorithm, Epshtein, Ofek and Wexler (2010), also used it to detect text with images of natural scenes.
Comparison between years
The database produced in the earlier step was imported into SPSS to calculate mean percentages of text per year. Additionally, a one-way ANOVA is conducted to determine if the percentage of text between groups of Webpages with different years is statistically significant. If the difference is statistically significant, this would indicate that the variation in means is not a chance occurrence but rather the percentage of text on a Webpage is dependent on the year it was produced.
Results
For each year, the average percentage of text on Webpages with standard deviations is included in Table 2. Using these data, results reveal that the percentage of text on pages climbed from the late 1990s to 2005 where it peaked (with 32.4% of the Webpage), and has been in decline ever since (illustrated in Figure 3). Websites in 2014 have 5.5% less text than 2005 on average, or 26.9% text. This is more text than in the late 1990s, with Webpages having only 22.4% text.
| Year | Mean percentage of text on a Webpage |
Standard deviation |
|---|---|---|
| 1999 | 22.36 | 15.45 |
| 2002 | 30.89 | 14.93 |
| 2005 | 32.43 | 14.60 |
| 2008 | 31.31 | 15.88 |
| 2011 | 28.51 | 15.47 |
| 2014 | 26.88 | 13.23 |
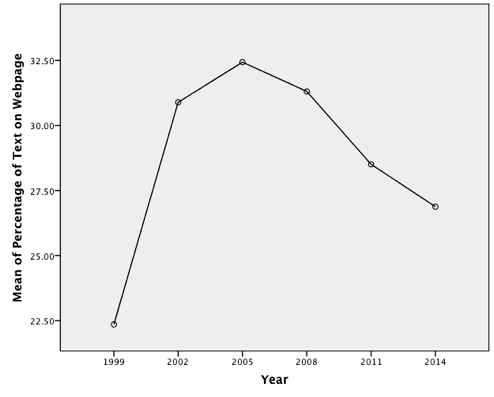
The one-way ANOVA revealed that the percentage of text on a Webpage are not chance occurrences but rather this percentage is dependent on the year the Website was produced. Specifically, percentage of text was statistically significant between different years, F(5, 594) = 6.185, p < .0005, ω2 = 0.04.
Note that the “percentage of text” metric does not count words, but rather presents the percentage of text on a Webpage relative to other elements on the page, such as graphics, videos, non-textual design elements or even empty space.
Interestingly, the percentage of text on a Webpage in 2014 had the lowest standard deviation. This indicates that Websites in 2014 exhibit less variation in how much text they display, which could indicate a growing consensus on how much text to display to users. Although this is only speculative, this could be the result of growing professionalization of Web design and development, such as more individuals learning and taking the “best practices” advice of authors such as Nielsen (2008) and Krug (2006).
Conclusions, limitations and further research
In conclusion, this study illustrates that the percentage of text on the on the Web climbed during the turn of the twentieth century, peaked in 2005, and has been on the decline ever since. Observing the current downward trajectory of text on the Web—it has declined for the last nine years—it is possible to surmise that it may decline even further. Other research that analyses Web archives further confirm this finding. Miranda and Gomes (2009) analysed the complete contents of the Portuguese Web archive—which includes millions of archived Webpages, including Websites outside of Portugal—and found that between 2005 and 2008 text/html decreased by 5.5%. At the same time, they found image and audio content increased: JPEGs increased 1.2% and Audio or MPEG increased by 25.1%. They did not consider video formats since those are less reliably downloaded into Web archives.
This study necessarily begs the question: what has caused this decrease in the percentage of text on the Web? Although it is difficult to make definitive conclusions, one suggestion is that the first Web boom of the late 1990s and early 2000s brought about significant enhancements to internet infrastructure, allowing for non-textual media such as video to be more easily streamed to a variety of sites such as homes, workplaces and schools (Greenstein, 2012). Interestingly, the year 2005 was also the year that YouTube was launched (Burgess & Green, 2009). This is not to suggest that text was replaced with YouTube videos but rather that a rise in multiple modes of communication became more possible with its easier delivery, such as video and audio, which may have helped unseat text from its primacy on the World Wide Web.
If the World Wide Web is presenting less text to users relative to other elements, extended reading may be occurring on other media such as e-readers or printed books. Recent research from the Pew Research Centre found that ‘younger Americans’ are significantly more likely than older adults to read books, including print books’ (Zickuhr & Rainie, 2014, p. 9). Specifically, they found that ‘Americans under age 30 are more likely to report reading a book (in any format) at least weekly (67% vs 58%)’ (p. 9). Schoolwork may contribute to these figures; however, it does indicate that reading may be going on elsewhere other than the World Wide Web.
One limitation of this project is that it only studied popular and prominent Websites in the United States. The reduction in text online may be a product of U.S. culture more than a more general worldwide trend. Future studies that consider Websites from other countries are needed to uncover if this is a local cultural occurrence or a more general development.
About the author
Anthony Cocciolo is an Associate Professor at Pratt Institute School of Information and Library Science, where his research and teaching are in the archives area. He completed his doctorate from the Communication, Media and Learning Technologies Design programme at Teachers College Columbia University, and BS in Computer Science from the University of California, Riverside. He can be contacted at acocciol@pratt.edu or via his Website thinkingprojects.org.