Video game information needs and game organization: differences by sex and age
Jin Ha Lee, Rachel Ivy Clarke, Yea-Seul Kim
Information School, University of Washington, Mary Gates Hall, Suite 370, Seattle, WA 98195
Introduction
Video games are increasingly popular and pervasive in daily life. The contemporary evolution of video games, especially recent increases in social and mobile gaming, attracts a wide variety of players. For instance, the percentage of female gamers has steadily increased in the last two decades, with women currently comprising almost half of gamers in the USA (Entertainment Software Association, 2014), Canada (Entertainment Software Association of Canada, 2012), Europe (Ipsos MediaCT, 2012), Australia (Brand, Lorentz and Mathew, 2014) and New Zealand (Brand, Lorentz and Mathew, 2014). The age of gamers is also changing: the average video game player is no longer a teenager, but thirty-one in the USA (Entertainment Software Association, 2014) and thirty-five in the UK (Kabrick, 2013), and the number of American female gamers over fifty years old increased by 32% in recent years (Entertainment Software Association, 2014). While this demographic shift has inspired a multitude of research regarding various aspects of video games, gaming and game players, there is still little inquiry into the needs exhibited by these diverse users regarding information about video games. As a result, we still lack a comprehensive understanding as to how game players and other stakeholders interested in games find information about games, search and discover new games, and build and organize their game collections. Understanding these factors is essential for establishing user-centred game information retrieval and recommendation systems.
Since 2011, the Game Metadata Research (GAMER) Group at the University of Washington Information School, in partnership with the Seattle Interactive Media Museum, has been developing a standardized metadata schema and controlled vocabularies for video games designed to serve a variety of user groups and use cases. As with any metadata work, a thorough understanding of users’ information needs is crucial. In this study, we seek to increase our understanding of users’ video game-related information needs and how they organize their game collections in order to ultimately improve access to video games and related materials. Specifically, we seek to address the following questions:
- RQ1. What kinds of information needs surrounding games do video game users exhibit?
- RQ2. How do users organize and access their game collections?
- RQ3. In what significant ways do these needs and organizational methods differ based on the sex and age of users?
The primary objective of this study is to improve our overall understanding of people’s game-related information needs and organizational methods for personal game collections, with special attention paid to differences between sexes and among age groups. We selected these two variables for closer examination given that sex and age differences among video game players were noted in the literature by several scholars with regards to motivations for playing games and gaming preferences (e.g., Carr, 2005; Yee, 2006; Greenberg, Sherry, Lachlan, Lucas and Holmstrom, 2010; Homer, Hayward, Frye and Plass. 2012; Bilgihan, Cobanoglu, Nusair and Bujisic, 2013). As part of a larger research agenda, this paper reports the results of an online survey to obtain descriptive statistics summarising users’ needs with regards to finding, organizing and selecting video games for personal use or the use of others. In addition to quantitative understanding, the findings from this study will be used to triangulate findings from previous studies employing more qualitative approaches (Lee, Cho, Fox and Perti, 2013; Lee, Clarke and Perti, 2015b). Furthermore, our findings will help inform the design of information organization and retrieval systems for video games by improving understanding of information needs commonly shared by a substantial number of users.
Relevant work
Relatively little research has been conducted on gamers’ information needs and behaviour, especially within the domain of information science. To date, most research focuses on using video games or building game collections in libraries (Levine, 2006; Nicholson, 2008; Nicholson, 2009), or preservation, archiving and documentation practices surrounding games (McDonough et al., 2010; Winget and Sampson, 2011).
Nicholson’s research focuses on the status of video games in libraries by analysing materials held by libraries, library policies and related topics (Nicholson, 2008). He also looks at gaming activities by library type and size to identify future directions for gaming activities in libraries, noting that 77% of public libraries support games or gaming activity in some way, and arguing that it is crucial to identify specific goals when incorporating games and gaming into library services. Subsequently, he suggests that understanding who the users are, their needs and wants, and how impact will be measured are important to justify decisions to integrate gaming in libraries (Nicholson, 2009). Levine (2006) and Neiburger (2007) also advocate using video games in libraries, introducing online resources for information on gaming as well as discussing how to set up, promote and run game-related events in libraries.
Recently, the importance of preserving games has also been acknowledged in information science. Since video games are heritage objects that reflect the cultural and economic landscape, institutions collecting these materials have responsibilities to preserve video games (Winget, 2011; Lee et al., 2015b). The International Game Developers Association launched the Game Preservation Special Interest Group in 2004 to address problems relating to video game preservation discussed in a 2009 white paper (Lowood, Monnens, Vowell, Ruggill, McAllister and Armstrong, 2009). The authors explain the need for video game preservation as the physical media deteriorate and become obsolete, and discuss possible solutions to raise awareness (Lowood et al., 2009). This great need for preserving digital artefacts, such as software, virtual communities and commodities, and video games was also noted in McDonough et al. (2010). Several researchers attempted to address this problem from various aspects of technology, policy and practice. Guttenbrunner et al. (2008) evaluated current strategies for preservation by comparing different methods. They suggest that documentation made during the game development process should be collected and preserved in addition to the game itself (Guttenbrunner, Becker, Rauber and Kehrberg, 2008). Various emulators and emulation strategies were discussed by Van Der Hoeven and Van Wijngaarden (2005) and Pinchbeck, Anderson, Delve, Alemu, Ciuffreda and Lange (2009). Furthermore, Shipman and Marshall (2014) investigated the practice and attitude of gamers toward recording from games, discovering scepticism from gamers toward institutional archiving. To understand how to preserve online communities, Sköld (2013) investigated how gamers’ interactions in virtual communities formed their online environment. He looked into online communities to understand the socio-cultural practice of documenting using various theories, such as document theory and practice theory. In ‘Documenting virtual world cultures’, Sköld (2015) reported a case study of the massively multiplayer online role-playing game City of Heroes virtual community on Reddit documenting their memory making and documenting practice. He found that the gamers used online communities as a repository of gaming information and this repository played a role in reminiscing and in informing gamers.
In the broader social science field, video game research often focuses on issues such as addiction (Tejeiro and Morán, 2002; Kuss and Griffiths, 2012), aggression (Bushman and Anderson, 2002; Gentile, Lynch, Linder and Walsh, 2004; Anderson et al., 2010) or using games for education (Gee, 2003; Squire, 2003), but rarely on issues related to seeking game-related information. The information science research that does exist focuses on games or game players and can be broadly divided into three categories: game player types, games as information spaces and video game information behaviour. Literature in each of these categories will be briefly discussed below.
Game player typology and motivations
Many researchers, especially in human-computer interaction, have investigated player types and motivations: who plays what kinds of games, how and why. Much of this research stems from the Bartle Test (1996), an early classification of multiplayer online game player types (i.e., explorers, achievers, killers and socializers). This has since been challenged and refined by game experts, enthusiasts and scholars in popular media and scholarly literature. One of the model’s major limitations is the lack of explanation of multiple identities of players. In a later publication, Bartle himself acknowledges this, including other limitations of the model such as players’ change of style over time, assumptions of the independence of players and the independence of virtual worlds (Bartle, 2004). He adds another dimension (implicit vs. explicit) resulting in eight different types of players (opportunists, planners, hackers, scientists, friends, networkers, griefers and politicians). He also responded to the criticism of the model by pointing out that those studies also suffer from focusing on labelling differences for basic types or attempting to generalize the findings based on a limited survey pool (Bartle, 2014).
Despite the limitations, Bartle’s model undoubtedly had a significant impact in how we understand game players and has been successfully applied in many game-related domains. Yee (2005) expands Bartle’s approach by classifying different components of motivations: achievement, social and immersion, specifying subcomponents for each. Using data from 30,000 massively multiplayer online role-playing game players, Yee (2006) analysed demographics, motivations and derived experiences of the game, discovering differences between sexes in terms of motivation for playing.
Research on typologies of game players associated with psychological motivation has analysed players’ gaming patterns, styles and preferences. For instance, Bateman and Boon (2006) correlated personal profiles and skill sets with game preference from over 400 gamers, resulting in four play styles: conqueror, manager, wanderer and participant, each subdivided by hardcore and casual. Bateman, Lowenhaupt and Nacke (2011) go on to show how sex difference results in different patterns of social preferences for games, obsessive tendencies, and so on. Another approach to gamer typologies is viewing structural characteristics of video games as factors characterising the preferences of game players. Wood, Griffiths, Chappell and Davies (2004) examined gamers’ preferences for psycho-structural characteristics of games to identify which features of games they consider important. King, Delfabbro and Griffiths (2010) expanded Wood’s approach to understand which structural characteristics affect immersion and addictiveness. Schuurman, De Moor,De Marez and Van Looy (2008) also correlate gamers’ motivations with their socio-demographics to understand gamer types. They show that general motivations such as skill enhancement, time-passing and indulging can also be used as criteria for classifying player type.
Games as information spaces
Some researchers have explored the idea of video games as information spaces; in other words, how players navigate the information environment within games. Nardi (2008) takes an anthropological approach to establish concepts of how gamers perceive information provided within a game and how they search and share that information. She concludes that the Internet allows gamers to access this information more easily and in a less private way. She also notes that the information space fuses physical and virtual reality. Caroline (2011) investigates how visual, audio and audio-visual elements in game information environments affect gamers’ learning experiences, and how these elements complement each other to improve usability and immersion. Karlova and Lee (2012) discuss modifications (mods) and add-ons for multiplayer online games to suggest design elements for effective utilization of information in games. Harviainen (2012) investigates the information environment of games from a liminal perspective, applying the anomalous state of knowledge concept to understand how that relates to information uncertainty in video games.
Later research by Harviainen and Savolainen (2014) attempted to understand qualities of information in virtual worlds and how information plays a role in these worlds. They identified that information in the synthetic (virtual) world was characterized as power or symbolic capital. They also emphasized the importance of this type of study in understanding information system properties in the virtual world. The scope of these studies are somewhat different from our current work in that they mainly focus on investigating how players obtain information and create communities inside games. Beyond scholarly research, there are also a number of online databases and tools that attempt to address the problem of tracking and organizing games. There are also several subreddits (a type of online community focused on particular areas of interest) devoted to the question of what to play next; they offer interesting insights into a structured, self-regulated method for asking about and recommending games, which we aim to extend through our study.
Information behaviour and video games
Only a handful of studies have explored the information behaviour and seeking process of gamers. Adams (2005) provides a framework to understand massively multiplayer online role-playing game players and their motivation for playing games. Her research provides a theoretical background to explain information sharing behaviour and the meaning-making process in games based on play theory and information behaviour theory. Later, she attempts to understand how game players obtain information necessary for success in games and make meaning in the play space through existing frameworks such as everyday life information seeking and dramaturgy (Adams, 2009). Based on her analysis, she suggests using gaming to promote effective information seeking in libraries. Regarding information literacy of gamers, Martin (2012) investigates how the experience of using information related to video games reflects different identities of gamers. By analysing information horizon maps that participants drew as a visualisation of a game information seeking situation, she infers how gamers might perceive their own identities in the information space. She also demonstrates that various information needs exist across different demographics. Miller (2014) conducted a study investigating specific information needs of game design students, pinpointing the importance of supporting Web resources in libraries for the target group. Google published a white paper on gamers’ Web search behaviour (Getomer, Okimoto and Cleaver 2012), summarising the results of their analysis of game-related search terms. This showed that users’ information seeking patterns differ between pre- or post-launch stages.
There is clearly a wealth of research surrounding video games and information, from gaming in libraries to preserving games as cultural heritage artefacts. Work at the intersection of information and video games often explores the activities and/or social interactions conducted by game players, including how players find and use information within games while playing. Previous studies also show that different players (such as different types or sexes) may partake in different types of games and actions within and surrounding those games, some of which reflect implicit or explicit information behaviour. Taken together, these studies provide some basic insights into gamers’ information behaviour. However, many of the studies focus on in-game information behaviour, but do not address information related to games not yet played, or information relevant to other stakeholders in addition to players. Additionally, we still lack an in-depth understanding of how to relate relevant behaviour to the design of useful video game information retrieval systems, considering different user types and demographics.
Study design and method
The online survey was implemented using LimeSurvey, an open-source survey application. It included twenty-eight questions about users’ gaming experience; game-related information needs and preferred information sources; methods for game seeking, collection and organization; and demographics. The full questionnaire is included in the Appendix. In this paper we discuss the survey results regarding the following three aspects: 1) user types and identities, 2) game-related information needs and preferred sources of information, and 3) organization of, and access to, personal game collections.
Participants were people eighteen years or older who play video games and/or seek video game information for any reason. Survey invitations were distributed through various online and physical venues. Online venues included game-related mailing lists (e.g., ALA Connect - Games and gaming group, ATLUS forum, Reddit); Facebook groups (e.g., IGDA Seattle Facebook Group, Extra Credits Facebook Page); University of Washington Information School student, faculty and staff mailing lists; mailing lists in a number of companies such as Google; mailing lists of parent support groups, and researchers’ social networks. Physical venues included University of Washington Libraries, buildings on the University of Washington campus, and so on. Many users on social media also chose to share or forward invitation messages to friends and relevant communities. We attempted to reach not only avid gamers, but also people who may identify as casual gamers and/or others such as parents, educators, librarians, game industry employees, etc. This was important as we wanted to be able to reflect a wide variety of viewpoints. Participants were offered an opportunity to enter a raffle to win a total of $200 worth of Amazon gift cards. The respondents for this study were recruited relying on convenience sampling. While we made our best efforts to distribute the survey widely, invitations through multiple online and offline channels and collect a substantial number of responses to alleviate issues with convenience sampling, the limitation regarding the generalisability of the findings must be noted.
The survey was active for approximately seven weeks from 19 November, 2013, to 30 December, 2013. A total of 2,163 respondents participated and, of these, 1,257 completed the survey. Quantitative tabulation and analysis of responses were done in the SPSS statistical analysis package. We performed Chi-squared goodness-of-fit tests to determine whether the discrepancies between sexes and age groups were statistically significant.
Data and discussion
Respondents' demographics and characteristics
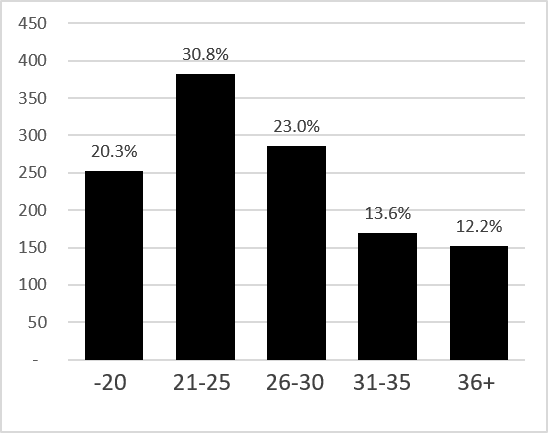
The average age of respondents was 27.2 years (standard deviation (SD) = 8.0) (Figure 1). The sex distribution was skewed towards males: 70.3% of respondents (884 out of 1,257) were male, 26.7% were female (335) and 1.7% (21) selected ‘other’. Of the respondents, 76.5% (961) described themselves as white or Caucasian, followed by 9.9% (125) Asian and 6.3% (79) Hispanic or Latino. The majority of respondents (72.5%) resided in the United States (911), followed by 4.9% in Canada (62) and 3.7% in the United Kingdom (47).
On average, the respondents had 18.6 years of video gaming experience (SD=7.1), which suggests that gaming experience often starts from an early age, especially considering the average age of respondents (twenty-seven years old). This resonates with responses from interviewees that they often remember playing with friends and family members as early as at four or five years old and that gaming was an important part of their childhood. Participants also indicated that they play role-playing games, strategy and puzzle games more frequently than the genres of driving or racing, music or dance, fighting and sports.
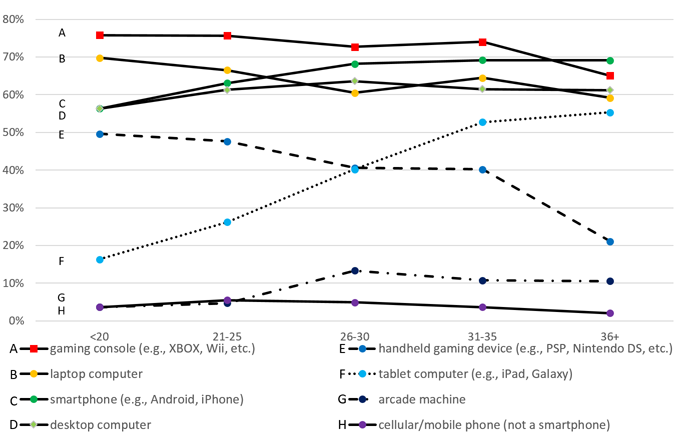
When asked about the devices that respondents currently use to play games, although gaming consoles were the most frequently selected option, laptop and desktop computers and smartphones also received substantial responses (Table 1: note that the fourth column contains the count and percentage of responses that specified 'other' or chose not to specify their sex). This suggests that personal computer and mobile gaming are increasingly prevalent in what used to be a more console-dominated environment. Many respondents use multiple devices to play games, with an average of 4.52 devices (SD = 1.45). Comparing device usage patterns between sexes, men use gaming consoles and desktop computers more often than women, and women use tablet computers more often than men. For other devices, the difference was not statistically significant. Across age groups (18-20, 21-25, 26-30, 31-35, and 36 and above), handheld gaming device, tablet, smartphone and arcade machines showed significant differences (Figure 2). The first two options showed the most drastic differences: the use of handheld devices dropped significantly as age increased, especially for users aged thirty-six years and older, whereas the use of tablets increased as users got older.
| Type of device | Male | Female | Other/no answer | Chi-squared (p) | Count (Percentage) |
|---|---|---|---|---|---|
| Gaming console (e.g. XBOX, Wii) | 665 (75.2%) | 231 (69.0%) | 23 (59.0%) | 4.91 (0.027) | 919 (73.1%) |
| Laptop computer | 578 (65.4%) | 209 (62.4%) | 22 (56.4%) | 0.95 (0.329) | 809 (64.4%) |
| Smartphone (e.g. Android, iPhone) | 559 (63.2%) | 230 (68.7%) | 18 46.2%) | 3.13 (0.077) | 807 (64.2%) |
| Desktop computer | 575 (65.0%) | 166 (49.6%) | 20 (51.3%) | 24.46 (0.000) | 761 (60.5%) |
| Handheld gaming device (e.g. PSP, Nintendo DS) | 374 (42.3%) | 140 (41.8%) | 14 (35.9%) | 0.03 (0.869) | 528 (42.0%) |
| Tablet computer (e.g. iPad, Galaxy) | 272 (30.8%) | 147 (43.9%) | 12 (30.8%) | 18.51 (0.000) | 431 (34.3%) |
| Arcade machine | 68 (7.7%) | 30 (9.0%) | 2 (5.1%) | 0.52 (0.469) | 100 (8.0%) |
| Cellular (mobile) phone (not a smartphone) | 36 (4.1%) | 14 (4.2%) | 4 (10.3%) | 0.01 (0.933) | 54 (4.3%) |
| Others | 8 (0.9%) | 8 (2.4%) | 0 (0.0%) | 4.13 (0.042) | 16 (1.3%) |
User types
To understand why respondents were interested in video games, we asked them to select types of user groups that best described themselves: avid gamer, casual gamer, game collector, parent of young gamer, game developer/designer, other gaming industry professional, curator or librarian of a video game collection, teacher who is interested in using games for education, academic or scholar who does video game-related research, student pursuing a career related to video games, or ‘other’ to further specify additional user types (Q3). We did not limit how many user groups could be selected, since one person may represent multiple user types. Avid gamer had the highest number of responses, followed by casual gamer (Table 2).
| Identity | Male | Female | Other/no answer | Chi-squared (p) | Count (Percentage) |
|---|---|---|---|---|---|
| Avid gamer | 672 (76.0%) | 121 (36.1%) | 20 (51.3%) | 170.11 (0.000) | 813 (64.7%) |
| Casual gamer | 348 (39.4%) | 238 (71.0%) | 16 (41.0%) | 5.03 (0.025) | 602 (47.9%) |
| Game collector | 232 (26.2%) | 38 (11.3%) | 7 (17.9%) | 31.28 (0.000) | 277 (22.0%) |
| Student pursuing a career related to video games | 122 (13.8%) | 24 (7.2%) | 7 (17.9%) | 10.15 (0.001) | 153 (12.2%) |
| Game developer or designer | 118 (13.3%) | 12 (3.6%) | 6 (15.4%) | 24.32 (0.000) | 136 (10.8%) |
| Parent of young gamer(s) | 38 (4.3%) | 38 (11.3%) | 0 (0.0%) | 20.62 (0.000) | 76 (6.0%) |
| Academic or scholar who does video game related research | 38 (4.3%) | 12 (3.6%) | 3 (7.7%) | 0.32 (0.573) | 53 (4.2%) |
| Teacher who is interested in using games for education | 25 (2.8%) | 22 (6.6%) | 2 (5.1%) | 9.16 (0.002) | 49 (3.9%) |
| Other gaming industry professional (i.e., NOT game developer or designer) | 35 (4.0%) | 12 (3.6%) | 1 (2.6%) | 0.09 (0.760) | 48 (3.8%) |
| Curator or librarian of a video game collection | 15 (1.7%) | 15 (4.5%) | 1 (2.6%) | 7.83 (0.005) | 31 (2.5%) |
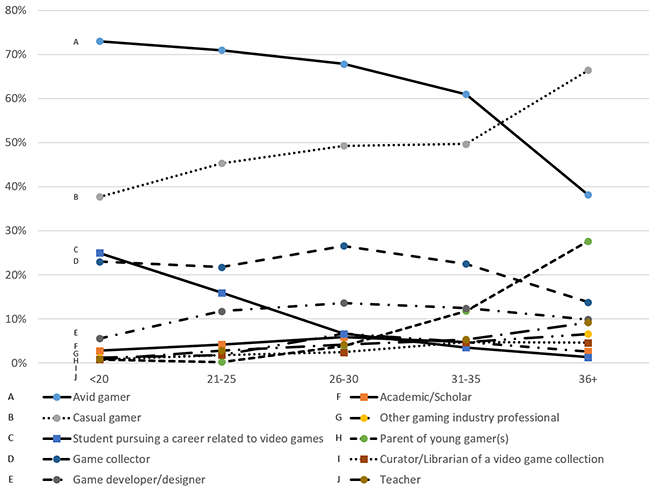
The pattern of responses regarding avid or casual gamer significantly differed by sex: 76% of male respondents considered themselves avid gamers compared to only 36.1% of female respondents. On the contrary, 71% of female respondents identified as casual gamers compared to 39.4% of male respondents. When considering age groups, avid gamer was most frequently selected by all age groups except for respondents over thirty-five years (Figure 3). Respondents were also asked to indicate game genres with which they are most familiar (Q6). We found that action, driving or racing, music or dance, puzzle, simulation and sports genres were selected more frequently by casual than by avid gamers. Action and adventure, fighting, role-playing games, shooter and strategy genres were selected by more avid gamers than casual gamers. These statistics show that respondents who are female, over thirty-five years of age and most familiar with genres who tend to have shorter game sessions identify themselves more often as casual gamers. In terms of years of game-playing experience, the discrepancy between the average values for avid versus casual gamers was 1.69 years (18.4 years for avid and 16.7 years for casual gamers) which was statistically significant (z = -2.756, p=0.006; t(573) =-2.771, p=0.000). These statistics were based on a comparison of respondents who selected avid player only versus those who selected casual player only.
However, over half of respondents (51.7%) selected two or more user groups. On average, each respondent chose 1.8 identities (SD=1). Among respondents who selected combinations of user groups, avid gamer and collector were selected together most often (100), followed by avid gamer and casual gamer (89). There were also users who selected avid gamer, casual gamer and another user group (e.g., avid gamer + casual gamer + collector (27), avid gamer + casual gamer + developer or designer (22)). This overlap between avid and casual gamer illustrates the problem of simply categorising game players as either avid (hardcore) gamers or casual gamers. Regarding casual gamers, Juul (2010) argues that the boundary between hardcore gamers and casual gamers is not clear-cut because hardcore gamers are likely to play both casual and hardcore games depending on the context (e.g., playing role-playing games at home in the evening, but playing a puzzle game app on the bus) and casual gamers also devote substantial amounts of time to gaming. He explains how stereotypical hardcore players may find that they have less time for gaming due to lifestyle changes (e.g., family, jobs), which dovetails with what some of our previous interviewees discussed (e.g., ‘I’d have said [I was a] serious [gamer] a few years ago and casual now... My daughter takes up enough of my time that I can’t play as often as I like.’ (P24)). This is also consistent with Bartle’s argument that player types may change over time and depending on the context (2004). In our study, we chose not to provide strict definitions for avid and casual gamer and rely on users to follow their understanding of those user groups. In a future study, it may be fruitful to engage in a deeper exploration on how these user groups are perceived and what criteria are used for determining a player as avid or casual.
We also observed that parents, teachers, and librarians/curators more commonly identified themselves as casual gamers rather than avid gamers. While the distinction between casual and avid gamers is not clear, this may mean that these user groups tend to have either less knowledge, familiarity with, passion for, or involvement in video games than those who identified themselves as avid gamers. This does seem to affect the kind of game information they find useful for searching/browsing video games (further discussion in the following section).
Relevant metadata and preferred information sources
We asked respondents to review the elements in our metadata schema and evaluate their usefulness. The metadata schema was developed based on user input received through semi-structured interviews on what users consider to be the most important type of game-related information (Lee et al., 2013; Lee et al., 2015b). Respondents to our survey exhibited the desire to find and use a wide variety of game-related information, both about games they were currently playing and/or when looking to purchase new games (Table 3). In Getomer et al. (2012), they also found that approximately 40% of Web searches on video games occur in the pre-launch period, illustrating the importance of game information before purchasing the game. Overall, users are interested in practical aspects first and foremost: information about cost and the platform(s) on which a game could be played ranked highest as desirable information when seeking new games.
| Metadata element | Games currently playing | Percentage | Seeking new games | Percentage | Count | Percentage (n=1,257) |
|---|---|---|---|---|---|---|
| Price | 245 | 19.5 | 998 | 79.4 | 1034 | 82.3% |
| Platform | 594 | 47.3 | 956 | 76.1 | 1026 | 81.6% |
| Genre | 589 | 46.9 | 930 | 74.0 | 996 | 79.2% |
| Series | 533 | 42.4 | 881 | 70.1 | 953 | 75.8% |
| Style | 528 | 42.0 | 864 | 68.7 | 922 | 73.3% |
| Gameplay videos | 510 | 40.6 | 798 | 63.1 | 895 | 71.2% |
| Plot or narrative | 636 | 50.6 | 758 | 60.3 | 893 | 71.0% |
| Franchise or universe | 476 | 37.9 | 801 | 63.7 | 859 | 68.3% |
| Theme | 505 | 40.2 | 776 | 61.7 | 843 | 67.1% |
| Mood or affect | 543 | 43.2 | 738 | 58.7 | 838 | 66.7% |
| Title | 643 | 51.2 | 599 | 47.7 | 822 | 65.4% |
| System requirements | 394 | 31.3 | 728 | 57.9 | 797 | 63.4% |
| Developer | 307 | 24.4 | 730 | 58.1 | 774 | 61.6% |
| Setting | 427 | 34.0 | 641 | 51.0 | 717 | 57.0% |
| Format | 389 | 30.9 | 619 | 49.2 | 716 | 57.0% |
| Trailers | 156 | 12.4 | 690 | 54.9 | 713 | 56.7% |
| Number of players | 453 | 36.0 | 586 | 46.6 | 692 | 55.1% |
| Distributor | 392 | 31.2 | 613 | 48.8 | 685 | 54.5% |
| Retail release date | 114 | 9.1 | 656 | 52.2 | 684 | 54.4% |
| Presentation | 396 | 31.5 | 610 | 48.5 | 674 | 53.6% |
Over 70% of respondents also indicated that content-based game information, such as genre, style and plot, was useful for games they are currently playing or when seeking games to play. Relationship information, such as series, franchise and universe, was also highly valued. Visual information like gameplay videos, trailers and screenshots were popular resources when seeking new games. This aligns with the findings in Google’s report on gamers’ Web search behaviour where they noted the popularity of trailer and image in the search patterns (Getomer et al., 2012). In our earlier interviews, participants indicated their ability to glean multiple types of information from these sources: users easily recognize genre, artistic style, gameplay and mood from viewing an image or video.
Information perceived as most useful varied between sexes (Table 4). While the percentage of respondents of each sex often indicated a similar perception of usefulness for specific information elements, overall order reveals interesting differences. For instance, respondents of both sexes rated price information highly relevant (81.8% for men, 85.4% for women). However, price information was the most commonly selected response for women, while male respondents selected platform and genre information more frequently. Men seem to find content-based information like style, plot and mood more useful, while women are more interested in technical information like format and system requirements. Based on this data, it appears that men may tend to view games as experiences and thus seek information representing this view, while women think of games as objects or commodities, which affects the types of information they perceive as useful. This division of information seeking according to sex may also be related to the types of gamers men and women are: as discussed earlier, substantially more men identify themselves as avid gamers, whereas more women identify as casual gamers. Age also affected how much users value game metadata; Chi-squared tests revealed statistically significant differences for most options across age groups, with the same pattern of increased positive responses in younger user groups. The only two types of metadata with no statistically significant difference across age groups were screenshots and official Websites.
| Male | Female | ||
|---|---|---|---|
| Element | Percentage | Element | Percentage |
| Platform | 83.6% | Price or list price | 85.4% |
| Genre or gameplay | 82.5% | Platform | 79.7% |
| Price or list price | 81.8% | Genre or gameplay | 73.1% |
| Style | 79.0% | Series | 69.9% |
| Series | 79.0% | Plot or narrative | 66.3% |
| Gameplay videos | 77.6% | Title | 64.8% |
| Plot or narrative | 74.0% | Theme | 63.9% |
| Franchise or universe | 71.3% | Format | 63.3% |
| Mood or affect | 69.7% | System requirements | 62.7% |
| Developer | 69.1% | Franchise or universe | 62.1% |
Users searching for information regarding new game purchases relied on a variety of sources (Table 5). By a large margin, the most common way for users to gain information about new games was to hear about it from other people, such as friends and family. This may be purposefully solicited (i.e., asking friends and family for information) or passively received (i.e., information coming up in conversation unprompted by a request). While this information might be exchanged face-to-face, users also receive this information through digital means. Social media such as Facebook and Twitter were highly used information sources, reflecting digital connections with friends and family as well as other sources like journalists, bloggers and game company marketing. We speculate that this emphasis and reliance on personal sources of information may be for many reasons, including trust, authority and familiarity (i.e., friends and family being familiar with a particular user’s interests and tastes). In this regard, video games are similar to other media such as books, movies and music, where recommendations from friends, family members and co-workers are important (Lee, Cho and Kim, 2015a; Ross and Chelton, 2001).
| Source of information | Male | Female | Other or no answer | Chi-squared (p) | Count (Percentage) |
|---|---|---|---|---|---|
| Recommended by friends or family | 614 (69.5%) | 261 (77.9%) | 25 (64.1%) | 8.57 (0.003) | 900 (71.6%) |
| Game information Websites (e.g., Game Trailers, GameSpot, 1Up) | 557 (63.0%) | 116 (34.6%) | 20 (51.3%) | 79.14 (0.000) | 693 (55.1%) |
| Game distribution platform (e.g., Steam) | 534 (60.4%) | 97 (29.0%) | 17 (43.6%) | 96.25 (0.000) | 648 (51.6%) |
| Social media Website (e.g., Facebook, Twitter) | 416 (47.1%) | 187 (55.8%) | 15 (38.5%) | 7.46 (0.006) | 618 (49.2%) |
| Online video site (e.g., YouTube) | 506 (57.2%) | 88 (26.3%) | 19 (48.7%) | 93.27 (0.000) | 613 (48.8%) |
| Online advertisements | 418 (47.3%) | 120 (35.8%) | 15 (38.5%) | 12.95 (0.000) | 553 (44.0%) |
| Online gaming forums and video game blogs | 375 (42.4%) | 70 (20.9%) | 14 (35.9%) | 48.56 (0.000) | 459 (36.5%) |
| Saw it or played it in person | 314 (35.5%) | 119 (35.5%) | 9 (23.10%) | 0.00 (1.000) | 442 (35.2%) |
| Apps store (e.g., iOS apps store, Google Play) | 213 (24.1%) | 115 (34.3%) | 8 (20.50%) | 12.94 (0.000) | 336 (26.7%) |
| Online game market (e.g., PlayStation Network, Xbox Live Arcade, Wii/Wii U Shop Channel) | 195 (22.1%) | 60 (17.9%) | 11 (28.2%) | 2.53 (0.112) | 266 (21.2%) |
| The publisher or developer’s Website | 197 (22.3%) | 52 (15.5%) | 8 (20.50%) | 6.84 (0.009) | 257 (20.4%) |
| Commercial retail Websites | 154 (17.4%) | 70 (20.9%) | 5 (12.80%) | 1.96 (0.162) | 229 (18.2%) |
| TV advertisements | 148 (16.7%) | 41 (12.2%) | 2 (5.10%) | 3.76 (0.052) | 191 (15.2%) |
| In a brick-and-mortar store | 114 (12.9%) | 62 (18.5%) | 4 (10.30%) | 6.19 (0.013) | 180 (14.3%) |
| Printed gaming magazine | 111 (12.6%) | 39 (11.6%) | 5 (12.80%) | 0.19 (0.665) | 155 (12.3%) |
| Printed non-gaming magazine or newspaper | 28 (3.20%) | 13 (3.90%) | 0 (0.00%) | 0.38 (0.538) | 41 (3.30%) |
A sex divide showed women especially relied on these personal connections, identifying friends ot family and social media as their most frequent sources of information when looking for new games. While men also cited seeking recommendations from friends and family as the most common form of information behaviour, the difference was statistically significant (Table 5). Information from social media, the second most popular source of information for women, was the sixth most popular method for men. Men were much more likely to seek and use information from game information Websites, specific digital game distribution platforms, online video sites, online advertisements, gaming forums and blogs, and specific publisher and/or developer Websites. In contrast, besides socially shared information, women were more likely to find information from apps stores (34.3% vs. 24.1%) and physical stores (18.5% vs. 12.9%). This suggests that women tend to seek game-related information at the purchase stage, compared to men who seek information both before and after purchase.
This sex divide not only reflects differences in information seeking preferences and sources, but may also affect and be affected by the types of information conveyed by these channels as well as the types of games they typically address. For instance, sources indicated as preferable by men tend to allow for and offer more user-generated information about games, such as other players’ opinions in the form of blog entries, forum posts and reviews or other players’ shared experiences via walkthroughs or screen captures on video sharing sites like YouTube. Men also reported relying on advertising more than women, who tended to prefer information disseminated through digital or physical stores. This finding may indicate that women tend to seek game information when they intend to buy, or perhaps game-related information is more influential on women’s purchasing decisions, thus increasing conversion rates. Women's preferences for stores may also reflect a level of trust in sources traditionally considered to be more objective. Despite the possibility of marketing propaganda, information from the publisher or distributor (such as that provided by a store or marketplace) may be considered by some to be more authoritative and reliable than unvetted information contributed by users. Additionally, women may turn to stores for information because they feel alienated and/or offended by other sources clearly designed for a male audience.
While differences in preference across age groups for information from social media, gaming forums/blogs, publisher or developer Websites, online gaming marketplaces, non-game retail sites, television advertising and printed magazines (gaming and general interest) were statistically insignificant, other methods for information seeking did show significant differences based on age (Figure 4). For instance, preferences for retrieving information from specific game distribution platforms, game information Websites, online video sites, online advertising and even in-person information showed statistically significant declines (p ≤ 0.005). Conversely, preferences for finding information through app stores increased as age increased (p=0.000). This corresponds with previously described findings that female respondents tended to be older (t(1211) = -9.18, p =0.000 / Z = -7.88 p < 0.0001) and prefer these types of sources (X2(2) = 13.64, p = 0.001). A closer look reveals that use of all information sources generally decreases as users get older, with the exception of app stores, which are used more often by older users.
When searching for game information online, participants reported many preferences for specific Websites. Most preferences were for sites specifically catering to video game information. However, two of the most preferred sites shown in Table 6, YouTube and Wikipedia, are general information sites not specific to video games. YouTube provides access to videos regarding games, including trailers, gameplay footage (with or without commentary), walkthroughs and various game-related channels such as Let’s Play videos, all serving different information needs. YouTube was preferred overall for its quantity of content (‘Youtube has seemingly infinite reviews and videogame related things to view’) and ease of use (‘YouTube is pretty self-explanatory. It's probably the best user-video service out there, so it's very easy to find gameplay videos, trailers, walkthroughs, soundtracks, and so much more.’). Respondents valued actual gameplay footage because it offered a sense of what a game was like in a more direct way than a verbal description and also because this demonstration authentically represented the unbiased actual appearance and function of a game, unaffected by advertisements or marketing propaganda.
| Website | Male | Female | >Other or missing | Chi-squared (p) | Count (Percentage) |
|---|---|---|---|---|---|
| YouTube | 560 (63.3%) | 151 (45.1%) | 21 (53.8%) | 33.38 (0.000) | 732 (58.2%) |
| Steam | 531 (60.1%) | 112 (33.4%) | 16 (41%) | 69.15 (0.000) | 659 (52.4%) |
| Wikipedia | 444 (50.2%) | 152 (45.4%) | 14 (35.9%) | 2.29 (0.130) | 610 (48.5%) |
| IGN.com | 331 (37.4%) | 97 (29.0%) | 8 (20.5%) | 7.68 (0.006) | 436 (34.7%) |
| GameFAQs | 307 (34.7%) | 96 (28.7%) | 15 (38.5%) | 4.05 (0.044) | 418 (33.3%) |
| The Escapist | 314 (35.5%) | 53 (15.8%) | 10 (25.6%) | 44.8 (0.000) | 377 (30.0%) |
| Kotaku | 263 (29.8%) | 62 (18.5%) | 10 (25.6%) | 15.71 (0.000) | 335 (26.7%) |
| Metacritic | 246 (27.8%) | 34 (10.1%) | 5 (12.8%) | 42.91 (0.000) | 285 (22.7%) |
| GameSpot | 193 (21.8%) | 62 (18.5%) | 6 (15.4%) | 1.62 (0.203) | 261 (20.8%) |
| Gamasutra | 125 (14.1%) | 28 (8.4%) | 3 (7.7%) | 7.4 (0.007) | 156 (12.4%) |
| Joystiq | 114 (12.9%) | 27 (8.1%) | 3 (7.7%) | 5.55 (0.018) | 144 (11.5%) |
| GameTrailers | 95 (10.7%) | 7 (2.1%) | 2 (5.1%) | 23.75 (0.000) | 104 (8.3%) |
| GiantBomb | 75 (8.5%) | 12 (3.6%) | 1 (2.6%) | 8.81 (0.003) | 88 (7.0%) |
| 1Up | 45 (5.1%) | 9 (2.7%) | 1 (2.6%) | 3.32 (0.069) | 55 (4.4%) |
| MobyGames | 21 (2.4%) | 9 (2.7%) | 0 (0.0%) | 0.1 (0.754) | 30 (2.4%) |
| Allgame | 9 (1.0%) | 7 (2.1%) | 0 (0.0%) | 2.15 (0.142) | 16 (1.3%) |
| Neoseeker | 8 (0.9%) | 6 (1.8%) | 0 (0.0%) | 1.68 (0.195) | 14 (1.1%) |
Participants also indicated using Wikipedia to find rich information about video games, including anything from genre and mood, to development history, to character names and actors, to other related games and media. The general coverage of Wikipedia served as a starting point, especially when users knew very little about a game: ‘If I know nothing about the game, then Wikipedia is a good start - I'm interested in genre, release date, a brief description, and how it was received’. Responses indicate that this is particularly evident for older games that may not be covered by contemporary gaming Websites.
Wikipedia also provides a quick way to look up details on games, offering a fast, familiar and easy-to-navigate interface for many users. Wikipedia also aggregates multiple types of information of interest to users and presents it all in one place. A few respondents even mentioned enjoying the experience of navigating Wikipedia itself, such as one who said it is ‘fun to ‘fall down the rabbit hole’’. Respondents also mentioned using Wikipedia because it offered more factual and unbiased information compared to other sources, which is interesting considering that anyone can edit the site’s content. There seemed to be an underlying, and perhaps unjustified, trust that content of Wikipedia pages would be correctly maintained by game enthusiasts.
Between sexes, most sources were used more heavily by men than women, with a few exceptions where the discrepancy was less severe. For all options, the proportion of men who answered positively always outnumbered women. Across age groups, YouTube, Steam, Wikipedia and GameFAQs were also used significantly more by younger users. Older users preferred using YouTube, Steam and Wikipedia, but also used informational Websites like IGN, Kotaku or Gamespot as much as or more than younger users (Figure 5). Overall, young men were the user group that most actively used these different information sources.
While respondents used different Websites and sources to access information, some common qualities of both the information itself and the sources emerged. Respondents wanted information that was comprehensive and detailed. Participants were divided in regards to the perspectives of the information: some wanted factual information about games and unbiased commentary, while others valued information with a particular point of view, such as the personalities of the writers: ‘For giant bomb and the escapist, I know the personalities on that site, and I can thus know what weight to give their recommendations given how their tastes align with my tastes’.
Regardless of which perspective they preferred, respondents wanted the information and the perspectives to be reliable and consistent, so they could count on similar information when they needed it. In addition to addressing information needs, other factors affecting selection of sources included ease of use, quick access, aggregation of information in one location, the layout and design of the site, its reputation, and personal frequency of use and familiarity. Many respondents also valued sources that supported interactive information sharing and community building through tools like blogs, comments and forums. Steam and YouTube were two of the main sites specifically noted as providing community interactions around the games they promote or support.
Organization of physical and digital video games
With the rapid change in distribution methods for video games, it is important to know users’ opinions about physical versus digitally distributed games. The increasing prevalence of streaming games may also affect how people think about access versus ownership of games. We also wanted to gain some insights into what kinds of organizational frameworks might be useful in game information systems by first learning how people organize their personal game collections. To clearly communicate what we meant by physical and digital games, we provided definitions as follows: physical video games - video games with a physical component, such as games accessed via a cartridge, disc, etc., and digital video games - video games that are digitally downloadable, streaming or somehow accessible without a physical component such as cartridge, disc, etc.
The average number of games respondents owned was 65.8 for physical (SD = 178.58) and 30.6 for digital games (SD = 30.6) [Q11 and Q14]. One thing to note is that size of personal collection may not directly correlate with how often a person uses the collection, because many digital games can be accessed online without having to own the game (e.g., playing Candy Crush Saga on Facebook). When asked which format they prefer and why, respondents gave a variety of reasons for both physical and digital games. For physical games, it often had to do with the sense of ownership (e.g., ‘Physical games, because digital games don't quite feel like your possession’), being able to hold or display tangible objects (e.g., ‘You can store physical ones, order them, hold it in your hands, skim through the manual, enjoy the cover-art and box (or additional goodies)’), or the nostalgic feelings evoked by looking at the games (e.g., ‘you are reminded of the game and how your life was when you were playing it’). Many responses also alluded to people’s distrust in game distributors with regard to the security, stability and continued access to the games, and justifiably so, based on recent incidents with Sony PlayStation Network and Xbox Live (e.g., ‘I'm not comfortable with giving Sony my card information’, ‘Company revokes the game or reg key, or it is only available to play if you have an active internet connection’).
Convenience was an important factor for respondents preferring digital games. They mentioned ease of access and storage of games (e.g., ‘No need to locate and insert physical media when installing or playing the game’, ‘it is now feasible to store a large digital collection on a single disk drive’), and freedom from worry about damage (e.g., ‘I prefer having a license tied to an account than a physical disk that can break or degrade’). Another positive aspect was that users can re-download games whenever they need them (e.g., ‘Being able to recover your save files and games in the event of a console failure is excellent’). Many users still had both physical and digital games, but felt that they were slowly moving to primarily owning digital games. User context (e.g., location; personal situation, such as being around children) also affected decisions to move on to digital games (e.g., ‘I also own a toddler, they eat physical media’). Overall, users’ desire or enjoyment seemed more important for physical games, whereas for digital games, functionality (e.g., ease of use, convenience and inexpensive price) was a dominant influence.
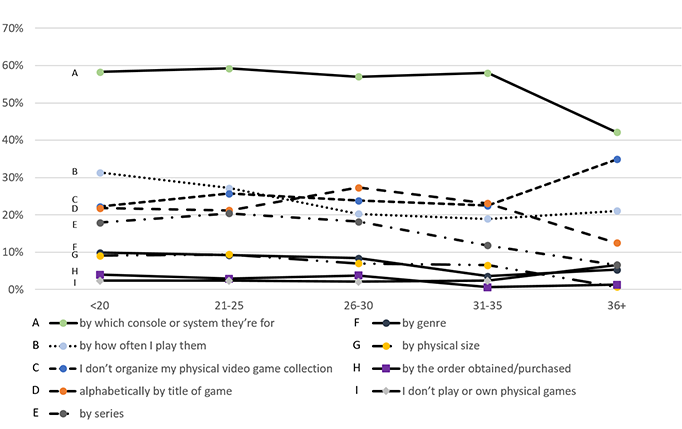
We also sought insights into what kinds of organization options should be provided in game information systems by asking how respondents build and organize their own game collections. For physical games, platform (console/system) was the primary method for organization, selected by 55.7% of the respondents, followed by frequency of use (24.6%) and alphabetical order of titles (21.6%) (Table 7). Almost half of the respondents (47.4%) selected more than one method, suggesting that a mix of different organizational criteria is fairly common. Approximately a quarter of respondents answered that they do not organize their collection (25.1%). Examples of other specified organizational systems include: personal preference (e.g., by favourites, how cherishable they are, how much I enjoyed them, my personal evaluation of their fun-value), appearance (e.g., colour of the case, looks), probability of replay in the near future, publisher, played/yet to play categories, and age appropriateness.
| Organization method | Male | Female | Other or no answer | Chi-squared (p) | Count (Percentage) |
|---|---|---|---|---|---|
| Console or system | 526 (59.5%) | 156 (46.6%) | 18 (46.2%) | 16.49 (0.000) | 700 (55.7%) |
| No organization | 225 (25.5%) | 83 (24.8%) | 8 (20.5%) | 0.06 (0.808) | 316 (25.1%) |
| Frequency of use | 232 (26.2%) | 72 (21.5%) | 5 (12.8%) | 2.93 (0.087) | 309 (24.6%) |
| Alphabetical by title | 195 (22.1%) | 70 (20.9%) | 7 (17.9%) | 0.19 (0.660) | 272 (21.6%) |
| Series | 158 (17.9%) | 40 (11.9%) | 10 (25.6%) | 6.29 (0.012) | 208 (16.5%) |
| Genre | 67 (7.6%) | 24 (7.2%) | 7 (17.9%) | 0.06 (0.806) | 98 (7.8%) |
| Physical size | 72 (8.1%) | 16 (4.8%) | 4 (10.3%) | 4.12 (0.042) | 92 (7.3%) |
| Order obtainedor purchased | 30 (3.4%) | 4 (1.2%) | 1 (2.6%) | 4.34 (0.037) | 35 (2.8%) |
There were statistically significant differences between sexes and age groups regarding organization of physical games. Men organized games by console, series, physical size and order obtained more often than women, which partly seems to be because women play or own fewer physical games than men. Across age groups, users older than thirty-five years were much less likely to organize games by console and less likely to organize their collections at all. Considering that many users go through a change of lifestyle as they get older and have less time to play overall, it also makes sense that they have less time to devote to organizing their game collections.
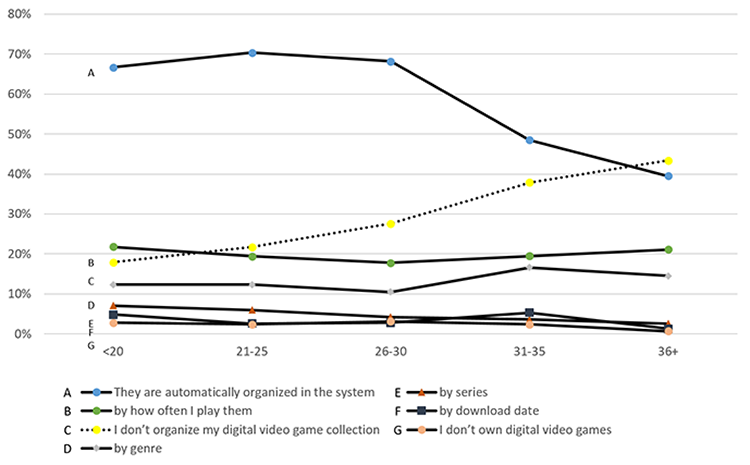
For digital games, 62.2% responded that they rely on automatic organization of games within systems like Steam (Table 8). About one out of five respondents (19.5%) organized games by how often they play them and 12.6% organized by genre. Approximately a quarter of respondents did not organize their digital games in any way. Examples of responses for the ‘other’ option include: favourites (‘I keep a few in favorites menu’, ‘my personal liking of them’), interest in playing the game, the financial state of the developer (i.e., indie, AAA (large well-financed companies)), free or paid games, played or yet to play, single vs. multiplayer, primary player (e.g., ‘who prefers to play them: me, my husband, or for our son as primary gamer’) and emulator. Some felt that organization of digital games was not necessary because the games they play are accessed through social media such as Facebook or the developer’s Website. Similar to physical games, women and older users were less likely to organize their digital games. Younger users responded that their games are automatically organized in the system significantly more than older users, which is most likely because Steam users tend to be younger.
| Organization Method | Male | Female | Other or no answer | Chi-squared (p) | Count (Percentage) |
|---|---|---|---|---|---|
| They are automatically organized in the system (e.g., Steam) | 617 69.8%) | 144 (43.0%) | 21 (53.8%) | 74.45 (0.000) | 782 (62.2%) |
| I don’t organize my digital video game collection | 211 (23.9%) | 121 (36.1%) | 6 (15.4%) | 18.4 (0.000) | 338 (26.9%) |
| By how often I play them | 173 (19.6%) | 69 (20.6%) | 3 (7.7%) | 0.16 (0.688) | 245 (19.5%) |
| By genre | 112 (12.7%) | 41 (12.2%) | 5 (12.8%) | 0.04 (0.839) | 158 (12.6%) |
| By series | 47 (5.3%) | 15 (4.5%) | 1 (2.6%) | 0.35 (0.552) | 63 (5.0%) |
| By download date | 28 (3.2%) | 12 (3.6%) | 1 (2.6%) | 0.13 (0.717) | 41 (3.3%) |
For digital games specifically, we asked respondents about shortcuts or tools they employ to access games. Over half of the respondents answered that they use desktop shortcuts (54.9%) or folders or smartphone screens (51.6%). Bookmarks and toolbars were also used by 218 respondents (17.3%). ‘Other’ responses were predominantly Steam (212 out of 244) with a few responses mentioning PSN (PlayStation Network) or Xbox Live. This illustrates that using an Internet-based digital game distribution platform is a primary method for respondents’ access to digital games, more so than purchasing digital games through console-based gaming and digital media delivery services. When compared between sexes and among age groups, more women and older participants used folders or smartphone screens whereas more men and younger participants used desktop shortcuts, which seems consistent with patterns we saw on device usage.
We also asked about what people do when they are no longer interested in particular games. The proportion of respondents who answered that they keep the game as part of their game collection was higher for physical games (79.0%) than digital games (59.3%) (Table 9). For physical games, keeping the game was the dominant answer whereas for digital games, the most common answer was to delete or uninstall the game. Respondents rarely threw away physical games (1.9%) but often deleted digital games (63.7%), most likely because they can easily be downloaded again. Trading or selling the used game were also fairly common activities for physical games (19.3% and 20.4%, respectively) as well as giving it to someone else (26.2%). One of the most common ‘other’ responses for digital games was to just take no action and ‘forget about it’.
| Type | Actions taken | Male | Female | Other or no answer | Chi-squared (p) | Count (Percent) |
|---|---|---|---|---|---|---|
| Physical games | Keep the game as part of your collection | 743 (84.0%) | 228 (68.1%) | 22 (56.4%) | 38.33 (0.000) | 993 (79.0%) |
| Give the game to friends | 242 (27.4%) | 80 (23.9%) | 7 (17.9%) | 1.53 (0.217) | 329 (26.2%) | |
| Sell the game | 185 (20.9%) | 63 (18.8%) | 8 (20.5%) | 0.67 (0.411) | 256 (20.4%) | |
| Trade the game for another game | 170 (19.2%) | 68 (20.3%) | 5 (12.8%) | 0.18 (0.670) | 243 (19.3%) | |
| Throw the game away | 21 (2.4%) | 3 (0.9%) | 0 (0%) | 2.76 (0.097) | 24 (1.9%) | |
| Digital games | Delete or uninstall game | 576 (65.2%) | 208 (62.1%) | 17 (43.6%) | 1.00 (0.318) | 801 (63.7%) |
| Keep it as part of your digital game collection | 556 (62.9%) | 170 (50.7%) | 19 (48.7%) | 14.89 (0.000) | 745 (59.3%) | |
| Move game to another folder or location | 123 (13.9%) | 55 (16.4%) | 10 (25.6%) | 1.22 (0.269) | 188 (15.0%) |
When compared between sexes, men significantly more often kept games they were no longer interested in as part of their collection both in physical or digital format. Keeping the game as part of the collection was also the only option with a statistically significant difference across age groups; younger users were generally more likely to keep games compared to older users. These statistics show that young men are the most likely user group to build video game collections compared to other user groups.
Organization did not seem to be such a critical issue for physical game collections because collection size tends to be small. Digital collections seemed to have more organizational issues. The fact that the same game can be purchased through many different game providers means that games are often not organized in the same system/service. This can result in people having to manage games through multiple systems (e.g., ‘Desura vs. Steam’) and also a lack of awareness of which games people actually own (e.g., ‘I bought Neverwinter 2 twice, because I couldn't remember what service the first copy was on’). Digital collections were less fluid, with fewer options regarding games people are no longer interested in. Once people purchase games, it is difficult and/or impossible to re-sell, trade or gift digital games. Additionally, it is easy to delete games from local devices, but difficult to remove a game permanently from a user’s account.
Conclusion and future work
In this study, we sought to answer research questions regarding the information needs, sources and organization methods regarding video games and related information. We were also interested in whether or not there are any differences between sexes and age groups. We discovered the following findings for each of the questions:
RQ1. What kinds of information needs surrounding games do video game users exhibit?
-
In addition to basic descriptive game metadata, content-based, visual, relationship metadata are also important for video games.
While previous studies focused on limited game-related metadata (such as Martin (2012)), our use of extended metadata in this research allowed a more comprehensive understanding of what information is required by gamers throughout their gaming experience. Descriptive game metadata, such as platform and price information, were definitely important, but content-based game information (e.g., genre, style, plot), visual metadata (e.g., gameplay videos) and relationships between games (e.g., series, franchise or universe) were also deemed useful by a substantial proportion of users. - Regarding information sources, Websites such as YouTube, Steam and Wikipedia were dominantly used for game information.
The popularity of those Websites mostly stemmed from their visual nature, convenience and comprehensiveness. In particular, many users followed game-related YouTube channels to gather information and watched a variety of video game play footage.
RQ2. How do users organize and access their game collections?
- Utility-based organization methods (e.g., by platform, by frequency of use) were commonly used for both physical and digital games.
For physical games, over half of the respondents organized their collections by platform and approximately a quarter of respondents organized by frequency of use. For digital games, although the frequency of use was the most commonly used method, most users relied on automatic organization provided by the system. Also a substantial number of respondents did not organize their collection, physical or digital. For accessing digital games, desktop shortcuts or folders/smartphone screens were predominantly used.
- While the organization of personal collection was not a critical issue to most users, they did express dissatisfaction in the lack of automatic organization options for digital games.
Many users felt restricted by the few options currently available for automatic organization, and managing games obtained from multiple game distributors was also deemed problematic. Digital games also offer fewer options regarding games no longer of interest.
RQ3. In what significant ways do these needs and organizational methods differ based on the sex and age of users?
- Men tend to play more console and PC games whereas women play more smartphone and tablet games.
- In general, men seemed to consider games as experiences and tended to seek information related to playing the game (e.g., style, gameplay videos, mood/affect), while women seemed to consider games as commodities and seek information relevant to acquiring the game (e.g., format, system requirements).
- Men and younger users were also more active in seeking every kind of game information through multiple sources.
- Men and younger users were more likely to build and organize game collections compared to women and older users.
Previous research shows that sex differences do exist regarding gamers’ identities or skills (Yee, 2006), and age differences for genre preferences (Bilgihan et al., 2013). Our findings suggest that sex and age of users also affect how people play, organize and collect games and thus how they seek game-related information.
This study is exploratory in nature, and therefore we focused on analysing the survey data based on the basic demographic information such as sex and age. The findings, especially the open-ended comments on favourite games and reasons, show that there may be other factors that are correlated with the patterns we are observing (e.g., the types of games preferred, such as AAA or freemium games). We hope to further explore this by collecting additional data and conducting multivariate analysis in our future user studies.
In future work, we plan to conduct an in-depth analysis of open-ended survey responses regarding the appeal factors of video games (i.e., core reasons why people play certain games) as well as reasons for preferring digital versus physical formats of video games. This will provide further insights into the use of appeals as game metadata as well as how to design game distribution models in information systems. Building on knowledge gained from this survey data, we also hope to investigate users’ information needs around other popular cultural objects, such as graphic novels and animations, with the ultimate goal of identifying common metadata that can be used to search and discover materials across different media types.
Acknowledgements
The authors would like to thank everyone who participated in the survey and helped recruit participants by sharing our invitations. We also thank the students in the INFO498/INFX598 video game metadata courses for their valuable contribution in revising the survey questions, and James Portnow and Andrew Perti for their help in recruiting survey participants. This research is supported by the Bridge Award from the Office of Research at the University of Washington.
About the authora
Jin Ha Lee is an assistant professor at the Information School in University of Washington. Her research interests include: music, game, and multimedia information seeking and retrieval, information organization and access, and knowledge representation. She leads the GAMER (GAme MEtadata Research) group, exploring new ideas and approaches for organizing and providing access to video games and interactive media. She holds an M.S. and a Ph.D. from the University of Illinois at Urbana-Champaign. Dr. Lee can be contacted at: jinhalee@uw.edu
Rachel Ivy Clarke is currently a Ph.D. candidate at the University of Washington Information School. Her research centres on the history of libraries and library technologies, especially how past work might inform the conceptualization and design of digital libraries and catalogues. She holds a BA in creative writing from California State University Long Beach and an MLIS from San Jose State University. She can be contacted at: raclarke@uw.edu
Yea-Seul Kim is a doctoral student at the University of Washington Information School. Her research focuses on human-computer interaction, information visualization, and data science. She holds a BA in Applied Statistics from Yonsei University in Korea and a Master's degree in Human Centered Design & Engineering from University of Washington. She can be contacted at: yeaseul1@uw.edu/p>