Image use in social network communication: a case study of tweets on the Boston marathon bombing
JungWon Yoon and EunKyung Chung
Introduction
Visual languages have been employed from earliest pre-history to the present and are used in almost every human endeavor. (Marriott and Meyer, 1998, p.1)
Images have been a communication media since ancient times, while alphabets have been a dominant means of communication for only the last 2,000 years. Recently, with the development of digital technologies, it has become much easier to create, deliver, and access visual information, and as a result, images have gained new attention as a media of communication. People use images to communicate, with the intuition that visual information will reduce the communication gap (Snyder, 2014). The use of visual information is pervasive, from professional and commercial purposes, to entertainment. In particular, in the social networking environment, where people play diverse roles, such as information creators, disseminators, and consumers, people often make use of images to convey information and ideas.
The purpose of this study is to understand how people use images in a social network environment where people actively communicate with others. As Beaudoin (2014) and McCay-Peet and Toms (2009) addressed, it is a worthwhile effort to understand the use of images, in order to develop image retrieval systems and services that support image users. There have been studies that explored how visual information (images and drawings) is used in work or communicative practice (Beaudoin, 2014; Chew, Rode, and Sellen, 2010; Laing and Massodian, 2014; Snyder, 2014; Conniss, Ashford, and Graham, 2000). However, there is a lack of study that analyses the use of images in the social network environment, in which more and more people interact and communicate with others. According to Pew Research (Duggan and Smith, 2013), more than 70% of the United States population participate in one or more social networking services.
Among various social network services, this study collected Twitter messages with embedded images, related to Boston marathon bombing. Twitter is a micro blogging service where users can post up to 140 characters of text messages (tweets), and it is the world second largest social media platform after Facebook. Compared to other popular social networking services that mainly focus on establishing personal networking and entertainment, Twitter has been characterised as information diffusion and wielding influences (Boyd, Golder and Lotan, 2010). According to previous studies, headline news and persistent news are one of the main topics of Twitter messages (Kwak, Lee, Park and Moon, 2010), and 45% of U.S. adults consume news via Twitter (Mitchell, Holcomb, and Page, 2013). Twitter also has been characterised as an important information source for crisis communication (Larson and Ågerfalk, 2013; Mendoza, Poblete, and Castillo, 2010). In addition to news media and crisis communication media, it was found that Twitter conveys diverse types of messages, from sharing information to promoting social actions. It was assumed that the topic of the Boston marathon bombing would involve diverse types of tweets that characterise Twitter practice, and that people might use images for more effective communication in the Twitter environment. Therefore, in spite of topical limitations, the dataset was selected for examining how images are used in online communication practices for both spreading information and giving influence.
The following research questions were established to direct this study:
- RQ1: what are the characteristics of image uses in tweets in the case of Boston marathon bombing?
- RQ2: what are the characteristics of images which are used in tweets in the case of Boston marathon bombing?
- RQ3: how can the characteristics of image use be reflected in research on image retrieval?
Related studies
Twitter studies
On Twitter, users can post 140 characters or less of text messages (tweets), optionally with URLs, photos, or videos, and people develop social network connections via following and follower functions. Compared to other social networking services, it shows a low reciprocity between users. Instead, its functions are mainly identified as sharing information, rather than reciprocal social interaction (Kwak, et al., 2010; Thelwall, Buckley and Paltoglou 2011). By default, tweets are open to the public, though tweets can be sent only to the user’s followers. Twitter users can directly reply to the senders, and retweet a tweet to spread it. Also, hashtags (e.g., #Boston) can be used to explicitly indicate keywords of the tweet, and are conventionally used for collating all tweets having the same hashtag.
Lines of research have been conducted to understand tweeting practices. First, Twitter practices were examined through quantitative analysis and content analysis. While most of quantitative research demonstrated the growth of Twitter, content analysis analysed purposes (types) of tweets, and motivations of tweeting practices. Motivations of tweeting are diverse, and, depending on the collection of tweets, distributions of motivations (or types of tweets) were different. However, the following types of motivations were commonly found: personal updates, sharing opinions and experiences, real-time sharing and information sharing, advertising, exhorting (encouraging others to do something), soliciting information and questioning to a follower, and directed dialogues (Honeycutt and Herring, 2009; Java, Song, Finin and Tseng, 2007; Naaman, Boase and Lai, 2010; Nagarajan, Purohit and Sheth, 2010; Westman and Freund, 2010). Although diverse motivations and types of tweets were identified, as addressed above, information diffusion and the wielding of influences have been recognised as noticeable and dominant functions of Twitter messages (Boyd, Golder and Lotan, 2010).
Second, there has been a number of studies on retweeting practices. Retweeting is a conversational practice through which users can reply or forward a tweet (Boyd, Golder and Lotan, 2010; Nagarajan, Purohit and Sheth, 2010). By retweeting, the two functions, information sharing and giving influences, are more active in a Twitter network. According to Mustafaraj and Metaxas’ (2011) analysis on 50 million tweets, 16% of daily Twitter messages were retweeted but specific datasets that were related to political events showed 43% and 39% of Twitter messages were retweeted. Boyd, Golder and Lotan (2010) examined conventions of retweeting and motivations of retweeting. Again, various motivations were found: to spread tweets, to diffuse information, to publicly agree with someone, to validate others’ thoughts, as an act of friendship and loyalty, and so on. Suh, Pirolli and Chi (2010) examined features that might affect retweetability of tweets, and found that URLs, hashtags, the number of followers and followees, and the age of the account have relationship with retweetability.
Finally, studies have examined the use of Twitter within specific communities, such as the use of Twitter messages by governances (Crump, 2011; Golbeck, Grimes and Rogers, 2010; Panagiotopoulos and Sams, 2012); sharing medical/health information on Twitter (Donelle and Booth, 2012; Scanfeld, Scanfeld and Larson, 2010); and reporting news via Twitter (Cozma and Chen, 2013; Hermida, 2010; Lasorsa, Lewis and Holton, 2012; Papacharissi and Oliveira, 2012; Vis, 2013). In particular, the roles and influences of Twitter under crisis or emergency situations, such as the 2010 earthquake in Chile (Mendoza, Poblete and Castillo, 2010), 2011 London riots (Tonkin, Pfeiffer and Tourte, 2012), and the 2011 Egyptian uprising (Papacharissi and Oliveira, 2012), have been studied. These studies demonstrated that Twitter is an important communication media for disseminating breaking news, and sharing important information in real time (Vis, 2013). Although a huge amount of research has been conducted on understanding Twitter and its users, there is a lack of study focusing on image use in Twitter communication.
Image use
Images are used for diverse purposes, from a celebrity picture for a computer screensaver, to a criminal picture as visual evidence. Therefore, image use is considered as one of the crucial elements for understanding image users’ needs and their image search behaviors, as well as for designing image retrieval systems (Yoon and Chung, 2011). Fidel (1997) conceptualised image use by presenting two ends of a spectrum, the data pole and the object pole. At the data pole, images are used for the information they embody, such as medical images, cartographic materials, and chemical structure; and at the object pole, images are used as objects, such as pictures in a history book, part of an advertisement, and the cover of a magazine; although in many cases, image uses are placed in between. She addressed how these two poles represent different retrieval tasks and search behaviors.
Some researchers examined image use within the context of work tasks. To understand how and why people search for and use visual information, Conniss, Ashford, and Graham (2000) investigated the image retrieval systems of 45 users in several domains including: a regional museum, picture libraries, an architectural design company, a broadcasting origination service, a police force, a newspaper organization, an academic art history department, and a radiology department. Their study suggested six types of image use: illustration (an image is used for illustrating stories, events, etc.); information processing (data within an image is important, such as diagnosis or identification of a suspect); information dissemination (an image is viewed as a stand-alone piece of information, such as the dissemination of a mug shot photograph for searching for a suspect); learning (an image is used for gaining knowledge); generation of ideas (an image is used for provoking inspiration or thought patterns); aesthetic value (an image is used for decorative purpose); and emotive/persuasive (an image is used for simulating emotions, or conveying conceptual or abstract meanings). Westman and Oittinen (2006) investigated image-seeking behaviors of journalists and archivists in a newspaper editorial office, and the functions of images that were perceived by participants were identified: acting as proof of a news event, catching the readers’ attention, filling up pages, conveying information, and adding value by bringing an aesthetic or informational dimension to text. McCay-Peet and Toms (2009) demonstrated that journalists’ and historians’ use of images (for information or for illustration) differs significantly, depending on the stage of the work task process. In the preparation stage when sources are gathered, both illustration and information needs appear; whereas in the dissemination stage, illustration needs were more dominant; while in the elaboration stage, information needs were more obvious. Beaudoin (2014) demonstrated how and why images were used by four user groups of archaeologists, architects, art historians and artists. Reasons that these user groups use images in their work were identified as: knowledge, conceptual model, inspiration, cognitive recall, critical thinking, emotion, engagement, marketing, proof, social connection, translation, and trust.
Yoon and Chung (2011) investigated how image needs are interwoven with image use purposes, by analysing image-seeking questions posted in a social Q&A service. Their findings were analysed with Fidel’s (1997) and Conniss, Ashford, and Graham’s (2000) image frameworks, and demonstrated that image uses as sources of object were more frequent than sources of data, and generation of ideas and illustration were the most frequent categories. Snyder (2014) examined image-enabled communicative activities, by observing face-to-face conversations involving the creation of ad hoc visualisations (i.e., napkin drawings). Her study, rather than focusing on the image as an artifact, attempted to understand motivations for the deployment of images in dialogic communicative strategies, and the affects of these images in communicative outcomes.
Research design
Dataset
With the purpose of understanding image uses in the Twitter environment, this study used content analysis. Rather than gathering a huge amount of Twitter messages using an API, this study collected Twitter messages with embedded images in the messages, via the search interface provided by the official Twitter site (www.twitter.com). On May 13, 2013, two keywords, Boston AND pic.twitter.com, were submitted through the advanced search interface, to retrieve Boston Bombing-related Twitter messages with images. Other possible search keywords could be considered for generating a dataset, but this study decided to use these two keywords for the following reasons. First, to select topical keywords, the authors reviewed Boston Bombing related tags from a tag-cloud result. In addition to Boston, the terms marathon, everyone, prayers, explosions, people, and thoughts appeared highly related to the Boston bombing. Among these tags, Boston was selected, because it seemed to comprehensively retrieve related Twitter messages with minimum noise. Second, in order to select keywords for retrieving Twitter message with embedded images, Twitter messages including pic.twitter.com were retrieved. When Twitter users upload images a URL is automatically generated by Twitter, and pic.twitter.com is built into Twitter. Because of the 140-character limit, Twitter users may use URL shorteners for reducing the number of characters of URL, such as bit.ly/, tinyurl.com/, and buff.ly. However, Twitter messages including URLs generated by URL shorteners were not collected, because these URLs include all types of links rather than just image links. In the search interface, there are two options for displaying search results, top and all. Although specific definitions on these options were not found, based on the authors’ observations, top menu shows twitter messages that are retweeted more. Considering the purpose of this study, it would be reasonable to focus on Twitter messages that are more often distributed by the public. So search results in the top menu were selected for data collection.
This dataset includes Twitter messages that were tweeted from April 15, 2013, which is the day that the two Boston bombs exploded, to April, 30, 2013. A total of 1,588 Twitter messages were collected for this study.
Data analysis
The dataset was manually coded in terms of the type of Twitter message, type of agent, and type of image, through the following procedures. First, initial coding schemes were developed with 50 randomly selected Twitter messages and their agents. To establish the type of Twitter message, an initial coding scheme was developed by adopting and revising coding schemes from previous studies (Golbeck, Grimes and Rogers, 2010; Honeycutt and Herring, 2009; Java et al., 2007; Naaman, Boase and Lai, 2010; Westman and Freund, 2010). For type of agent and type of image, open coding was conducted. The two authors of this study individually coded and discussed the development of initial coding schemes. Second, another set of 50 Twitter messages and their agents were randomly selected, and the two authors individually coded them with initial coding schemes, and then revised the initial coding schemes. Finally, the two authors applied the revised coding schemes to a set of 100 Twitter messages and their agents, and the coding schemes were finalised with minor revisions (Table 1, Table 2, and Table 3). Among the type of Twitter message, the category of information is very broad, and some categories, such as breaking news, anecdote: me/self-promotion, anecdote: others, alert, and advertisement could be categorised within information. However in this study, with the consideration of previous studies’ Twitter message categorisation schemes and the features of this dataset, those categories were separated from information. One of two authors coded the dataset, and with 20% of the dataset, percentage agreement was calculated to check intercoder reliability using Holsti’s (1969) reliability formula. The percentage of intercoder agreement was 89% on average (type of Twitter: 76%; type of agent: 98%; type of image: 96%).
In this study, Twitter agent, Twitter message, and retweet are defined as follows:
- Twitter agent: a Twitter account holder (starting with @), such as a people, a company, a group, and so on. One person (or one company) may have several Twitter accounts. During the coding process, if one person (or one company) has multiple accounts, these accounts were considered as one agent. For example, ABC News had two accounts, @ABC and @abcnews, and in this case, two accounts were considered as one agent.
- Twitter message (= Tweets): a single message, which is limited to 140-character, sent via Twitter.
- Retweet: A tweet that is presented by a Twitter agent who is not an author of the original tweet. Retweets usually include a text indicator addressing original author of the tweet. Based on previous studies on retweeting behaviors (Boyd, Golder, & Lotan, 2010; Suh, Hong, Pirolli, & Chi, 2010), this study considered the tweets having the following indicators as retweets: RT:, RT @, via @, retweeting @, retweet @, THX @, HT @ and r @.
| Twitter message category | Definition | Example |
|---|---|---|
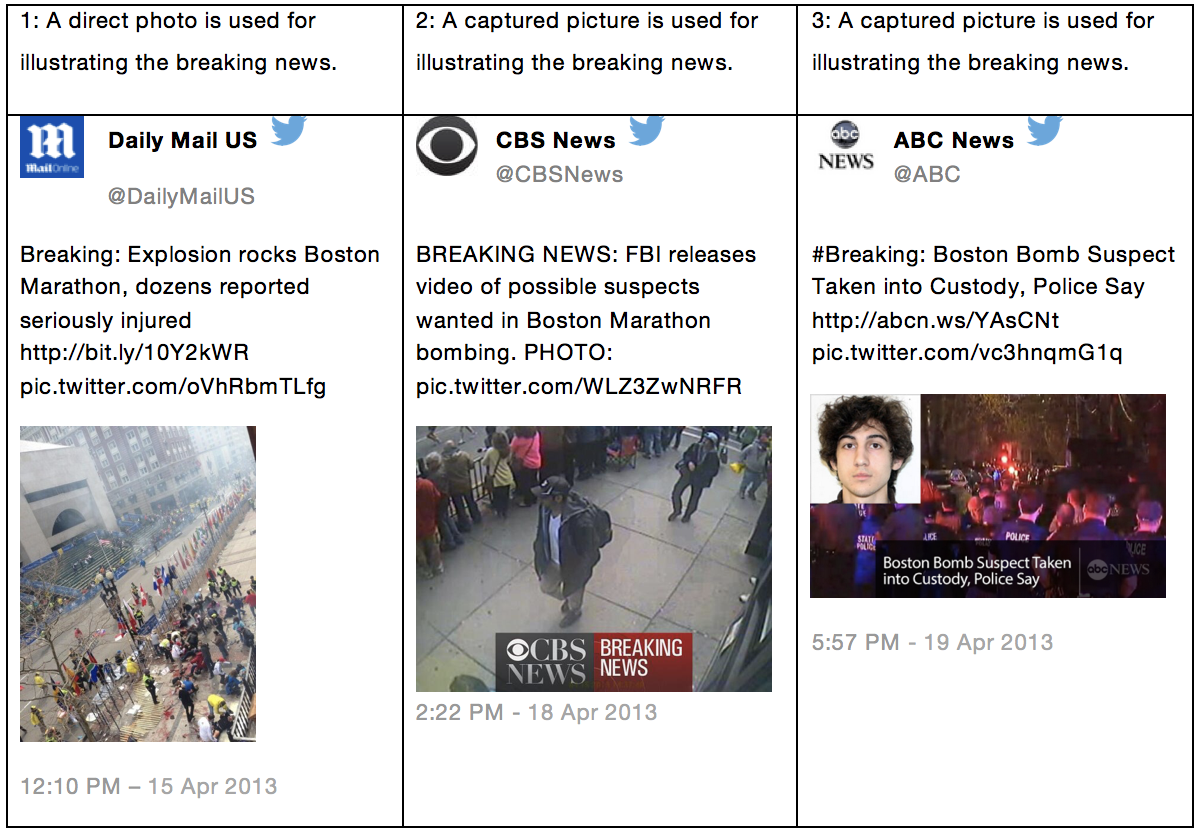
| Breaking news | Tweets sharing news or events that are currently and unexpectedly developing. Tweets including the word breaking were categorised here. | Breaking: Explosion rocks Boston Marathon, dozens reported seriously injured http://bit.ly/10Y2kWR pic.twitter.com/oVhRbmTLfg |
| Information | Tweets sharing various information, including general and persistent news, factual information, and sharing resources; but excluding anecdotes, self-promotion, commercial advertisement. | An incredible Boston Magazine cover paying tribute to those affected by the Marathon bombing: http://yhoo.it/17Ysk6X pic.twitter.com/bAKkNYfErm |
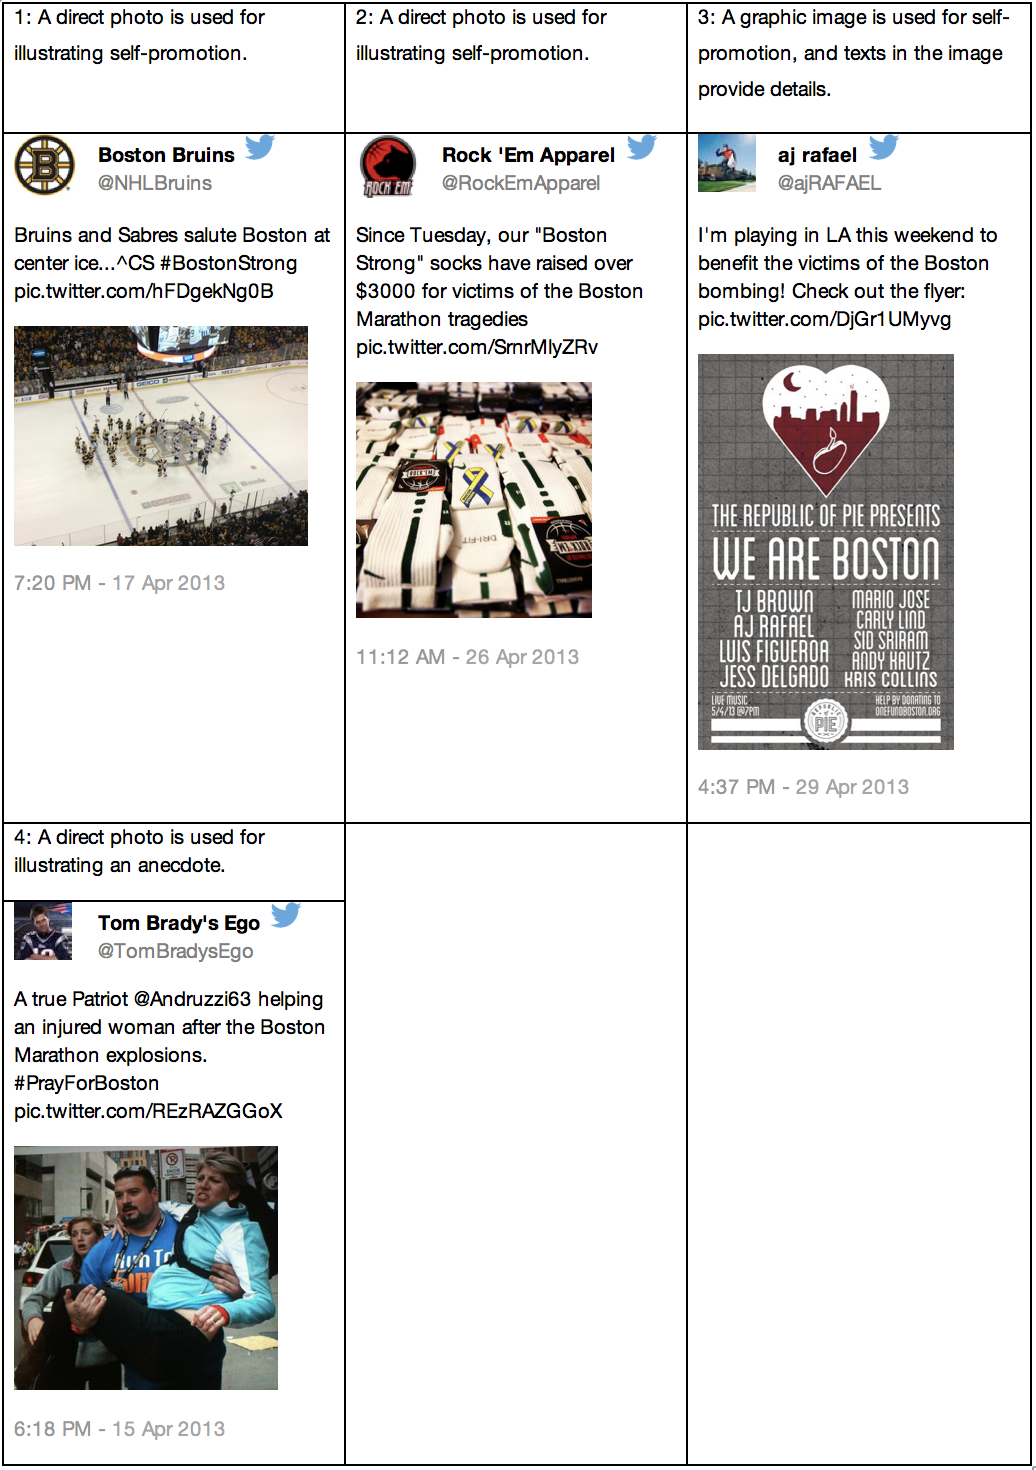
| Anecdote me / Self-promotion | Tweets sharing agents’ own stories and experiences or promoting themselves, but commercial advertisements were excluded. | Since Tuesday, our “Boston Strong” socks have raised over $3000 for victims of the Boston Marathon tragedies pic.twitter.com/SrnrMlyZRv |
| Anecdote others | Tweets sharing an amusing or touching story about a person or a group of people. | BU Athletic Trainer, Larry Venis, a great example of a Boston hero who ran towards the explosion to help victims. pic.twitter.com/19bOb2A6U3 |
| Reference to other source | Tweets including direct link to other sources, so that readers may find the original sources. | Stunning cover design by @BostonMagazine and amazing story behind it. http://www.bostonmagazine.com/ news/blohg/2013/04/25/behind-our-may-boston-marathon-cover/ … Must see, must read. pic.twitter.com/YZhsxkn05P5 |
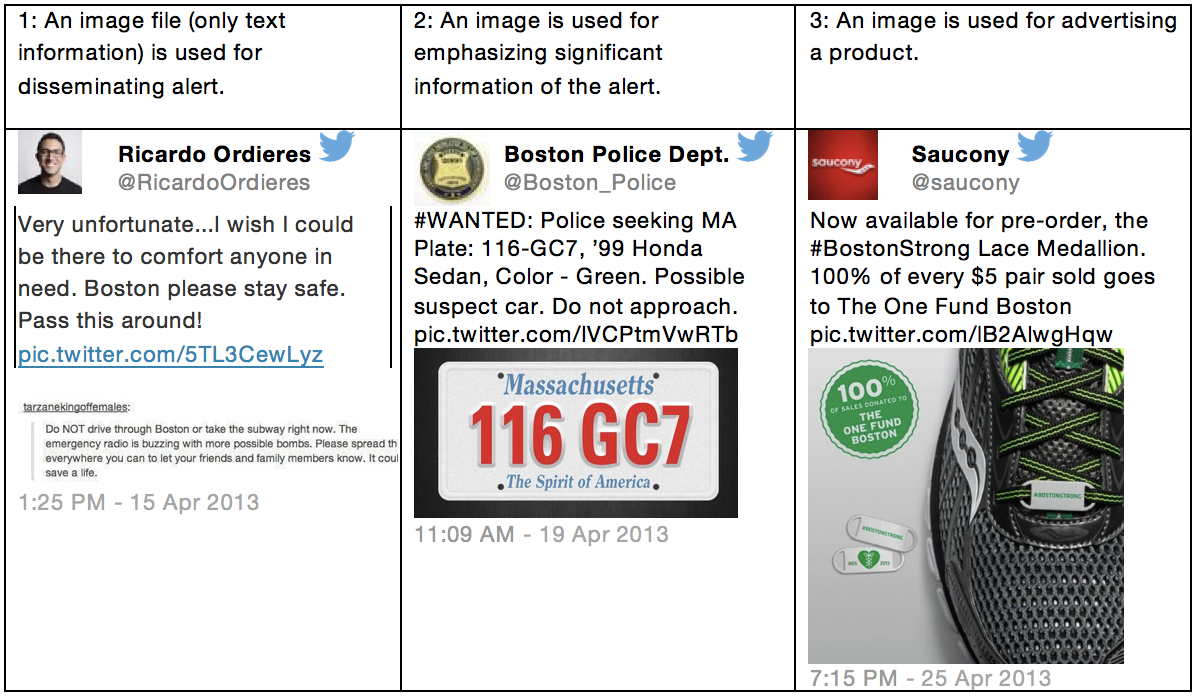
| Alert | Tweets sending out warnings, alarms, or emergent messages calling vigilant public attention. | #WANTED: Police seeking MA Plate: 116-GC7, ’99 Honda Sedan, Color - Green. Possible suspect car. Do not approach. |
| Advertisement | Tweets including commercial advertisements. | Now available for pre-order, the #BostonStrong Lace Medallion. 100% of every $5 pair sold goes to The One Fund Boston pic.twitter.com/lB2AlwgHqw |
| Emotion | Tweets expressing agents’ feelings and sharing condolence messages from themselves or from others. | Our hearts go out to Boston, and everyone affected by today’s tragedy. pic.twitter.com/GMWRJWaSE9 |
| Opinion | Tweets asserting agent’s subjective or evaluative position. | Whether you support the Gang of Eight immigration reform bill or not, Boston showcases why this can't be rushed: pic.twitter.com/lcNHuulcYO |
| Call for action | Tweets directing or encouraging others to do something, including donations and contributions. | If you're in #Boston, contact hospitals to see if blood donation is needed! You could save a life NOW #BostonMarathon pic.twitter.com/HJmNLbzhJ9 |
| Ask retweeting | Tweets requesting retweeting. | PLEASE RT THIS SO THE BOSTON POLICE CAN SEE IT pic.twitter.com/py9YhkMQxum |
| Level 1 Category | Level 2 Category | Example |
|---|---|---|
| Media | Newspaper | Traditional newspapers, such as The Wall Street Journal, Washington Post, The Boston Globe, and Telegraph News (UK). |
| Magazine | Magazines, such as The Atlantic, Newsweek, Boston magazine, and People. | |
| TV/Radio News | Television and Radio News channels, such as CBS News, CNN Breaking News, Russia Today, Boston NPR News and Information Station. | |
| TV Show/ Movie | TV shows and Movies, such as the Today show, Hello Herman, and The Steve Nolan Radio Show. | |
| Online/Social media | Online media (mostly online news media), such as Buzz Feed, Huffington Post, Boston Tweet, Digg, Simon Cowell Online, and Yahoo News. | |
| Newsperson | Individuals who work for media, such as journalists, correspondents, reporters, anchors, and columnists. | |
| Organization | Government/Police | Federal/state governments, such as the White House, FBI, New York City Government, and Boston Police Department. |
| Educational | Educational institutions or subgroups of educational institutions, such as Boston College and Onward State (a student-run Penn State blog). | |
| Non-profit | Non-profit organizations, such as Life is good, The Color Run, and The National September 11 Memorial & Museum. | |
| Profit | Commercial organizations, such as AT&T, Rock’Em Apparel, and the NBA Store. | |
| Sports | Sports teams or organizations related to sports, such as Tampa Bay Rays, Rock n Roll Marathon, New England Revolution, and Major League Baseball. | |
| Fan club | Fan clubs of a specific person or group, such as MLB Fan Cave and Jenna Marbles fan twitter. | Individual | Politics | Politicians |
| Sports | Sportsmen or individuals who work in sports related fields. | |
| Entertainment | Individuals who work in entertainment field, such as musician, actor/actress, and directors. Groups/bands are also included in this category. | |
| Other individuals | Individuals who do not belong to the above categories. | Others | Parody | Parody accounts, which are not associated with a real person or character. |
| Photo | Agents that share and post photos, such as Earth pics, fascinating pictures, and picture eduphoria. | |
| Unknown/Remainder | Accounts that do not have descriptions, or that do not belong to any other categories. |
| Image category | Example |
|---|---|
| Direct Photo | Photos of scenes, objects, and people that appear to be directly taken. |
| Captured Picture | Pictures that are captured from other media (screen captures from computers and mobile devices; picture of TV screen, magazine (e.g., a picture of magazine cover page), newspaper (e.g., a picture of the first page of newspaper). |
| Graphics | Mostly computer graphics, but drawings and cartoons were also included here. Exclude maps and a graphic of text only. |
| MAP | Maps in form of photos, drawings, graphics |
| Text | An image of text that is used for disseminating only text information, which usually exceeds 140 characters. |
Results
Features of the dataset
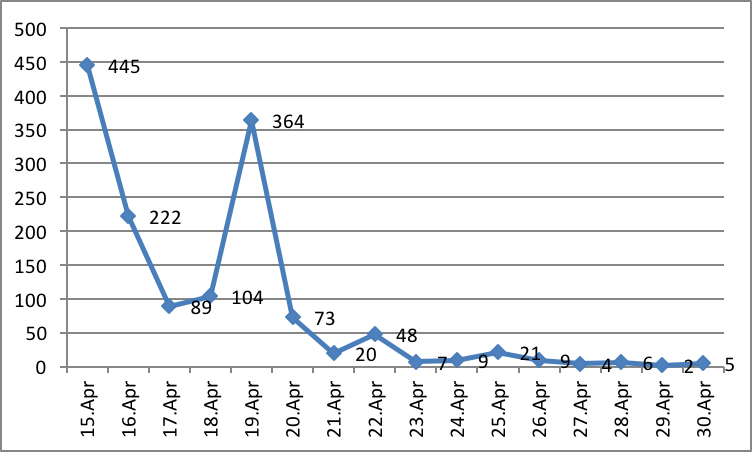
Among 1,588 tweets, 160 tweets were removed from the dataset, either because they were not related to the Boston marathon bombing (88 tweets), or the images were no longer available when coding was conducted (72 tweets). So, the total number of tweets that were analysed for this study was 1,428. Figure 1 shows the number of Boston marathon bombing related tweets with images between April 15, 2013 and April 30, 2013. On April 15, 2013, two explosions erupted during the Boston marathon, and on April 19, 2013 one suspect died, and the other suspect was in custody after a manhunt. During these two days, related tweets were most actively sent. This section examines features of this dataset, in terms of agents and Twitter messages.
Agents
The total number of agents extracted from 1,428 tweets was 973, and the average number of tweets per agent was 1.47. The maximum number of tweets by a single agent was 38, and 814 agents sent just one tweet; only a small number of agents sent a high number of Twitter messages, and the rest of the agents sent only a few messages.
Agents were analysed in terms of quantitative features of the current dataset (Table 4). Media agencies (33%) accounted for 43% of tweets in the dataset; in particular, Newsperson (16%), Online and social media (13%), and TV/Radio News stations (8%) were active agents of this dataset. The types of agents whose tweets were frequently retweeted were Government/Police (Average retweets: 2,198), Photo (Average retweets: 2,013), and Parody (Average retweets: 1,083). The types of agents whose tweets were highly favored were Photo (Average favorites: 800), Parody (Average favorites: 640), and Individuals (Average favorites: 603).
| Category | Sub-Category | # of Agents (%) | # of Tweets (%) | Ave. # of Retweets | Ave. # of Favourites | ||
|---|---|---|---|---|---|---|---|
| # | % | # | % | ||||
| Media | News paper | 21 | 2.16 | 45 | 3.15 | 221.80 | 36.93 |
| Magazine | 15 | 1.54 | 19 | 1.33 | 130.56 | 42.06 | |
| TV/Radio News | 46 | 4.73 | 121 | 8.47 | 472.40 | 85.17 | |
| TV Show/ Movie | 13 | 1.34 | 19 | 1.33 | 378.24 | 138.65 | |
| Online/Social media | 66 | 6.78 | 188 | 13.17 | 403.97 | 131.98 | |
| Newsperson | 160 | 16.44 | 223 | 15.62 | 285.93 | 73.99 | |
| Subtotal | 321 | 32.99 | 615 | 43.07 | 351.37 | 91.14 | |
| Organization | Government/Police | 8 | 0.82 | 51 | 3.57 | 2197.58 | 330.12 |
| Educational | 5 | 0.51 | 6 | 0.42 | 73.60 | 35.00 | |
| Non-profit | 31 | 3.19 | 44 | 3.08 | 278.09 | 132.42 | |
| Profit | 37 | 3.80 | 51 | 3.57 | 326.31 | 128.57 | |
| Sports team | 29 | 2.98 | 39 | 2.73 | 465.05 | 239.26 | |
| Fan club | 11 | 1.13 | 12 | 0.84 | 480.42 | 262.00 | |
| Subtotal | 121 | 12.44 | 203 | 14.22 | 813.75 | 207.04 | |
| Individual | Politician | 4 | 0.41 | 4 | 0.28 | 193.00 | 47.50 |
| Sports | 29 | 2.98 | 33 | 2.31 | 390.79 | 158.85 | |
| Entertainment | 36 | 3.70 | 37 | 2.59 | 391.11 | 203.14 | |
| Other individuals | 306 | 31.45 | 359 | 25.14 | 109.73 | 602.61 | |
| Subtotal | 375 | 38.54 | 433 | 30.32 | 360.32 | 121.15 | |
| Others | Parody | 15 | 1.54 | 20 | 1.40 | 1083.55 | 640.30 |
| Photo | 18 | 1.85 | 25 | 1.75 | 2012.54 | 800.00 | |
| Unknown/Remainder | 123 | 12.64 | 132 | 9.24 | 386.55 | 152.32 | |
| Subtotal | 156 | 16.03 | 177 | 12.39 | 831.62 | 364.96 | |
| Total | 973 | 100.00 | 1428 | 100.00 | 670.44 | 149.29 | |
Tweets
1,428 tweets were categorised in terms of the purposes of messages. As Papacharissi and Oliveira (2012) addressed, one tweet may have multiple purposes; but the authors attempted to code a main purpose for each tweet, and two or more categories were assigned only for the tweets that obviously demonstrated their multi-purpose. For instance, tweets in ask retweets, call for action, reference to other sources, emotion, and alert categories were frequently combined with other types of messages.
Table 5 shows quantitative features of tweets. 50% of tweets were categorised in information, followed by emotion (21%), opinion (6%), and breaking news (5%). The average number of retweets was 670.44, with maximum and minimum numbers of retweets, 19,854 and 8, respectively. Among 13 categories, tweets in the alert category were most frequently retweeted (average retweets: 3,270), followed by Opinion (average retweets: 783), breaking news (average retweets: 699), and call for action (average retweets: 686); advertisement was the least retweeted category (average retweets: 82). Whereas retweets are used for spreading messages, favorites are mostly for expressing personal preferences. The average number of favorites of tweets was 149, and the maximum number of favorites of a tweet was 5,579 and the minimum was 2. Tweets in opinion (average favorites: 431), alert (average favorites: 290), and anecdote me/self-promotion (average favorites: 200) have higher numbers of favorites.
| Tweets category | # of Tweets | Ave. # of Retweets | Ave. # of Favourites | |
|---|---|---|---|---|
| # | % | |||
| Breaking news | 80 | 4.80 | 698.90 | 98.65 |
| Information | 834 | 50.03 | 376.46 | 109.12 |
| Anecdote me / Self-promotion | 66 | 3.96 | 412.00 | 200.20 |
| Anecdote others | 55 | 3.30 | 295.50 | 154.08 |
| Alert | 23 | 1.38 | 3,270.46 | 290.45 |
| Advertisement | 12 | 0.72 | 82.17 | 34.58 |
| Emotion | 344 | 20.64 | 453.12 | 157.35 |
| Opinion | 107 | 6.42 | 782.64 | 430.60 |
| Reference to other source | 14 | 0.84 | 165.92 | 32.15 |
| Call for action | 37 | 2.22 | 686.12 | 54.76 |
| Ask retweeting | 49 | 2.94 | 438.05 | 89.98 |
| Remainder | 46 | 2.76 | 384.00 | 139.50 |
| Total | 1667 | 100.00 | 670.44 | 149.29 |
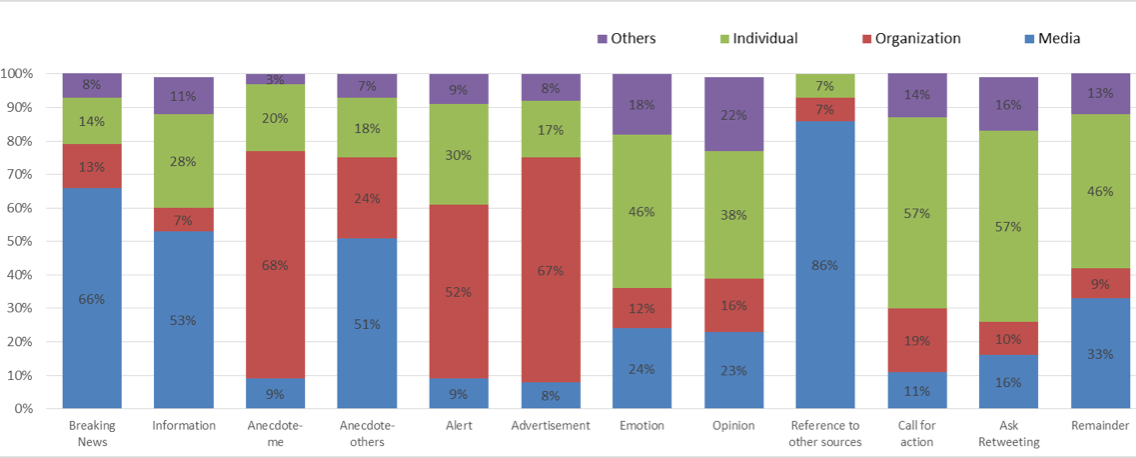
The relationship between type of agent and type of tweet was observed (Figure 2). First, media was the main category of agent for breaking news (66%), information (53%), and anecdote others (51%). Second, organizations were the main sources of anecdote me/self-promotion (68%), advertisement (67%), and Alert (52%) categories. In particular, Anecdote-me/Self-promotion was frequently tweeted by sports teams (32%), advertisement was tweeted by profit organizations (50%), and alert was tweeted by government/police (52%). Third, asking retweets (57%), call for action (57%), emotion (46%), and opinion (38%) were mainly tweeted by individuals.
Features of image use
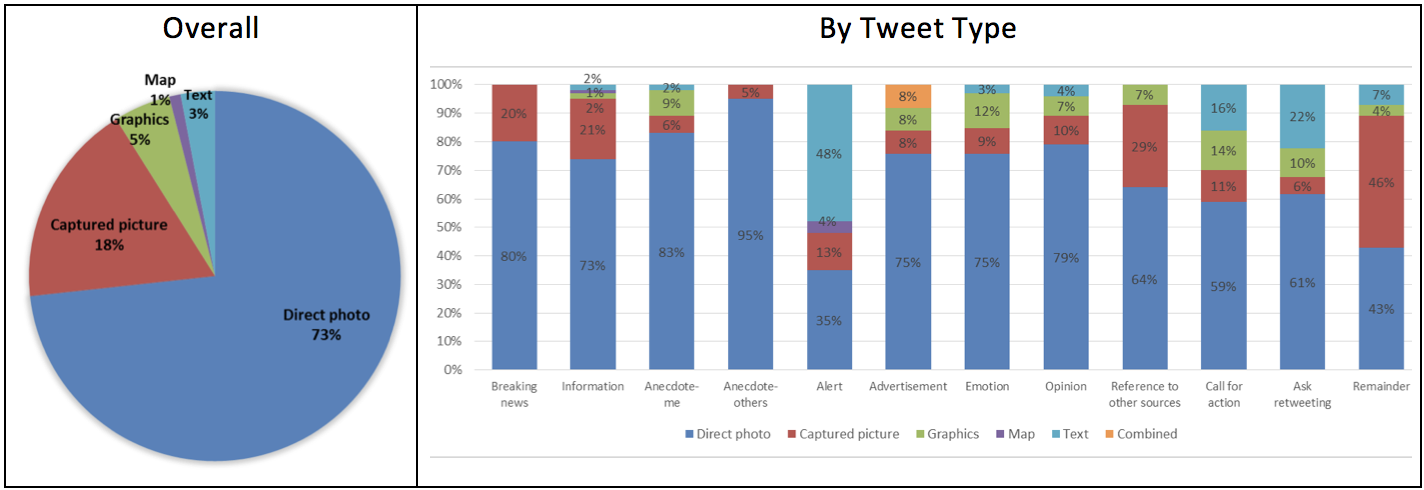
In this section, features of image use in Twitter messages were examined. First, the format of images and use of texts within images were analysed. As shown in Figure 3, Direct photos (photos of scenes, objects, people, etc.) were the most dominant format (74%), followed by captured images (18%: images captured from other media, such as TV news, social networking services screens, and a page of a newspaper or magazine), and Graphics (5%: mostly computer generated graphics).
Throughout image analysis, it was observed that text was often enclosed in images. Figure 4 shows the use of text in images; 55% of tweets had only visual components in images, and 45% of images included some forms of text for delivering messages. Types of texts in images were diverse as following:
- Image with text (29%): texts could be a part of an image, for example, a direct photo that includes text in a scene, such as banners or signs, or a captured news screen having a caption.
- Image with added text (9%): text could be added to an image, in order words, text is added to an image by the creator or disseminator of the image.
- Image text only (5%): texts could be the main content of an image, although visual components conveyed some message, for example an image capturing text messages; here texts are the main message, and the visual component shows that the information is from text-messaging.
- Text only (3%): image format was used only for delivering more than 140-characters, by photographing text.
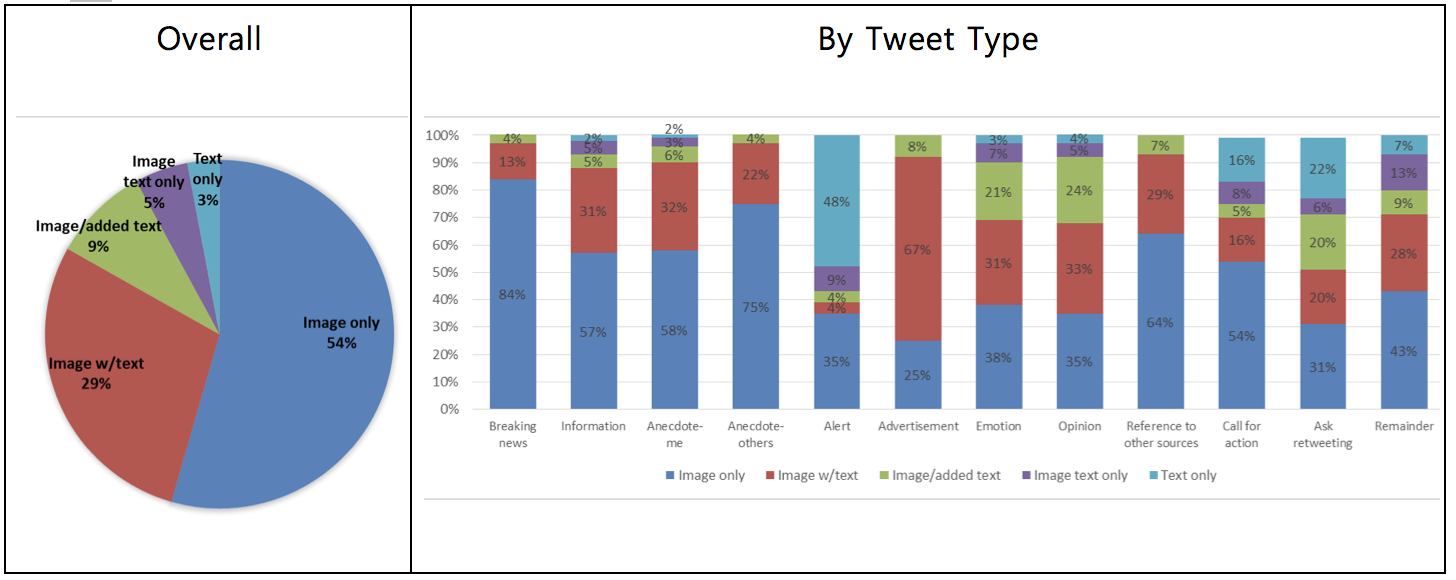
Characteristics of images were analysed in terms of type of Twitter message. The Breaking News category shared news or events that were currently and unexpectedly developing, or required urgency. Images, whether they were directly photographed (80%) or captured from TV news screen (20%), were mostly used for illustrating those news or events. Most of the images were without text (84%), but some of them included text in the image, mostly captions on TV news screens (13%) (Figure 5).
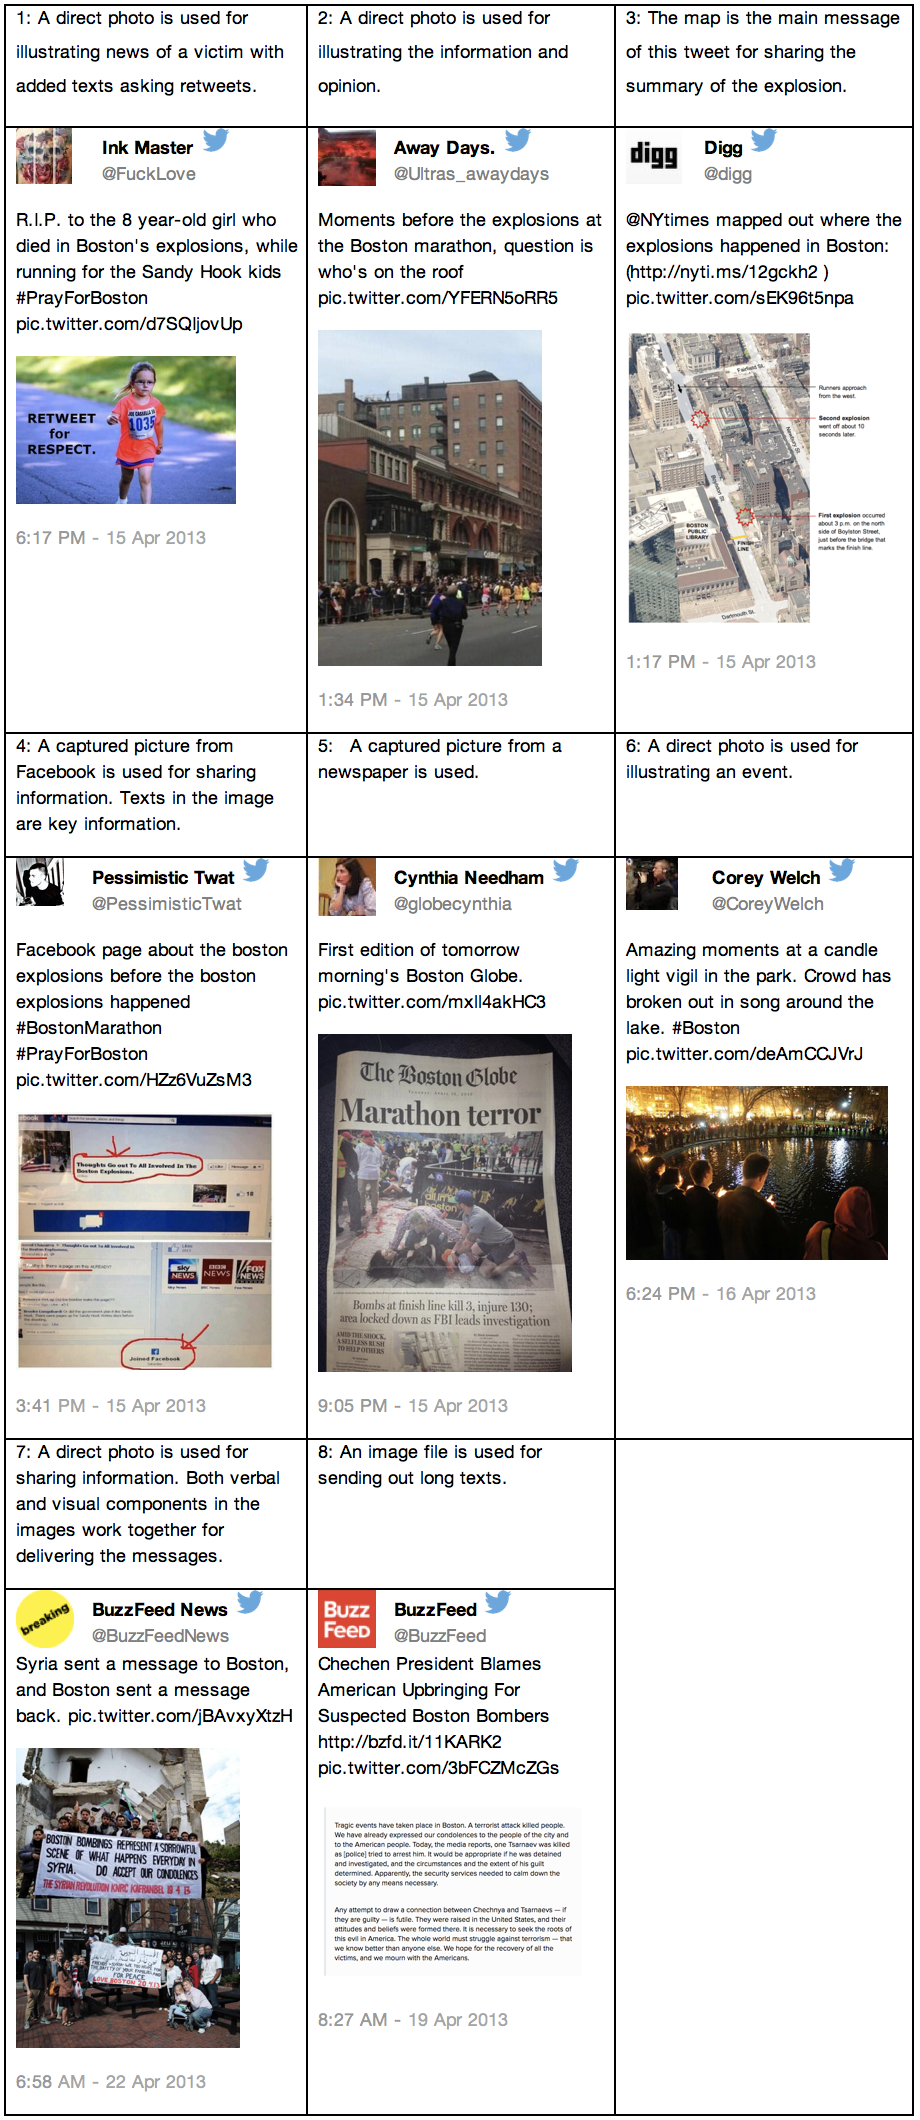
Tweets in the information category included news that was not categorised as breaking news, such as news about people who were injured or who had died, the progress of searching for suspects, government briefing, scenes of Boston, and so on. In addition to general news, various types of messages for sharing information were categorised here; for example, any information related to the Boston marathon bombing or suspects (sometimes unverified information was shared), analysed and synthesised information, and reactions or messages from people, media, and organizations. Formats of images were also diverse: direct photos, captured images from newspapers or magazines, TV news scenes, computer screens, maps with some marks on them, and multiple images were used for sharing information (Figure 6). Images were mostly used for simply illustrating the information (Figure 6: 2, 6), but sometimes, images were used as main sources of information (Figure 6: 3, 5), or as evidence (Figure 6: 4). In some images, text information in the image served as a key source of information (Figure 6: 3, 4, 7, 8). Also, there were images having added text, for conveying emotions, opinions, or asking for retweets along with the information (Figure 6: 1).
Tweets in the anecdotes-me/self-promotion category included messages to honor the victims, or to support Boston Strong (Figure 7: 1, 2, 3). Tweets in the anecdote-others category introduced others’ anecdotes (Figure 7:4). In both categories, images were usually used for illustrating the anecdotes or stories. For both categories, direct photos were dominantly used (83% and 95%, respectively). While images in the anecdote-others messages mostly used visual components for illustrating the story (75%), anecdote-me/self-promotion categories often utilised texts in images to provide additional information in detail (42% of tweets used images having texts).
The alert category included tweets alerting people for their safety, or searching for suspects. Images in this category were used to communicate text messages that could not be included in 140-character-tweet messages, or to emphasise critical information, so high percentages of text only (48%) or image with text only (9%) were noticeable in this category (Figure 8:1,2). There were tweets that advertised products, with images of their products (Figure 8: 3). In this category, the images used for showing products and text were often used to provide additional information on the products (67% of images integrated text in them). Consequently for these two categories images of visual components only were relatively rarely used (35% and 25%, respectively).
Tweets that were categorised in the emotion category expressed their support to Boston, condolences to victims, feelings (such as sadness and anger) on the bombing, and stories related to the victims (Figure 9). Sometimes, people expressed their emotions on specific stories or facts, and used images for illustrating those stories or facts (Figure 9: 2, 3). In this category, computer-generated graphs (or images) were often used to represent their emotions (12%). Compared to other categories, the percentage of images with visual components only was relatively low (38%); people often used texts for expressing their emotions using images with text (31%), or images with added text (21%).
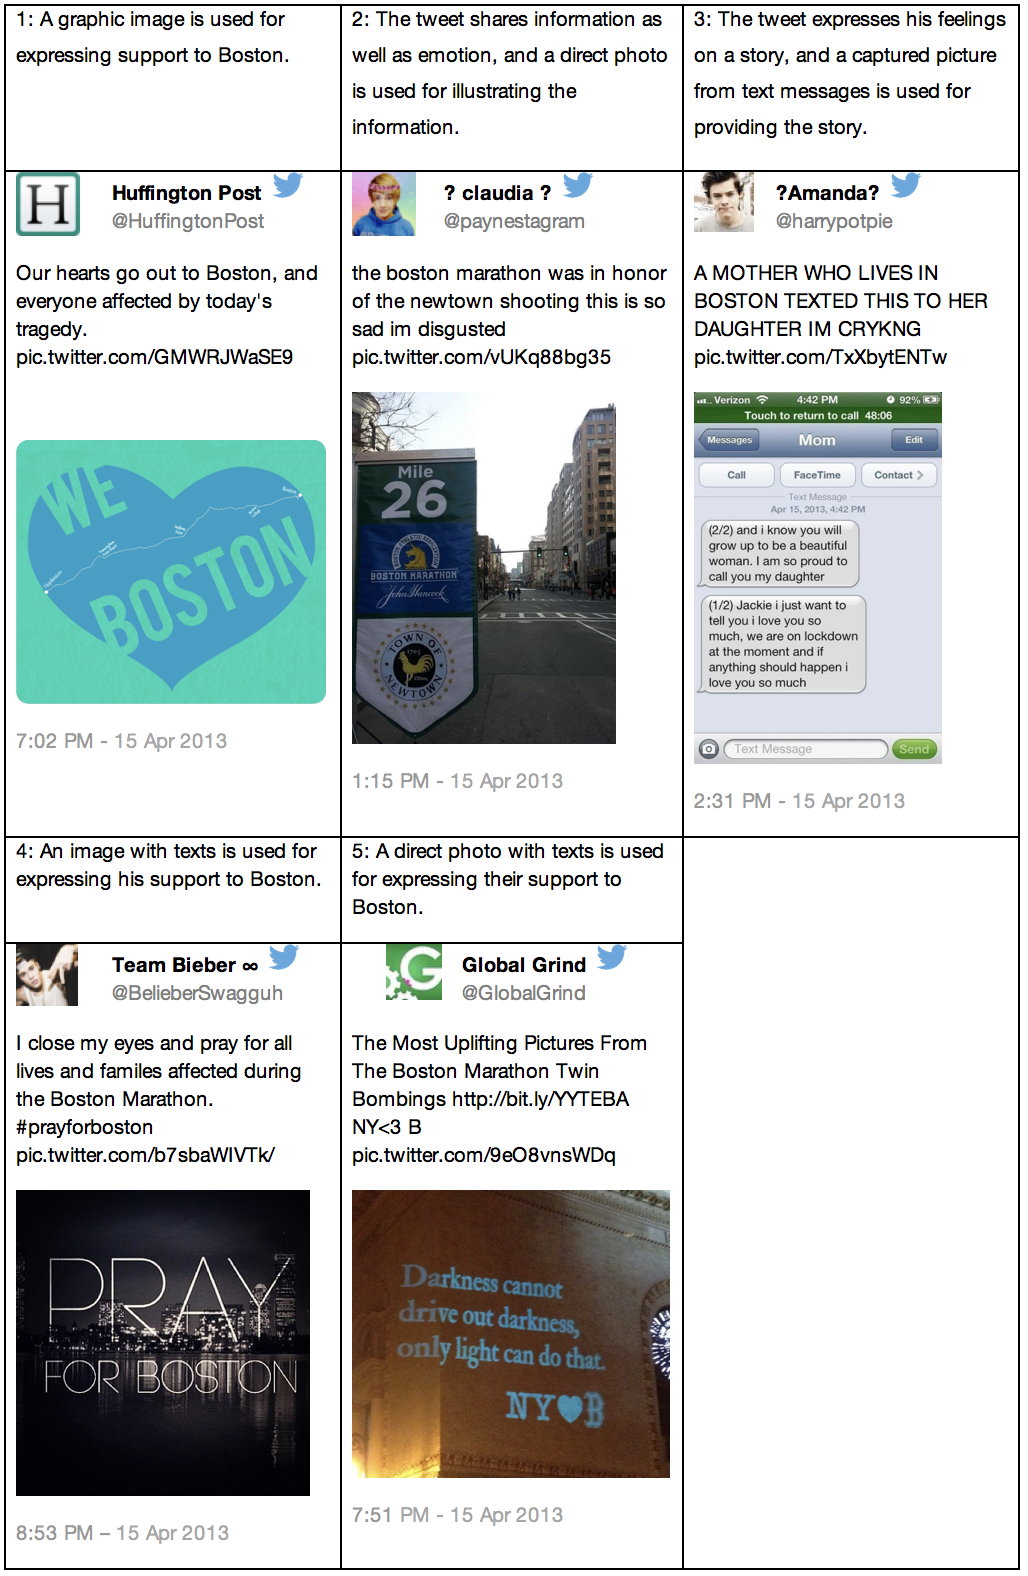
There were tweets that expressed opinions; those opinions were not only directly related to the Boston marathon bombing, but were also about other issues, while addressing the Boston marathon bombing. Some tweets used images as supplementary sources that showed the Boston bombing, but other images were used to strengthen their rationale, and in these cases, text was often embedded to emphasise their points (Figure 10). Similar to the emotion category, the percentage of the visual-only image category was low (35%), and people used text to express their opinion via images with text (33%), or images with added text (24%).
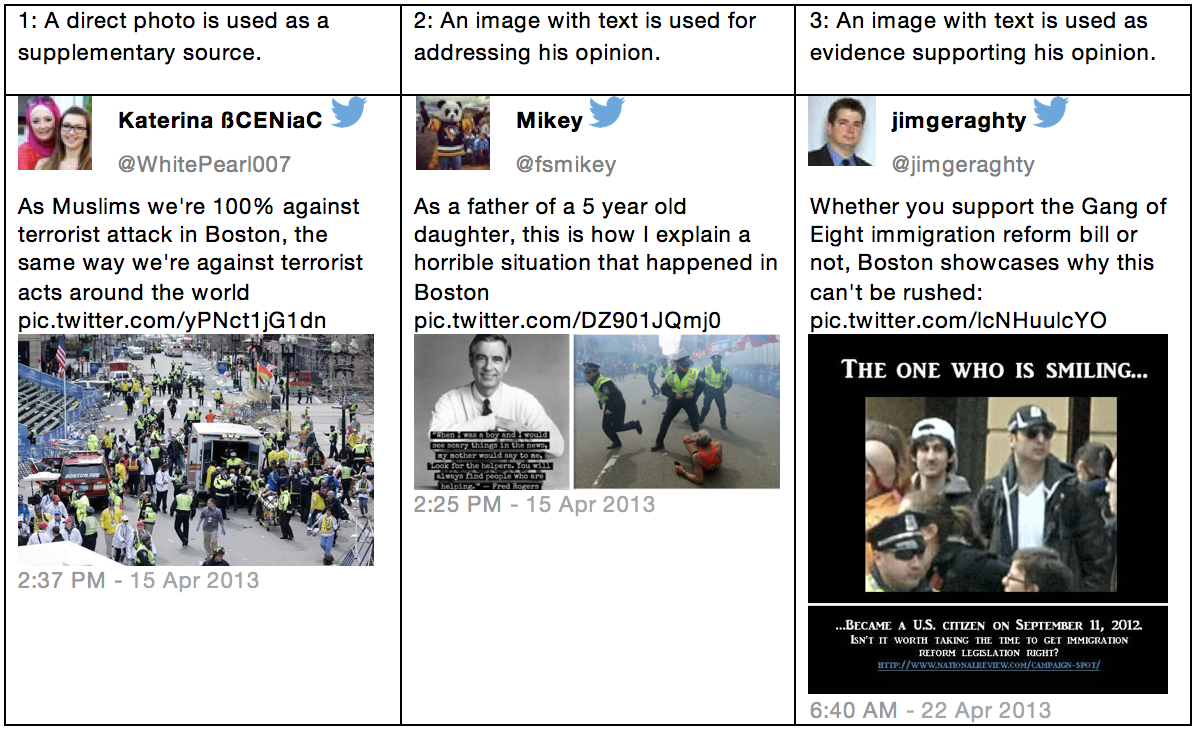
Tweets in the Call for action category included messages requesting help for Boston victims through monetary or blood donations, people’s cooperation in searching for suspects, and requesting any other help or cooperation. Whereas tweets requesting donations mostly included images as supplementary sources, tweets asking for peoples’ cooperation in searching for suspects used images as key sources of information that disseminated pictures of suspects. When asking for some action, text information was mostly included for detail (Figure 11).
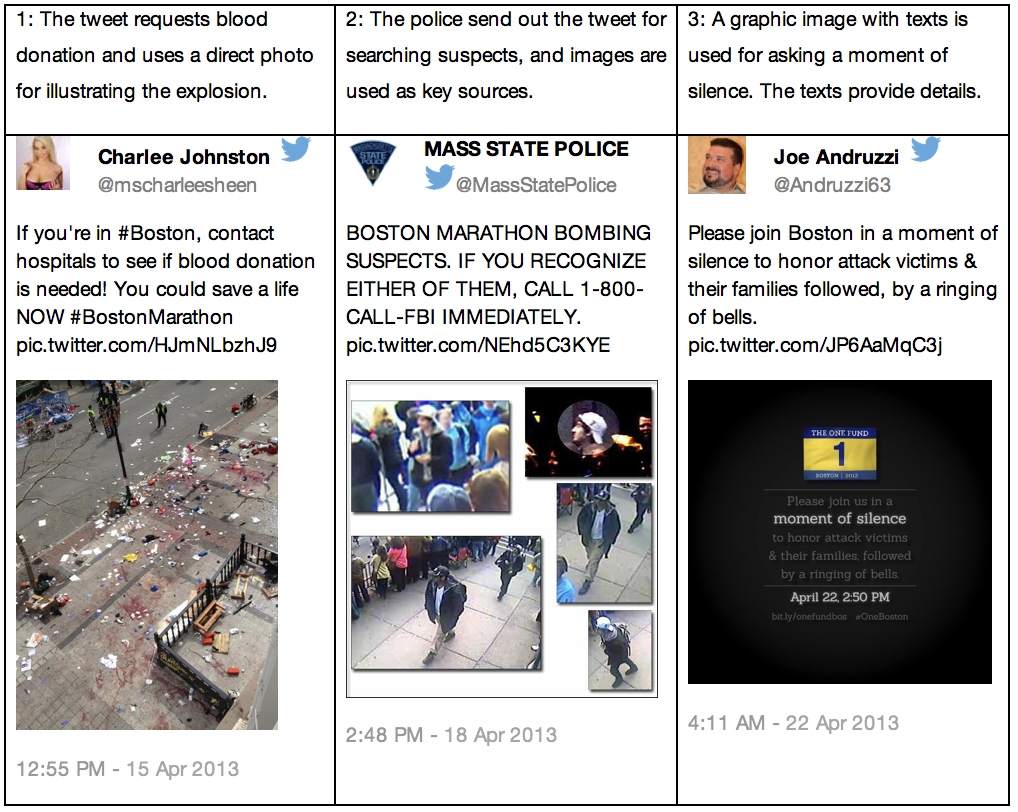
There were tweets that included links directed to original sources, mostly videos of TV news or full stories from newspapers or magazines (Figure 12: 1, 2). Some tweets asked people to retweet their tweets, to spread information (Figure 12: 3). Since tweets in these categories had main messages that were categorised in other categories, the features of the images differed, depending on their main messages.
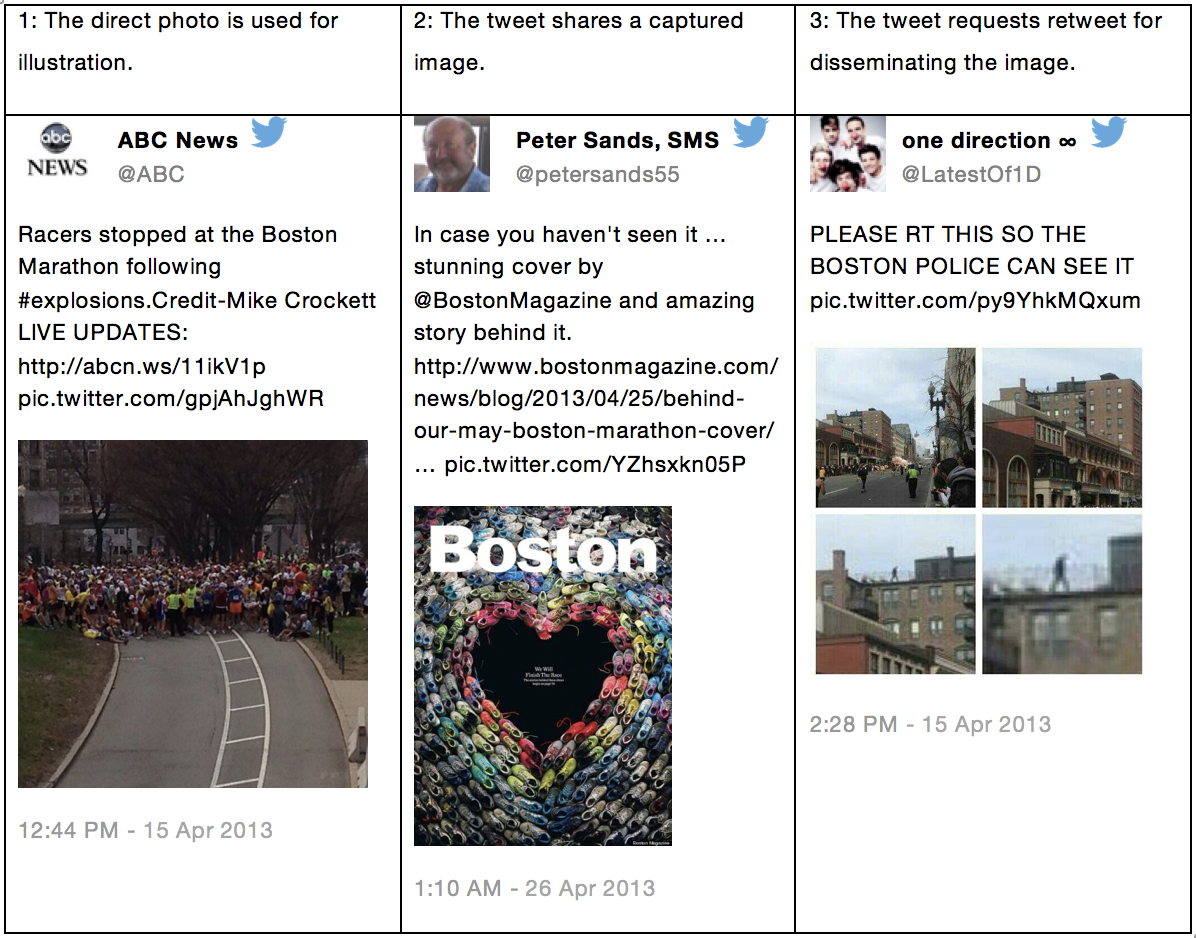
Discussion
RQ1: What are the characteristics of image uses in tweets in the case of Boston marathon bombing?
There have been studies that explored image uses in terms of motivation and purpose (Beaudoin, 2014; Chew, Rode and Sellen, 2010; Conniss, Ashford, and Graham, 2000; Laing and Massodian, 2014; Snyder, 2014). Relations between Twitter messages and the images in them could be explained via the frameworks that were proposed in previous studies. When applying Conniss, Ashford, and Graham’s (2000) six types of image uses to the current dataset, the most common image use was for illustration purposes. Twitter messages were used for: reporting breaking news, sharing information, sharing anecdotes of themselves or others, advertising, and expressing emotions often used images to illustrate related news, events, and stories. However, depending on the types of Twitter messages, different types of illustration were revealed. For the Twitter messages that communicate factual/objective information, such as breaking news, information, anecdote-me/others, and advertisement categories, images mostly duplicated the information given in the Twitter message. For these categories, although an image is not a complete duplication of the Twitter text message, the image was used to illustrate or highlight key messages in the Twitter text message or to provide evidence of the Twitter text message. For Twitter messages in the emotion, opinion, and call for action categories, images were used to illustrate background information of key messages of tweets.
Second, images used in the Twitter messages searching for suspects were examples of information dissemination according to Conniss, Ashford, and Graham’s (2000) six types of image uses. In this type of image use, images are key messages of the Twitter message, and the text message could not duplicate the image, but provide related/additional information of the image.
Third, some Twitter messages expressing their emotions/opinions, or calling for actions from the public, used images to stimulate emotions or thoughts (Emotive/persuasive category). This type of image use is well recognised, especially in advertising, public relations, and journalism, in which communication is considered as a matter of persuasion, and image is one of the infallible means of communication (Lester, 2003).
Finally, Twitter messages for alerts used visual components to convey their messages strongly, which may belong to aesthetic value.
RQ2: What are the characteristics of images which are used in tweets in the case of Boston marathon bombing?
This study results showed that people use diverse types of images, such as direct photos, captured images from TV, computers, mobile devices, and so on, and graphics (mostly computer graphics). Also, it was revealed that those images have not only visual components but also verbal components. Since the discussions on diverse types of images will be made in RQ3, this section will focus the relationship between the image and the text that is enclosed in the image.
In this dataset, there exist two types of interactions between images and texts. One is the relationship between tweets and images, which is mainly discussed in RQ1; the other is the relationship between the image and the text that is enclosed in the image. As shown in the Result section, 45% of images in this dataset enclosed text with diverse format: images with text (a direct photo that includes text in a scene, or a captured news screen), image with added text (texts are added onto an image), image text only (the text is the main information, although visual information is included, such as a screen capture of a text message), and text only (the image format is only used to deliver text information). From this, three functions of text within images were observed. First, an image integrating both text and visual components delivered messages by interactions between them. Here, both text and visuals are equally important in delivering messages, and text and visuals have a complementary relationship. This type of function is often observed from a direct photograph of a scene that includes text. For example, in the picture of a message sent from Syria (Figure 6, #7), both visual components and text messages in the banner are equally important in conveying messages. Sometimes, texts are used to add fresh information to the image. For example, in advertisements, texts are often used to deliver additional information that cannot be found from the image itself.
Second, texts within an image often direct readers on how the image ought to be read. Barthes (1977) named this function of texts as anchorage, which is, “the text directs the reader through the signified of the image, causing him to avoid some and receive others; by means of an often subtle dispatching, it remote-controls him towards a meaning chosen in advance” (p. 40). As Hall (1981) mentioned, it is commonly found in captions on TV news screen. Whereas news captions direct readers based on objective information, this dataset also showed that people use texts to articulate their emotions, or to emphasise their opinions. This finding contrasts with our intuition that images represent implicit and subjective knowledge, and indicates instead that text is more associated with factual and object knowledge (Mathison, 2012).
Third, in some images, texts are a main source of information, and visual components provide supplementary contexts. For example, a Twitter agent may send a screen shot of a post on Facebook, in which the post is the key message that the agent wants to share, but the agent might purposely use the screen shot to show that it is a Facebook post that contains some likes by others.
RQ3: How can the characteristics of image use be reflected in research on image retrieval?
While observing and analysing datasets, the authors ended up with two suggestions for the image retrieval research agenda. First, the image retrieval field has focused on three types of images: the first type of images includes medical images, fingerprints, and trademarks, which mostly rely on content-based image retrieval techniques, and belong to the data pole in Fidel’s (1997) framework; the second type of images are artistic images that mostly rely on metadata schemes developed by libraries, museums, and archives; and the third type of images are those often used by the general public in their daily lives. Among the third type of images, the primary focus was direct photos; however, this study result shows that people use not only direct photos, but also captured images from TV, computers, mobile devices, and so on, as well as graphics (mostly computer graphics). As we did for direct photos, there should be studies on why and how people use captured images and graphics, and how we can improve image retrieval for these types of images. Specifically, investigations on the use of captured and manipulated images, and graphics in social media context can lead to different sets of image attributes which help to guide image indexing for those images, for instance, abstract aspects of image, such as symbol, emotion, theme, relationship, and atmosphere, and specific names of objects, events/activities, locations, and times.
Second, there has been a lack of studies exploring how images are used in relation to texts in the image retrieval field, and image retrieval has been approached separately from text retrieval. However, images and texts often co-occur to convey messages. Barthes (1977) addressed that
“…In order to find images given without words, it is doubtless necessary to go back to partially illiterate societies, to a sort of pictographic state of the image. From the moment of the appearance of the book, the linking of text and image is frequent, …” (p.38).
This study result showed that there exist active interactions between visual components and words. It has been known that more powerful communication occurs when visuals and words work together (Lester, 2003), and it has been shown that people often use both of them to effectively communicate with others. However, we still do not know what the relations are between words and images, how the relations operate on readers, and how those relations should be reflected in image representation and retrieval. Understanding relations between visual components and text may provide a better approach to enhancing image retrieval.
Limitations
A limitation of this study was that the dataset was limited to a single topic, the Boston marathon bombing, and only highly retweeted messages were analysed. In addition, although the keyword, ‘Boston’, was selected based on examinations of related tags from a tag-cloud result, there might be tweets which were about Boston bombing but did not include the keyword of Boston. Therefore, this specific dataset held unique features, and it is necessary to understand these features to interpret the study results. First, the dataset represents diverse types of Twitter messages. However, due to the topical and media features (i.e., the dataset included images) of the dataset, Twitter messages for reporting news, sharing information, and expressing emotions were dominant, and Twitter messages for sharing (updating) self-information, information seeking, and conversations were rarely or not found in this dataset. Second, since the current dataset collected Twitter messages that were categorised in the top category, all of the Twitter messages were retweeted messages, and the average number of retweets per message was 670. It is reasonable to infer that this topic might lead to a high frequency of retweeting. In addition to topical specialty, the format of this dataset has the features of highly retweeted messages. It has been revealed that Twitter messages containing URLs have a positive relationship with retweetability, and this was considered that Twitter is used for spreading webpages, images, and videos (Boyd, Golder and Lotan, 2010; Suh, et al., 2010). Third, this dataset showed the characteristics that were shown in news tweets. Media-related agents, especially online/social media newsagents, TV/Radio news, and individual newspersons, were dominant types of agents of this dataset. Some features that were found from previous studies on news tweets were also found in this dataset. For example, news agencies kept disseminating updates (Lasorsa, Lewis and Holton, 2012), news tweets were blended with opinions and emotions (Papacharissi and Olivera, 2012), and news agencies often provided their news outlets by providing links to original news sources (Cozma and Chen, 2013). Future study may include diverse topics, and the retweet distributions of Twitter messages.
Conclusion
This study aimed to understand how images are used in communication practices in the social network, Twitter. People used diverse types of images, including direct photos, captured images, computer graphics, and maps, in their Twitter messages. Depending on the type of Twitter message, the image use showed four categories: 1) to illustrate news, information, and anecdotes, 2) to disseminate visual information that cannot be provided through words, 3) to express emotions/opinions, or to call for action from the public, and 4) to add visual components to emphasise text messages. A considerable portion of images in Twitter messages (45%) enclosed texts. In some images, texts and visuals were equally important when conveying messages, and showed complementary relationship; whereas, in other images, texts were used to direct readers on how the image ought to be read. There were also images in which text was the main information, and the visual component just provided a supplementary context.
Based on the observed image uses in the context of social media, Twitter, the study findings suggest a few possible future research agendas. Image retrieval research should expand its scope by including diverse formats of images, such as captured images from TV, computers, and mobile devices, and graphics. It needs to discuss why and how people use captured images and graphics, and how we can improve image retrieval for these types of images. Specifically, we can investigate the use of captured and manipulated images, and graphics in order to point out unique image attributes for image representation. Identified image attributes may help to provide the guideline of image indexing for those images. For instance, we can discuss the ways of expanding the access points to images by including abstract aspects of image, such as symbol, emotion, theme, relationship, and atmosphere, and specific names of objects, events/activities, locations, and times. Another line of possible research is that image retrieval research should include further understandings on what relations exist between texts and images and how those relations should be reflected in image representation and retrieval. Understanding the relations between images and text may provide a better approach to enhancing image retrieval from the perspective of users’ image uses. More specifically, future research can examine the relationship between texts and images with analysing the textual information for an integrated retrieval for texts and image.
Acknowledgements
The authors would like to thank three research assistants, Boram Lee and You-Kyoung Lee, for the data processing and visualisation of data, and Jenny Tolbert for editing the paper.
About the author
JungWon Yoon is an Associate Professor in the School of Information, University of South Florida, 4202 E. Fowler Ave. CIS 1040, Tampa, FL 33620-7800, USA. She received her Bachelor's degree in Library and Information Science and Master of Library and Information Science from Ewha Womans University, Seoul, Korea, and her Ph.D. in Information Science from the University of North Texas. She can be contacted at jyoon@usf.edu.
EunKyung Chung (corresponding author) is an Associate Professor in the Department of Library and Information, Ewha Womans University, 52 Ewhayeodae-gil, Seodaemun-gu, Seoul, South Korea. She received her Bachelor's degree in Library and Information Science from Ewha Womans University, her master's degree in Computer Science and Ph.D. in Information Science from the University of North Texas. She can be contacted at echung@ewha.ac.kr ORCID No. orcid.org/0000-0001-9896-8623