Balancing efficiency and effectiveness for fusion-based search engines in the 'big data' environment
Jieyu Li, Chunlan Huang, Xiuhong Wang and Shengli Wu
Introduction
In the big data age, we have to deal with a tremendous amount of information, which can be collected from various types of sources. For many information search systems, the corpora they use become larger and larger. A typical example is the Web. According to worldwidewebsize, the indexed Web contains at least 4.64 billion pages as of 12April, 2015. Some collections used in many information retrieval and Web search evaluation events such as TREC (the Text REtrieval Conference, held annually by National Institute of Standard and Technology of the USA) are also very large. For example, ClueWeb09 has over one billion documents and ClueWeb12 has over 800 million documents.
The big data environment brings some challenges to information search. For some queries, an information search engine needs to retrieve a large number of documents. With very large number of documents, it is even more difficult for an information search engine to locate more useful and relevant information so as to satisfy users’ information needs. To improve effectiveness of the results by locating more relevant document and ranking them on some top-ranked positions in the resultant lists, more and more complex and expensive search techniques have been explored and used. For example, when ranking Web documents for the given information need, Web search engines not only consider the relevance of the documents to the information need, they also take the authority of the Web sites that hold the Web pages into consideration.
Usually, the authority of Web sites is estimated by link analysis, which requires data about links (Nunes, Ribeiro and Gabriel, 2013) between large numbers of Web pages. Page rank (Brin and Page, 1998) and HITS (Kleinberg, 1999) are two well-known algorithms for such a purpose. There are also many other methods such as entity detection, user log analysis for personalized preference, user feedback and query expansion, phrase recognition and structural analysis, knowledge-based approach for word correction and suggestion, and so on. Many of these data-intensive tasks are commonly used in Web search engines. On the other hand, efficiency, which concerns the time needed for the search system to do a search task, becomes a big problem because of the huge number of documents and related data involved and complex and expensive techniques used (Baeza-Yates and Cambazoglu, 2014;Francès, Bai, Cambazoglu and Baeza-Yates, 2014). This has to be considered when the response time of a search system reaches the level that might go beyond users' tolerance.
In this paper, we are going to address this within a particular type of information search system that is implemented through the fusion approach. This approach is popular and often referred to as rank aggregation or learn to rank. Previous research shows that fusion is an attractive option on information search (Wu, 2012; Liu, 2011).
Data fusion works as follows: instead of using one information search model, we use multiple search models working together for any search task. For a given query, all of the component search models search the same collection of documents and each of them contributes a ranked list of documents as a composite result. Then a selected data fusion algorithm is applied to all the results involved and the combined result is generated accordingly as the final result for the user. Usually we take all the documents from all component results for fusion because it is believed that the more documents we use, the more information we can obtain and, therefore, the better fused result we can obtain. Effectiveness is the only concern in almost all the cases. Figure 1 shows its structure with three search models.
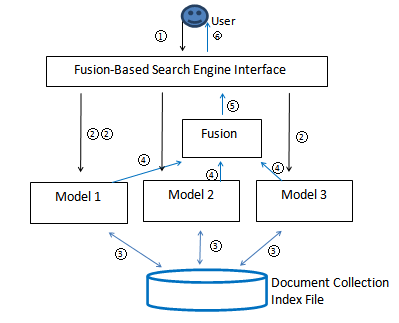
In Figure 1, the first step is that the user issues a query to the search engine interface (Step 1), which forwards it to multiple search models (Step 2). Each of those search models works with the index files and the same document collection (Step 3) to obtain the result. After that, the models forward the results to the fusion algorithm (Step 4) and the fusion algorithm combines those results and transfers the fused result to the interface (Step 5). Finally, the result is presented to the user (Step 6). In Figure 1, all three search engines work with the same document collection and related index files. It is possible that each search model may work with a different document collection. This case is usually referred to as federated search (Shokouhi and Si, 2011). In this paper, we focus on the scenario of data fusion with all search models working on the same document collection.
Data fusion has been extensively used in many information search tasks such as expert search (Balog, Azzopardi and de Rijke, 2009), blog opinion search (Orimaye. Alhashmi and Siew, 2015), and search for diversified results (Santos, Macdonald and Ounis, 2012), among others. In many information search tasks, a traditional search model like BM25 is not enough. A lot of other techniques have also been applied. Let us take Web search as an example. Many aspects including link analysis, personalized ranking of documents, diversified ranking of documents to let results cover more sub-topics, and so on, have been provided by many Web search engines (Web search engine, 2015). Traditional search models, such as BM25 or other alternatives, are just one part of the whole system. To combine those results from different ranking components, data fusion is required. In our experiments that use three groups of data from TREC, some of the information retrieval systems involved (such as uogTrA42, ICTNET11ADR3, srchvrs11b, uogTRA45Vm, ICTNET11ADR2, ivoryL2Rb, srchvrs12c09, uogTRA44xi) use BM25 as a component. Experimental results show that data fusion can improve performance over those component systems.
In the big data environment, we need to reconsider the whole process carefully. Compared with some other solutions, the data fusion approach is more complex because it runs multiple search models concurrently and an extra layer of fusion component is also necessary. It is more expensive in the sense that more resources and more time are required. Both effectiveness and efficiency become equally important aspects. This can be looked at from the sides of both user and system. First let us look at it from the user side. In some applications such as Web search, very often users want to find some, but not all, relevant documents. If the user finds some relevant pages, then it is very likely that s/he will stop looking for further relevant information (Cossock and Zhang, 2006). In this paper, we try to find solutions for such a situation. From the system side, we can deal with this in different ways. First of all, if a user has no interest in reading a lot of documents, then the search system does not need to retrieve too many of them in the first place. Secondly, if we consider this issue in the framework of data fusion, then we can deal with it in several ways. Among others, four of them are as follows:
- If there are a lot of candidates for component search models, then we may just choose a subset of them for submitting results to the fusion algorithm.
- We may let each search model to retrieve only a limited number of documents rather than all the documents that have a certain estimated probability of being relevant to the query.
- For the fused result, we may generate a limited number of documents as the result.
- Some data fusion methods need training data to determine weights for each search model or some parameters for the fusion algorithm. How much data we use for the training purpose can be investigated
For each aforementioned issue , we have different options of choosing how many documents or models or data. Generally speaking, if we use less information in those search models, then we may achieve higher efficiency, but with possible loss of effectiveness. Thus we need a balanced decision to addressing both of them at the same time. To our knowledge, these issues have not been addressed before. In this paper, we investigate the last two of the aforementioned issues.
The rest of this paper is organized as follows: in the next section we discuss some related work. This is followed by a presentation of the data fusion method used in this study and also some necessary background information. Related experimental settings and results are then reported and our conclusions are presented.
Previous work
In information retrieval and Web search, many data fusion methods such as CombSum (Fox and Shaw, 1994), CombMNZ and its variants (Fox and Shaw, 1994;He and Wu, 2008), linear combination (Vogt and Cottrell, 1999; Wu, 2012), Borda count (Aslam and Montague, 2001), Condorcet fusion (Montague and Aslam, 2002),cluster-based fusion (Kozorovitsky and Kurland, 2011), fusion-based implicit diversification method (Liang and Ren and de Rijke, 2014), and others have been proposed. Ng and Kantor (2000) use a few variables to predict the effectiveness of data fusion (CombSum). However, almost all of them concern effectiveness of the fused result, while efficiency of the method has not been considered.
In some cases, fewer than all available documents are used for fusion. But the major reason of doing this is for some purpose other than improving efficiency.Two examples of this are by Lee (1997) and Spoerri (2007).
Lee (1997) carried out some experiments to compare the effectiveness of CombSum and CombMNZ. CombSum sums up the scores for each of the retrieved documents d, while CombMNZ multiplies this sum with an integer that indicates the number of results in which d obtains a score that is greater than 0. He observed that in various cases that CombMNZ outperformed CombSum. Different numbers of documents were taken from all the results to carry out the fusion. He also explained why CombMNZ was a good fusion method.
Spoerri (2007) carried out some data fusion experiments with different numbers of documents that are taken from component results. It was found that performance is better when fusing a few top-ranked documents than by fusing more documents in the resultant lists. Some explanation to this phenomenon was given. In both cases, the purpose of researchers who use various numbers of documents for fusion is to try to understand the characteristics of data fusion methods CombSum and CombMNZ.
Linear combination (Wu, 2012, Chapter 5) is a good data fusion method because of its flexibility. Different weights can be assigned to different information search systems, so as to deal with various kinds of situations such as varying effectiveness among different search models. Then a weighted sum of all scores is given to any document involved. The key issue of linear combination is how to assign weights to all the component information search systems involved. Weights can be assigned in different ways including heuristic methods (Wu, 2012, Chapter 5.1-5.3), statistical methods such as multiple linear regression (Wu, 2012, Chapter 5.4), and optimization methods such as conjugate gradient (Bartell, Cottrell and Belew 1994), golden section search (Vogt and Cottrell, 1999), and genetic algorithms (Ghosh, Parui and Majumder, 2015).
Score normalization is a related issue to data fusion in information retrieval. Score normalization can be divided into three categories: normalizing raw scores, converting ranking information into scores and mixed methods(Wu, 2012, Chapter4). A number of methods have been proposed and investigated in each category. For normalizing raw scores, the successes of a specific method depends on how the raw scores are generated, which may be different from one system to another. For the second category, different curves such as the logistic function, the reciprocal function, the logarithmic function, the cubic function, and others have been investigated. Some of these functions are comparable in estimating ranking-score mapping.
The primary objective of this study is to find good fusion-based solutions for Web search in the big data search environment. Both effectiveness and efficiency are considered. Considering that linear combination with weights trained by multiple linear regression is very good, in this study we focus on this method. We would investigate the effect of different parameter settings to effectiveness and efficiency of this method.
Data fusion and linear combination
In this section, we discuss some data fusion methods that will be used later in this paper and some related issues. Among different data fusion methods, CombSum, CombMNZ, and linear combination are commonly used in many data fusion experiments and system implementations.
Suppose there are n information search systems iri (1≤i≤n), and for a given query q each of them retrieves a ranked list of p documents for (1≤k≤p). For example, if there are five information search systems and a document d obtains the scores of 0.4, 0.6, 0.6, 0.0, and 0.0 from them, then the final score of d is 0.4+0.6+0.6=1.6 for CombSum and 1.6*3=4.8 for CombMNZ. Note that in this example three out of five scores are greater than 0.
The linear combination method uses the following formula to calculate score for every document d:
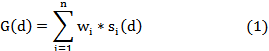
Here si(d) is the score of document d (normalized, see later for how to normalize scores) in result ri for (1≤i≤n), wi is the weight assigned to information search system iri, and G(d) is the calculated global score of d. CombSum is a special form of the linear combination method in which all the weights wi sum to 1. All the documents can be ranked according to their calculated scores.
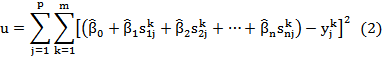
A few different methods have been proposed for how to decide weights by using some training data. In this paper, we use a multiple linear regression based method. According to (Wu, 2012, Chapter 5.4), this method is effective. Suppose in the training data set, there are n information search systems and m queries, and for each query qk (1≤k≤m), each of the information search systems provides a result ri (1≤i≤n) that comprises a ranked list of p documents (d1,d2,…,dp). with associated normalized scores s = (ski1, ski2, ...,skip). All the documents involved are judged by human assessors. That is to say, we know which document is relevant or non-relevant to which query. ykj =1 means that document dj is relevant to query qk and ykj =0 means that document dj is non-relevant to query qk. Thus multiple linear regression can be used to minimize the least squares of the difference between the estimated scores of all documents by linear combination (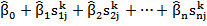 ) and the judged scores of those documents ( ykj ), or u in the following equation:
where  ,
,  ,…,
,…,  are parameters that need to be determined. These estimated values are used as weights (w1=
  ,…,wn= ) in the fusion process.
In this method, every document in ranked-lists is an observable object. Scores from component systems and from corresponding relevance judgment are elements. One characteristic of multiple linear regression for weights assignment is it treats all the documents equally and does not distinguish documents at different ranking positions. This method is good when the resultant lists are short or medium. However, when the resultant lists are very long, the method may not be very appropriate; for example, in Web search. This is because a list includes many documents but only the top-ranked ones are important. When paying equal attention to documents at all positions, the estimation is equally accurate for all the documents involved. Considering that what users really need is good results only in the top portion, and using fewer documents for training means higher efficiency, we may take some top-ranked documents, rather than the whole list, for the training purpose. Even if such a measure may not be helpful for performance improvement, it surely will be helpful for speeding up the training process.
Therefore, we divide all the documents in a result into three categories based on their rankings: important, average and ignorable. Different importance factors are set to documents in different categories for regression analysis. For the ignorable group, the importance factor is always zero in this study. For the other two categories of documents, we try different combinations to find good solutions. Importance factor f1, is assigned to group I (I for important) and importance factor fa is assigned to group A (A for average). We let f1 be larger than fa so that we can pay more attention to the documents in group I. This causes a bias on top-ranked documents and their coefficients for regression obtained is more accurate.
In practice, different fi and fa can be used. One extreme situation is that fa can be set to zero, which means documents in group Average are also ignored, the same as the ignorable group. The other extreme situation is that fi and fa are set the same value. Then all the documents in these two groups are treated equally. The above discussion motivates the following quantity of the least square estimates:
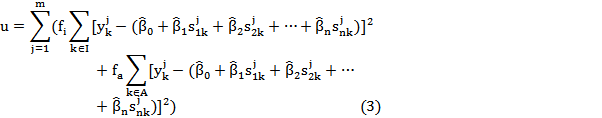
The meanings of these parameters are the same as in Equation 2.
The raw scores provided by different component search systems are based on different search models, so they are not comparable. Score normalization is required for those results to be ready for fusion. A varietal reciprocal function of rank is used in this study. Suppose that d1, d2, ..., dt are a ranked list of documents whose ranks are r1, r2, ..., rt respectively. The scores are normalized by si=1/(ri+60), 1≤i≤t, which decrease very rapidly with rank (Cormack, Clarke and Buettcher, 2009; Lillis, Toolan, Collier and Dunnion, 2006). According to (Cormack, et al., 2009), scores generated by this function is good. A constant of 60 is used to reduce the impact of a few documents at the highest ranks.
Experiments
The purpose of this empirical study is to investigate both effectiveness and efficiency of the linear combination method. Three groups of historical TREC data are used in the experiment. They are runs submitted to the ad hoc task of the 2010, 2011 and 2012 Web tracks. In the three successive years between 2010 and 2012, a very large collection of documents ClueWeb09 was used. Every run submitted includes up to 10,000 documents for each query. In each year group, we select eight top runs that are submitted by different participants. Their information is summarized in Table 1.
| 2010 Web Track | 2011 Web Track | 2012 Web Track |
|---|---|---|
| irra10b (0.1329) | DFalah11 (0.0794) | DFalah12 (0.1203) |
| IvoryL2Rb (0.1333) | ICTNET11ADR3 (0.1746) | ICTNET12ADR2 (0.0783) |
| msrsv3 (0.0822) | msrsv2011a3 (0.1720) | irra12c (0.1528) |
| THUIR10QaHt (0.1123) | srchvrs11b (0.1098) | QUTparaBline (0.1173) |
| UAMSA10mSF30 (0.0429) | UAmsM705tiLS (0.0852) | Qutwb (0.1307) |
| UMa10IASF (0.0804) | uogTrA45Vm (0.2025) | srchvrs12c09 (0.1256) |
| umassSDMW (0.1482) | UWatMDSqlt (0.1349) | uogTrA44xi (0.2123) |
| uogTrA42 (0.1271) | uwBAadhoc (0.0785) | utw2012fc1 (0.0610) |
We consider that these results provide a good platform to test data fusion methods for our purpose because of the relatively large number of documents involved in each result and the huge number of documents in the whole collection. The reciprocal function is used to convert rankings to normalized scores for all the documents involved in the experiment. To make the results more reliable, we use the five-fold cross validation method (Kohavi, 1995)to test the fusion method. In a year group, all fifty queries are divided into five groups of equal size (1-10, 11-20, 21-30, 31-40, and 41-50). Four groups of them are used as training data to obtain weights for all the search systems involved, and the remaining one is used for fusion. All five groups are tested in such a way. A number of commonly used metrics are used for retrieval evaluation (Baeza-Yates and Ribeiro-Neto, 2011, Chapter 4; Clough and Sanderson, 2013). They are average precision over all relevant documents (AP), recall-level precision (RP), precision at 10 document levels (P@10), and normalized discount cumulative gain at 20 document level (NDCG@20). Apart from linear combination, we also test CombSum and CombMNZ for comparison.
In the following four subsections we report four groups of experimental results. The first three groups concern effectiveness of the fused result, each of which uses different settings; while the fourth group concerns efficiency.
Experiment 1
Linear combination needs some training data to set weights for all the component search systems involved. The main purpose of this experiment is to answer the question: If we use less training data for weights assignment, how does it affect fusion results? Therefore, in this experiment, we use 100 to 1000 top-ranked documents in the training process for obtaining weights, then fuse all the available documents by linear combination. The baseline, LC-all, uses all 10000 documents available for training. In the fusion process, all 10000 documents are used for all the data fusion methods involved.
Tables 2-4 show the results, in which LC-all denotes linear combination with all the 10,000 documents available for training, while LC-x denotes linear combination with x top-ranked documents for training. For both CombSum and CombMNZ, all 10000 documents are used for fusion.
Compared with LC-all, LC-x may go either way in different settings. Generally speaking, using fewer documents in the training process does not affect fusion effectiveness very much. Even when using as few as 100 top-ranked documents (1 percent of all the documents available) for training, its fusion effectiveness is still comparable to that of using all the documents. This is the major observation point of this experiment.
Some other observations are also made. Compared with the average of all component results, data fusion methods perform much better. Compared with the best component result, all data fusion methods perform much better if measured by AP or RP (the only exception happens to CombMNZ in the year group of 2011 and measured by RP). Let us take AP as an example. The improvement rates of LC-1000 over the best component results are 70.99%, 38.17%, and 34.20% in the three data sets. But if measured by two other metrics RR and P@10, the fused results are comparable with the best component result. This suggests that data fusion methods are more favourable to system-oriented metrics such as AP and RP than to user-oriented metrics such as RR and P@10. Comparing CombSum with CombMNZ, we find thatCombSum is very likely better than CombMNZ. But sometimes the conclusion is not consistent across different measures.
| Method | AP | RP | RR | P@10 | NDCG@20 |
|---|---|---|---|---|---|
| Best | 0.1482 | 0.2067 | 0.6581 | 0.4979 | 0.2932 |
| Average | 0.1074 | 0.1639 | 0.5631 | 0.3794 | 0.2234 |
| CombSum | 0.2520 | 0.2954 | 0.7281 | 0.4729 | 0.3099 |
| CombMNZ | 0.2310 | 0.2766 | 0.7146 | 0.4896 | 0.2992 |
| LC-all | 0.2545 | 0.3042 | 0.7363 | 0.4792 | 0.3055 |
| LC-100 | 0.2410 | 0.2867 | 0.6980 | 0.5063 | 0.3149 |
| (-5.30%) | (-5.75%) | (-5.20%) | (+5.66%) | (+3.08%) | |
| LC-200 | 0.2517 | 0.2994 | 0.7370 | 0.4896 | 0.3089 |
| (-1.10%) | (-1.58%) | (+0.10%) | (+2.17%) | (+1.12%) | |
| LC-300 | 0.2539 | 0.3030 | 0.7457 | 0.4813 | 0.3095 |
| (-0.24%) | (-0.39%) | (+1.28%) | (+0.44%) | (+1.32%) | |
| LC-400 | 0.2546 | 0.3046 | 0.7460 | 0.4708 | 0.3075 |
| (+0.04%) | (+0.13%) | (+1.32%) | (-1.75%) | (+0.66%) | |
| LC-500 | 0.2545 | 0.3040 | 0.7427 | 0.4750 | 0.3057 |
| 0.00% | (-0.07%) | (+0.87%) | (-0.88%) | (+0.07%) | |
| LC-600 | 0.2546 | 0.3041 | 0.7423 | 0.4750 | 0.3059 |
| -0.04% | (-0.03%) | (+0.81%) | (-0.88%) | (+0.12%) | |
| LC-700 | 0.2547 | 0.3053 | 0.7425 | 0.4833 | 0.3056 |
| (+0.08%) | (+0.36%) | (+0.84%) | (+0.86%) | (+0.03%) | |
| LC-800 | 0.2548 | 0.3061 | 0.7427 | 0.4813 | 0.3057 |
| (+0.12%) | (+0.62%) | (+0.87%) | (+0.44%) | (+0.08%) | |
| LC-900 | 0.2549 | 0.3056 | 0.7404 | 0.4813 | 0.3063 |
| (+0.16%) | (+0.46%) | (+0.56%) | (+0.44%) | (+0.27%) | |
| LC-1000 | 0.2549 | 0.3056 | 0.7365 | 0.4813 | 0.3051 |
| (+0.16%) | (+0.46%) | (+0.03%) | +0.44%) | (-0.11%) | |
| LC-all denotes training with all 10000 documents and LC-x denotes training with top x documents, the figures in bold indicate that they are different significantly from the one obtained from LC-all at a significance level of 0.05 | |||||
| Method | AP | RP | RR | P@10 | NDCG@20 |
|---|---|---|---|---|---|
| Best | 0.2025 | 0.2377 | 0.6479 | 0.3880 | 0.3052 |
| Average | 0.1296 | 0.1800 | 0.5548 | 0.3350 | 0.2393 |
| CombMNZ | 0.2133 | 0.2366 | 0.6442 | 0.3740 | 0.2502 |
| CombSum | 0.2517 | 0.2757 | 0.6376 | 0.400 | 0.2772 |
| LC-all | 0.2802 | 0.3008 | 0.6718 | 0.4340 | 0.3137 |
| LC-100 | 0.2783 | 0.2962 | 0.6600 | 0.4360 | 0.3110 |
| (-0.68%) | (-1.53%) | (-1.76%) | (+0.46%) | (-0.86%) | |
| LC-200 | 0.2801 | 0.2986 | 0.6717 | 0.4360 | 0.3143 |
| (-0.04%) | (-0.73%) | (-0.01%) | (+0.46%) | (+0.19%) | |
| LC-500 | 0.2803 | 0.2994 | 0.6725 | 0.4340 | 0.3105 |
| (+0.04%) | (-0.47%) | (+0.10%) | (±0.00%) | (-1.03%) | |
| LC-1000 | 0.2804 | 0.3003 | 0.6718 | 0.4360 | 0.3107 |
| (+0.07%) | (-0.17%) | (±0.00%) | (+0.46%) | (-0.97%) | |
| LC-all denotes training with all 10000 documents and LC-x denotes training with top x documents, the figures in bold indicate that they are different significantly from the one obtained from LC-all at a significance level of 0.05 | |||||
| Method | AP | RP | RR | P@10 | NDCG@20 |
|---|---|---|---|---|---|
| Best | 0.2123 | 0.2583 | 0.6515 | 0.5020 | 0.2383 |
| Average | 0.1248 | 0.1823 | 0.5381 | 0.3588 | 0.1634 |
| CombMNZ | 0.2397 | 0.2932 | 0.6718 | 0.4620 | 0.2248 |
| CombSum | 0.2732 | 0.3073 | 0.6901 | 0.4760 | 0.2260 |
| LC-all | 0.2827 | 0.3114 | 0.6530 | 0.4940 | 0.2259 |
| LC-100 | 0.2797 | 0.3017 | 0.6680 | 0.4860 | 0.2280 |
| (-1.06%) | (-3.11%) | (+2.30%) | (-1.62%) | (+0.93%) | |
| LC-200 | 0.2841 | 0.3140 | 0.6699 | 0.4800 | 0.2279 |
| (+0.50%) | (+0.83%) | (+2.59%) | (-2.83%) | (+0.87%) | |
| LC-500 | 0.2852 | 0.3175 | 0.6703 | 0.4820 | 0.2242 |
| (+0.88%) | (+1.96%) | (+2.65%) | (-2.43%) | (-0.77%) | |
| LC-1000 | 0.2848 | 0.3170 | 0.6674 | 0.4860 | 0.2248 |
| (+0.74%) | (+1.80%) | (+2.21%) | (-1.62%) | (-0.48%) | |
| LC-all denotes training with all 10000 documents and LC-x denotes training with top x documents, the figures in bold indicate that they are different significantly from the one obtained from LC-all at a significance level of 0.05 | |||||
Experiment 2
In this experiment, we use fewer documents for both training and fusion. For the training process, the top 1000 ranked documents (10% of all available documents) in all component results are used for multiple linear regression to obtain weights. For results fusion, linear combination is used with different number of documents from top 100 (1% of all 10000 documents), 200 (2%), 300 (3%),…, to 1000 (10%), as well as all the documents available (10000). The results are shown in Tables 5, 6 and 7 for three year groups, respectively. In these tables, LC-all denotes linear combination,which uses all 10000 documents for both weights assignment training and results fusion; LC-x, where x is a number, denotes linear combination that uses top-1000 documents for weights assignment training and uses x top-ranked documents for fusion. The figures in parentheses are the improvement of the method over LC-all and the figures in bold indicate that they are different from LC-all at a significance level of 0.05. From these tables, we can see that compared with using all 10000 documents for training and fusion(LC-all), using 100 to 1000 top-ranked documents for training and fusion can achieve comparable effectiveness. In some cases, the differences between them are small and not significant.
| Method | AP | RP | RR | P@10 | NDCG@20 |
|---|---|---|---|---|---|
| Best | 0.1482 | 0.2067 | 0.6581 | 0.4979 | 0.2932 |
| Average | 0.1074 | 0.1639 | 0.5631 | 0.3794 | 0.2234 |
| LC-all | 0.2545 | 0.3042 | 0.7363 | 0.4792 | 0.3055 |
| LC-100 | 0.2342 | 0.2992 | 0.7343 | 0.5042 | 0.3108 |
| (-7.98%) | (-1.64%) | (-0.27%) | (+5.22%) | (+1.74%) | |
| LC-200 | 0.2472 | 0.3073 | 0.7237 | 0.4833 | 0.303 |
| (-2.87%) | (+1.02%) | (-1.71%) | (+0.86%) | (-0.82%) | |
| LC-300 | 0.2486 | 0.3062 | 0.7350 | 0.4750 | 0.3044 |
| (-2.32%) | (+0.66%) | (-0.18%) | (-0.88%) | (-0.35%) | |
| LC-400 | 0.2498 | 0.3037 | 0.7346 | 0.4750 | 0.3027 |
| (-1.85%) | (-0.16%) | (-0.23%) | (-0.88%) | (-0.92%) | |
| LC-500 | 0.2513 | 0.3035 | 0.7356 | 0.4792 | 0.3032 |
| (-1.26%) | (-0.23%) | (-0.10%) | (±0.00%) | (-0.75%) | |
| LC-600 | 0.2521 | 0.3050 | 0.7340 | 0.4771 | 0.3017 |
| (-0.94%) | (+0.26%) | (-0.31%) | (-0.44%) | (-1.24%) | |
| LC-700 | 0.2527 | 0.3052 | 0.7340 | 0.4750 | 0.3028 |
| (-0.71%) | (+0.33%) | (-0.31%) | (-0.88%) | (-0.86%) | |
| LC-800 | 0.2532 | 0.3054 | 0.7365 | 0.4792 | 0.3031 |
| (-0.51%) | (+0.39%) | (+0.03%) | (±0.00%) | (-0.77%) | |
| LC-900 | 0.2534 | 0.3046 | 0.7365 | 0.4771 | 0.3027 |
| (-0.43%) | (+0.13%) | (+0.03%) | (-0.44%) | (-0.92%) | |
| LC-1000 | 0.2534 | 0.3047 | 0.7365 | 0.4792 | 0.3034 |
| (-0.43%) | (+0.16%) | (+0.03%) | (±0.00%) | (-0.67%) |
| Method | AP | RP | RR | P@10 | NDCG@20 |
|---|---|---|---|---|---|
| Best | 0.2025 | 0.2377 | 0.6479 | 0.3880 | 0.3052 |
| Average | 0.1296 | 0.1800 | 0.5548 | 0.3350 | 0.2393 |
| LC-all | 0.2802 | 0.3008 | 0.6718 | 0.4340 | 0.3137 |
| LC-100 | 0.2686 | 0.2959 | 0.6694 | 0.4260 | 0.3098 |
| (-4.14%) | (-1.63%) | (-0.36%) | (-1.84%) | (-1.23%) | |
| LC-200 | 0.2769 | 0.2952 | 0.6703 | 0.4340 | 0.3098 |
| (-1.18%) | (-1.86%) | (-0.22%) | (±0.00%) | (-1.24%) | |
| LC-500 | 0.2794 | 0.2951 | 0.6719 | 0.4300 | 0.3128 |
| (-0.29%) | (-1.89%) | (+0.01%) | (-0.92%) | (-0.29%) | |
| LC-1000 | 0.2798 | 0.2978 | 0.6719 | 0.4300 | 0.3123 |
| (-0.14%) | (-1.00%) | (+0.01%) | (-0.92%) | (-0.44%) | |
| LC-all denotes linear combination with all 10000 documents for fusion, LC-x, denotes linear combination with x top-ranked documents for fusion | |||||
| Method | AP | RP | RR | P@10 | NDCG@20 |
|---|---|---|---|---|---|
| Best | 0.2123 | 0.2583 | 0.6515 | 0.5020 | 0.2383 |
| Average | 0.1248 | 0.1823 | 0.5381 | 0.3588 | 0.1634 |
| LC-all | 0.2827 | 0.3114 | 0.6530 | 0.4940 | 0.2259 |
| LC-100 | 0.2811 | 0.3196 | 0.6699 | 0.4780 | 0.2223 |
| (-0.57%) | (+2.63%) | (+2.59%) | (-3.24%) | (-1.58%) | |
| LC-200 | 0.2826 | 0.3194 | 0.6672 | 0.4840 | 0.2235 |
| (-0.04%) | (+2.57%) | (+2.17%) | (-2.02%) | (-1.08%) | |
| LC-500 | 0.2847 | 0.3162 | 0.6687 | 0.4860 | 0.2247 |
| (+0.71%) | (+1.54%) | (+2.40%) | (-1.62%) | (-0.52%) | |
| LC-1000 | 0.2849 | 0.3168 | 0.6674 | 0.4880 | 0.2249 |
| (+0.78%) | (+1.73%) | (+2.21%) | (-1.21%) | (-0.46%) | |
| LC-all denotes linear combination with all 10,000 documents for fusion, LC-x, denotes linear combination with x top-ranked documents for fusion | |||||
Experiment 3
For the third experiment we divided the top-ranked 1000 documents into two categories. To emphasize the more significant documents, the top 100 documents are in category Important and are assigned with a heavier importance factor than the documents in category Average (documents at ranking position 101 to 1000). The importance factor for category Average is set to 1, while the importance factor for category Important is set to different values (1.2, 1.4, 1.6, 1.8 and 2.0). Thus we are able to train weights by using Equation 3. For the fusion process, all 10000 documents in every result are used for linear combination. The other parts of the setting are similar to that of Experiment 2.
The experimental results are shown in Tables 8, 9 and 10. The figures in parentheses are improvement rate of the method over LC-all. WR-x uses weighted regression method to train final components' weights, where x is the importance factor assigned to documents in category Important. Heavier weights than 2.0 are also tried but the results are worse. Therefore, those experimental results are not presented.
We can also see that the linear combination performs well on AP and RP, always better than the best component result. For all other three measures the difference between linear combination and other methods is small. In many cases, the difference between WR-x and LC-all is small.
| Method | AP | RP | RR | P@10 | NDCG@20 |
|---|---|---|---|---|---|
| Best | 0.1877 | 0.2342 | 0.6525 | 0.4626 | 0.2789 |
| Average | 0.1206 | 0.1754 | 0.5520 | 0.3577 | 0.2087 |
| LC-all | 0.2730 | 0.3054 | 0.6870 | 0.4691 | 0.2817 |
| WR-1.2 | 0.2731 | 0.3049 | 0.6936 | 0.4630 | 0.2817 |
| (+0.04%) | (-0.16%) | (+0.96%) | (-1.30%) | (±0.00%) | |
| WR-1.4 | 0.2729 | 0.3044 | 0.6935 | 0.4650 | 0.2829 |
| (-0.04%) | (-0.33%) | (+0.95%) | (-0.87%) | (+0.43%) | |
| WR-1.6 | 0.2720 | 0.3039 | 0.6866 | 0.4658 | 0.2842 |
| (-0.36%) | (-0.49%) | (-0.06%) | (-0.70%) | (+0.89%) | |
| WR-1.8 | 0.2714 | 0.3023 | 0.6866 | 0.4699 | 0.2845 |
| (-0.59%) | (-1.01%) | (-0.06%) | (+0.17%) | (+0.99%) | |
| WR-2.0 | 0.2710 | 0.3009 | 0.6876 | 0.4706 | 0.2847 |
| (-0.73%) | (-1.47%) | (+0.09%) | (+0.32%) | (+1.06%) |
The results look different when different metrics are used. When AP and RP are used as evaluation metrics, the fused results with WR-1.2 to WR-2.0 are more likely to be a little worse than with LC-all. On the other hand, when RR, P@10, and NDCG@20 are used as evaluation metrics, the fused results with WR-1.2 to WR-2.0 are more likely to be a little better than with LC-all. This is understandable because AP and RP are system-oriented metrics, which consider relevant documents at all ranks; while RR, P@10, and NDCG@20 are user-oriented metrics, which only consider a few top-ranked documents. In all the cases difference is small and not significant.
From the above three experiments, we have a few observations. 1. Using a small percentage of top-ranked documents for weight assignment can be as effective as using all the documents available; 2. For weights assignment, further dividing top-ranked documents into two different categories may not obtain consistent improvement, no matter which measure is used. 3. For the fused results, a long list of documents is more likely to be helpful for improving effectiveness than a short one, especially on those system-oriented metrics such as AP and RP. The effect is not obvious when user-oriented measures such as P@10 and RR are used. Therefore, if possible, we should avoid using too few documents (e.g., less than 5%) for fusion so as to allow the fused result to attain reasonably good effectiveness.
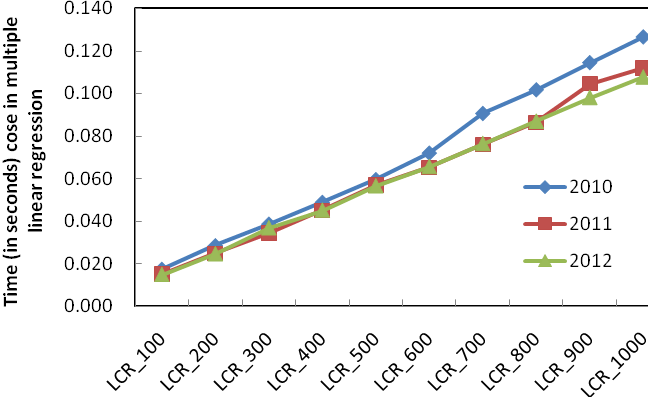
(a) Without the case of 10,000 documents
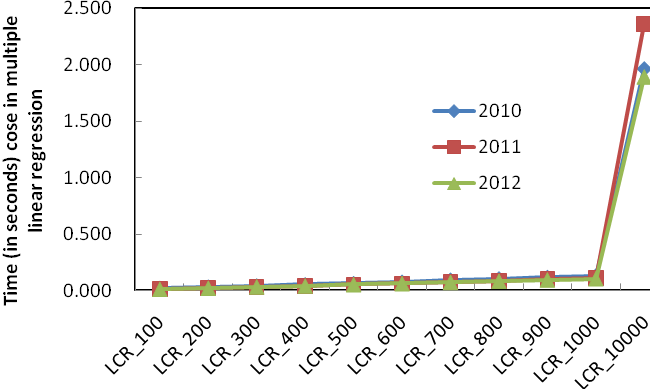
(b) With the case of 10,000 documents
Figure 2: Time (in seconds) needed for multiple linear regression of fused results with different numbers of training documents in three year groups
Experiment 4
Finally we tested efficiency of fusing different number of documents. In this experiment we test the time required for weights assignment training and fusion with different number of documents. The curve in Figure 2 demonstrates that with fewer documents for the training process, the time cost in linear regression is much less than that with all the documents available. According to the above effectiveness of the fused results with part training data, it is useful to reduce the scale of training data by selecting the documents in top positions instead of the whole set, so that we can save more time to achieve a not bad or an equally-effective result.
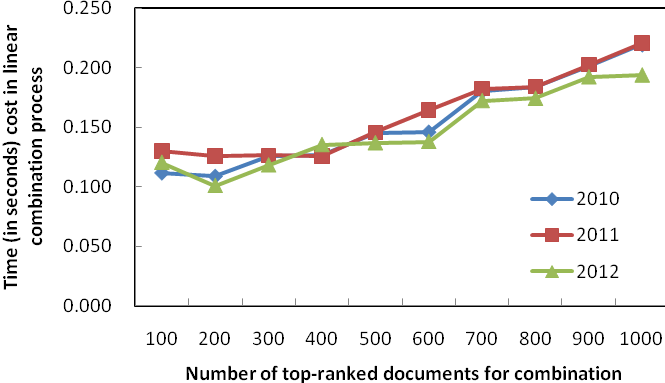
(a) Without the case of 10,000 documents
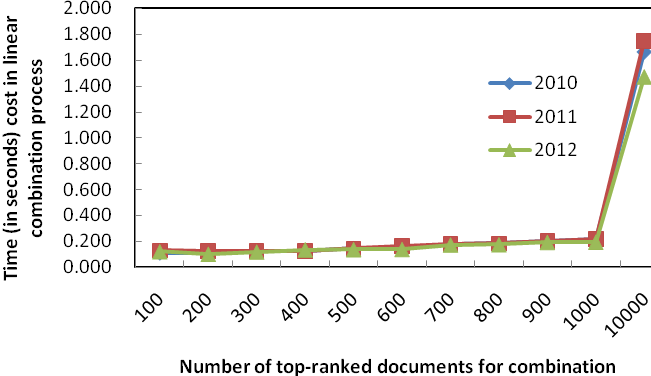
(b) With the case of 10,000 documents
Figure 3: Efficiency of fusing different number of documents
We also tested the time required for fusing different number of documents. Figure 3 shows the time taken. If fusing results with top 100 documents, the time needed is 0.11-0.13 seconds for each of the three data sets. Then the time needed increases almost linearly when more documents are fused. The time needed for fusing top-1000 documents is 0.19-0.22 seconds, and the time needed for fusing all 10000 documents is 1.47-1.76 seconds. Considerable difference exists between fusing all 10000 documents and fusing several hundred to one thousand documents. Considering both effectiveness and efficiency, we can see that fusing top 500 to 1000 documents in all component results is a very good solution. Compared with fusing all the documents in all component results, the latter can generate as effective final result as the former, while the time needed for the latter is only 10% to 15% of the time for the former.
Conclusions
In this paper we have investigated some key strategic issues when implementing information search systems through data fusion with a big collection of documents. The major contribution of this paper is that it considers both effectivness and efficiency of data fusion methods in information search (previous related research has focused on effectivenss of the methods with little attention paid to efficiency). Efficiency becomes more important when using big document collections and related data search.
Through experiments with three groups of TREC data, we have demonstrated that if the component resultant lists are very long then data fusion with a small percentage of top-ranked documents (5% to 10% in our experiment) can achieve as effective a result as data fusion with all the documents in the resultant lists. On the other hand, the efficiency of the system can be improved considerably by fusing fewer documents (10 times fast in our erperiment). Similarly, using a small percentage of top-ranked documents for weights assignment can obtain effective weights, but further dividing documents into more categories does not bring any improvement.
We believe that the results of this research are useful for the implementation of information search systems in the big data age. With large document collections, it is not necessary to pay equal attention to all the documents in the resultant lists. It is a better policy to consider only those top-ranked documents that are more likely to be relevant to the information need, either for training or for fusion. Thus effectiveness and efficiency of the search system can be balanced.
In the future, we plan to carry out more experiments with other data fusion methods such as Condorcet fusion and weighted Condorcet fusion. Two other questions raised in the introductory part of this paper also demand further investigation.
Acknowledgements
We thank the anonymous reviewers for their helpful comments.
About the authors
Jieyu Li is a Researcher in the Library of Jiangsu University, Zhenjiang, China. Her research interests include evaluation of information retrieval/Web search systems. She can be contacted at jli@ujs.edu.cn.
Chunlan Huang is a Ph.D. student in the School of Computer Science, Jiangsu University, Zhenjiang, China. Her research interests include data fusion models and query processing in information retrieval/Web search.
She can be contacted at palaceo77@163.com.
Xiuhong Wang is a Professor in the Library of Jiangsu University, Jiangsu University, Zhenjiang, China. Her research interests include patent retrieval systems and user retrieval studies. She can be contacted at Lib510@ujs.edu.cn.
Shengli Wu is a Professor in the School of Computer Science, Jiangsu University, Zhenjiang, China. His research interests include information retrieval/Web search, data mining and machine learning. He can be contacted at swu@ujs.edu.cn.