Physician adoption of electronic health records: a visualisation of the role of provider and state characteristics in incentive programme participation
Kalyani Ankem, Joshua Turpin and Vishal Uppala
Introduction
For a country that is pushing information technology, for instance, with smartphone technology, the United States has been behind in electronic health record implementation. Though the average electronic health record implementation in the European Union is 29%, the use of electronic health record systems within several countries in the union is over 50% (Pipersburgh, 2011). Specifically, 'Sweden is at 90 per cent, Netherlands at 88 per cent, Denmark at 62 per cent, and the United Kingdom at 58 per cent' (Pipersburgh, 2011, p. 56). In contrast, in 2009, only 10% of hospitals were using an electronic health record system in the United States (Pipersburgh, 2011). Out of this 10%, only 1.5% had a comprehensive electronic health record that includes comprehensive and broad documentation features such as problem lists, discharge summaries and advanced directives. Also, 7.6% of hospitals had a basic electronic health record with imaging and little to no computerised provider order entry. While hospitals had a 10% adoption rate in 2009, physicians had a 17% adoption rate.
Electronic health record systems contain electronic health records which are defined as a digital 'record of health-related information on an individual that can be created, gathered, managed, and consulted by authorised clinicians and staff within one health care organization' (Agency for Healthcare Research and Quality, n.d.). A systematic review conducted in 2013 found many barriers to the adoption of electronic health records (Ajami and Bagheri-Tadi, 2013). Significant barriers include the following: time required, cost of implementation, absence of computer skill, workflow disruption, privacy and security concerns, lack of incentives, complexity of implementation, concern over the ability to select and install an appropriate electronic health record system, technical support and complexity of interoperability within an organization and with electronic health record systems in outside hospitals and practices. The findings of Kruse, Mileski, Alaytsev, Carol and Williams (2015) later in a systematic review agree with the preceding.
While barriers exist, many benefits of using electronic health records have been identified: improved patient care, improved care coordination, practice efficiencies and cost savings, increased patient participation and improved diagnostics and patient outcomes. However, current evidence on accruing benefits is mixed. Nguyen, Bellucci and Nguyen (2014), in a recent systematic review, confirm the potential of electronic health records to improve clinical documentation and increase administrative efficiency toward better quality, safety and coordination in patient care, yet they point to changes to workflow and work disruption as negative impacts. Thus, the evidence in their systematic review shows positive as well as negative impacts of electronic health records. Nguyen, Bellucci and Nguyen (2014) go on to list several contingent factors that can contribute to successful implementation of electronic health records to reap the benefits.
Despite the benefits, the rate of adoption of electronic health records in the United States has been slow. Although a transition to the electronic health record was envisioned as early as 2004, the United States set a goal of transitioning completely by 2014. With the Health Information Technology for Economic and Clinical Health Act in 2009 and the Patient Protection and Affordable Care Act in 2010, these initiatives gathered further momentum. To boost the electronic health record adoption rate, the Centers for Medicare & Medicaid Services created meaningful use and incentive programmes in 2011, which give providers and hospitals financial incentives for meeting certain guidelines and adopting the electronic health record. The financial incentives offered in the Centers for Medicare & Medicaid meaningful use programmes are described in the section that follows. A majority of health care organizations and providers nationwide have implemented an electronic health record system, but some have only recently done so and some still have not.
Given the slow adoption of electronic health records in the United States, we were interested in understanding characteristics that lend to earlier adoption. Our focus in this paper is on characteristics associated with physicians' early adoption of the electronic health record. As both the individual and his or her surrounding area may be pertinent to this research, we chose to study both physician characteristics as well as characteristics of the state in which the physician practices to understand the early adoption of electronic health records.
Considering the benefits of electronic health records, various stakeholders interested in health care information technology innovation will find the research on early adoption useful. This study will inform health care professionals, administrators and governmental entities involved in health care reform in ways to approach health information technology integration in the future. To understand early adoption of electronic health records, we relied on data gathered in the Centers for Medicare & Medicaid Services incentive programmes (Blumenthal and Tavenner, 2010). Hence, the analysis is limited to the physicians who participated in these programmes. We used Tableau to visualise patterns in large data sets merged from existing data repositories.
Centers for Medicare & Medicaid Services incentive programmes
To get financial incentives from the Centers for Medicare & Medicaid Services, hospitals and providers must meet meaningful use guidelines in addition to adopting a certified electronic health record system. There are three stages of meaningful use with varying requirements, financial incentives and years of completion for each. The incentive programmes are designed to drive behaviour and provide support in overcoming one of the most significant barriers in the adoption of electronic health records--cost (Ketchersid, 2011). The HealthIT.gov (2013) website gives a good summary of each meaningful use stage:
Stage 1 in years 2011-2012 focuses on data capture and using that information to track key clinical conditions. Stage 2 in 2014 focuses on advanced clinical processes, more rigorous health information exchange, and more patient-controlled data. Stage 3 is in 2016 and consists of improved outcomes, patient access to self-management tools, and improving population health. (HealthIT.gov, 2013)
Each meaningful use stage has its own rules for hospitals and physicians. For example, Stage 1 requires hospitals to meet fourteen core objectives and an additional five from their choosing. Physicians must meet fifteen core objectives and an additional five from their choosing. In addition to the increase in electronic health record adoption rates from 2010-2012 that we have already mentioned, meaningful use had substantial growth in terms of objectives met ranging from 39% to 93% in certain areas. For example, 'The highest relative growth occurred in capabilities to engage patients and their families in their care, improve care coordination, and improve population and public health' (Jones and Furukawa 2014, p. 1258).
Electronic health record adoption in the United States
With a low adoption rate in 2009, electronic health record adoption rates grew in 2010-2012. The health centre adoption rate in 2010, in the study by Jones and Furukawa (2014), was 64.8%, but the health centres which reported having capabilities that met the criteria for a basic electronic health record system constituted only 29.7%. Jones and Furukawa state that by 2012, '90 per cent of health centres adopted an EHR [electronic health record] system and 49.5 per cent reported having capabilities that met the criteria for a basic EHR system' (Jones and Furukawa 2014, p. 1256). For health centres, these statistics have grown substantially in a couple of years. Additionally, 'hospital adoption of comprehensive EHR systems has increased eight-fold since 2009, rising to over a quarter (26%) of hospitals in 2013' (Charles, Gabriel and Furukawa, 2014).
Characteristics of both health centres and providers, in addition to the setting in which they deliver health care, have been shown to make a difference in the adoption of electronic health records. According to Pipersburgh (2011, p. 56), '[h]ospitals in large urban areas and teaching hospitals are more likely to have adopted EHR systems than hospitals located in rural areas.' Jha et al. (2009) earlier arrived at a similar finding. Hospitals in large urban areas and teaching hospitals have much larger and more diverse patient populations and staffs and more plentiful budgets than those at small rural community hospitals. Those in a rural twenty-five-bed hospital with a one- to two-manned health information management department may not have seen the need to convert to an electronic health record from paper records, compared to a 725-bed trauma centre in the largest city in the state with a health information management department that may employ twenty-plus staff members.
Similarly, provider's practice size is shown to play a role. For example, '[p]hysicians in smaller practices were less likely to have comprehensive or even basic EHR systems' (Pipersburgh 2011, p. 56). Two per cent of physician practices employing one to two physicians had a comprehensive electronic health record system with 5% having a basic system. Physician practices employing six to ten physicians had a comprehensive system with 26% having a basic system (Pipersburgh, 2011).
The community, as the larger entity that the health care provider serves, may itself show differences in adoption of the electronic health record in its area. In 2010, Jones and Furukawa (2014, p. 1257) found that 'health centers with the largest share of Hispanic and non-Hispanic black patients and centers located in rural areas had significantly lower adoption rates than centers with smaller caseloads of Hispanic and non-Hispanic black patients and centers in urban areas'. In 2012, more results were evident on electronic health record adoption rate differences, this time relating to income: '[h]ealth centers with the largest share of patients whose family incomes were below the federal poverty level had a lower rate of EHR adoption than centers with smaller percentages of lower-income patients' (Jones & Furukawa 2014, p. 1258).
Also, physicians in certain specialties have been more enthusiastic in getting on board to encourage electronic health record adoption and meaningful use. For instance, Lai and Kheterpal think that given the unique role of anaesthesiologists in hospitals, they could 'benefit from supporting hospitals in their adoption and meaningful use of certified EHR technology' (2011, p. 436). In contrast, Khakmahd (2012) points to challenges meaningful use of electronic health record technology has presented for nephrology. According to Khakmahd (2012),
In stage 2, the EP [eligible provider] has to use the CPOE [computerised provider order entry] to record more than 60% of medication orders, 30% of laboratory orders, and 30% of radiology orders to qualify for incentives. This measure has the potential to be particularly burdensome for nephrologists who care for dialysis patients in an outpatient dialysis unit, where hundreds of dialysis lab orders are placed each week. (p. 37)
In addition to the physician's specialty, his or her age may play a role in the adoption of electronic health records. Porter (2013) at Kaiser Permanente found that while 64% of those under the age of fifty were adopters, a lower percentage, 50% of those over the age of fifty, were adopters of electronic health records.
Methods
Based on the preceding literature review, we identified characteristics of providers as well as their setting that may relate to the adoption of the electronic health record. We started our analysis with the Centers for Medicare & Medicaid incentive programmes database, which is a file containing all of the payments made to providers from 2011 to 2014; that is, providers were paid for Stages 1 and Stage 2 meaningful use in four separate years. Adoption of the electronic health record is conceptualised as the year in which the eligible provider received payment for Stage 1 meaningful use, the first instance of payment. While we limited our analysis of the adoption of the electronic health record to providers who participated in the Centers for Medicare & Medicaid meaningful use programmes, we realise that there may be providers who did not participate in meaningful use, yet use the electronic health record in some capacity. We did not analyse hospital adoption of electronic health records in this study.
We labelled the providers based on the year in which they first received payment for meaningful use. For the years 2011 to 2014, we classified providers receiving a payment in 2011 as early adopters, those in 2012 as the early majority, those in 2013 as the late majority and those in 2014 as later adopters. The classification is based on Rogers's (2003) time of adoption. We excluded Rogers' first category innovators and changed Rogers's last category laggards to later adopters. Besides using Roger's adopter categories to label our adopters, we do not apply Rogers's theory in any substantive manner in this study. The focus is on visualising patterns in large sets of data as they relate to the time of adoption of providers who received Centers for Medicare & Medicaid incentive programme payments. Hence, the only application of Rogers's time of adoption in this study is to label the time of adoption of the providers who received payment from the Centers for Medicare & Medicaid in separate years from 2011 to 2014 for meaningful use of the electronic health record.
In the next step, to visualise patterns in large sets of data as they relate to provider's early adoption of the electronic health record, we created a database from existing data repositories of state level data. Our larger objective was to analyse the impact of provider characteristics and characteristics of the state in which the provider practices on his or her time of adoption of the electronic health record. The characteristics of the state are the setting in which the provider practices. Hence, we are interested in both the characteristics of the provider as an individual and those of his or her surrounding areas which we view as the state in which the provider practices.
The following are the data sources for both provider and state characteristics. We describe the form in which the data was merged to create our final database. The data also represent the latest publicly available data on provider and state characteristics; hence, the year in which the data was gathered may vary across the various characteristics. The first two are provider characteristics and the remainder are state characteristics.
- Provider age - Number from Healthgrades and Birthdatabase.com
- Provider specialty - Primary taxonomy from the National Provider Identifier Registry
- State median income - Median from the United States Census Bureau 2013 statistics (United States Census Bureau n.d.a)
- State median age - Median from the American FactFinder within the United States Census Bureau 2009-2013 American Community Survey five-year estimates
- State political affiliation - Red for republican and blue for democrat from the Politico Magazine 2014 Cook Partisan Voter Index by State (Red State, Blue State, Hot State, Cold State 2014)
- State chronic disease rate - Cancer and diabetes rates from the Centers for Disease Control and Prevention, Chronic Disease Prevention and Health Promotion Statistics and Tracking
We used interactive atlases. For cancer rates, we used the 2011 incidence rate, all cancer sites combined, all genders, all races, per 100,000. For diabetes rates, we used 2011 data for adults, age-adjusted, per 100.
Heart disease and stroke rates were from the Centers for Disease Control and Prevention, Interactive Atlas of Heart Disease and Stroke
For heart disease and stroke rates, we used 2011-2013 data by deaths, all ages, per 100,000. - State race/ethnicity percentage - percentage of minority (100 - % White) from the American FactFinder 2010 data within the United States Census Bureau
- State urban/rural percentage - percentage of urban mileage in a state from the Census Urban and Rural Classification and Urban Area Criteria 2010 data within the United States Census Bureau (United States Census Bureau n.d.b)
Then, we merged the Centers for Medicare & Medicaid's December 2014 database of 523,371 eligible providers in Excel with our database consisting of the characteristics for the fifty states within the United States. Approximately half of the providers, 245,031, had moved from Stage 1 meaningful use to Stage 2 meaningful use; hence, these providers were repeated in the database. We needed to retain only the year in which the provider received payment for Stage 1 meaningful use as this year, the first instance of payment received, best represents the time of adoption. Hence, we removed the duplicates, arriving at 278,340 unique eligible providers who received payments for Stage 1 meaningful use.
In the next step, we merged the database of eligible providers and their state characteristics with the National Provider Identifier database to extract specialty for each eligible provider within the database. Before merging, we checked all of the data from existing repositories for inconsistencies and found none, as the selected databases were from highly reliable sources such as the Centers for Medicare & Medicaid and the United States Census.
At this point, only the eligible provider's age was not part of the database. We did not find it feasible to merge our database with existing databases containing provider's age. As such, we drew a random sample from the 278,340 unique providers, which allowed a smaller number of providers, 384, for whom we could directly enter age from the databases mentioned earlier. Provider's age related analysis is the only analysis that is based on the sample consisting of 384 providers. All other analyses were conducted on the larger data set of 523,371 eligible providers of whom, after we removed duplicates, 278,340 were unique, eligible providers.
With the proliferation of data in health care, data analytics has become an important tool for finding patterns in voluminous amounts of data with an interest in finding solutions to clinical or administrative problems in health care. To illustrate visual analytics and to explore pertinent research questions, we chose to produce visual analytics in Tableau, a visualisation software, to find the impact of provider and state characteristics on provider's time of adoption of the electronic health record.
Research questions
To study how provider characteristics and state characteristics relate to provider's time of adoption of the electronic health record, we visualised patterns in large datasets from existing data repositories. The data sources are listed in the preceding section. Provider characteristics include provider's age and specialty. Characteristics of the state in which the provider practiced include chronic disease-rate for cancer, heart disease and diabetes, urban area percentage, median income, median age, minority percentage and political affiliation. Our objective was to visualise the patterns in these characteristics as they relate to provider's time of adoption of the electronic health record, as evidenced by the year in which the provider first received payment for participation in the Centers for Medicare & Medicaid Services incentive programmes. Adopters in each year spanning from 2011 to 2014 were labelled early, early majority, late majority and later.
Our exploratory research questions are as follows:
- How does provider age relate to provider's time of adoption of the electronic health record?
- How does provider specialty relate to provider's time of adoption of the electronic health record?
- How does state chronic disease rate for cancer, heart disease and diabetes relate to provider's time of adoption of the electronic health record?
- How does state urban area percentage relate to provider's time of adoption of the electronic health record?
- How do state demographics, age, income and minority percentage, relate to provider's time of adoption of the electronic health record?
- How does state political affiliation relate to provider's time of adoption of the electronic health record?
Results
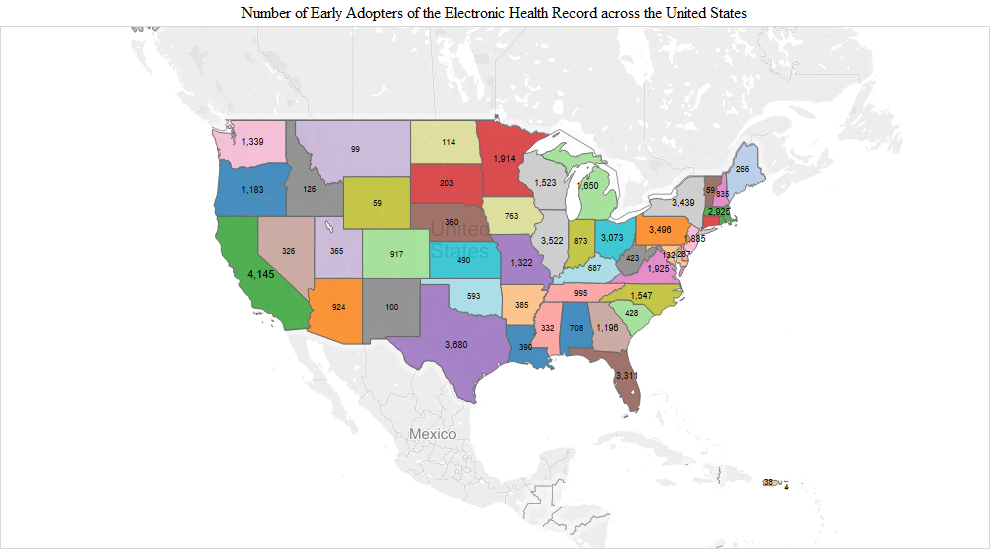
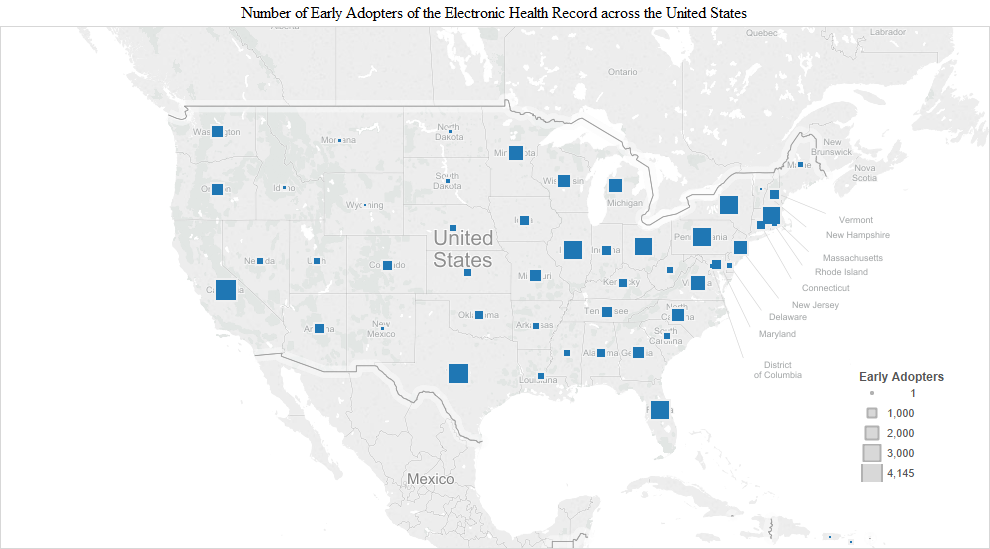
As one would expect, there were significantly more early adopters in populous states like California (4,145), Texas (3,680), New York (3,439) and Florida (3,311). Most early adopters were in California. Interestingly, however, there were slightly more early adopters in Pennsylvania (3,496) than in New York (3,439) (Figure 1). In addition to these states, a substantial number of early adopters also appeared in Illinois (3,522), Ohio (3,073), Massachusetts (2,925), Virginia (1,925), Minnesota (1,914), New Jersey (1,885), Michigan (1,650), North Carolina (1,547) and Wisconsin (1,523) (Figure 1).
|
|
|
|
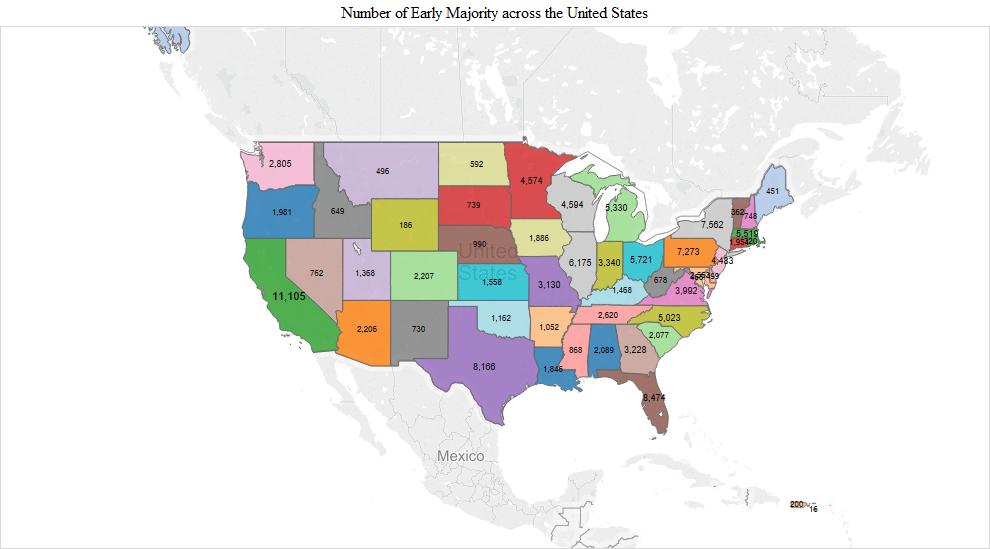
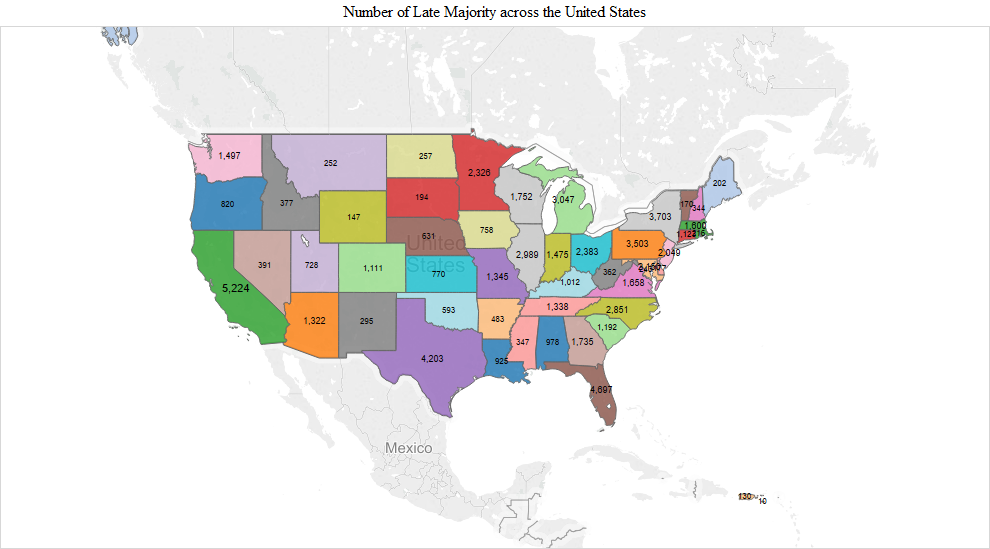
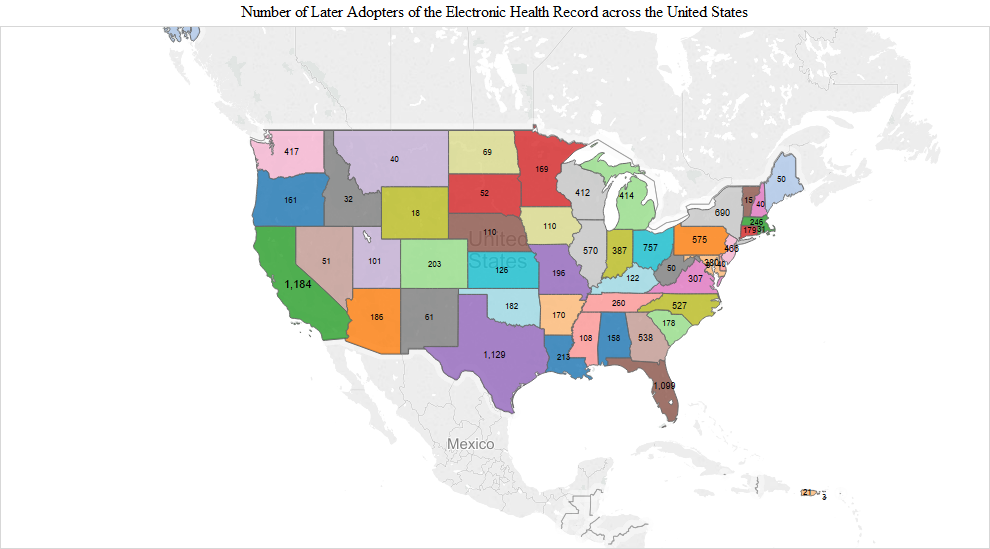
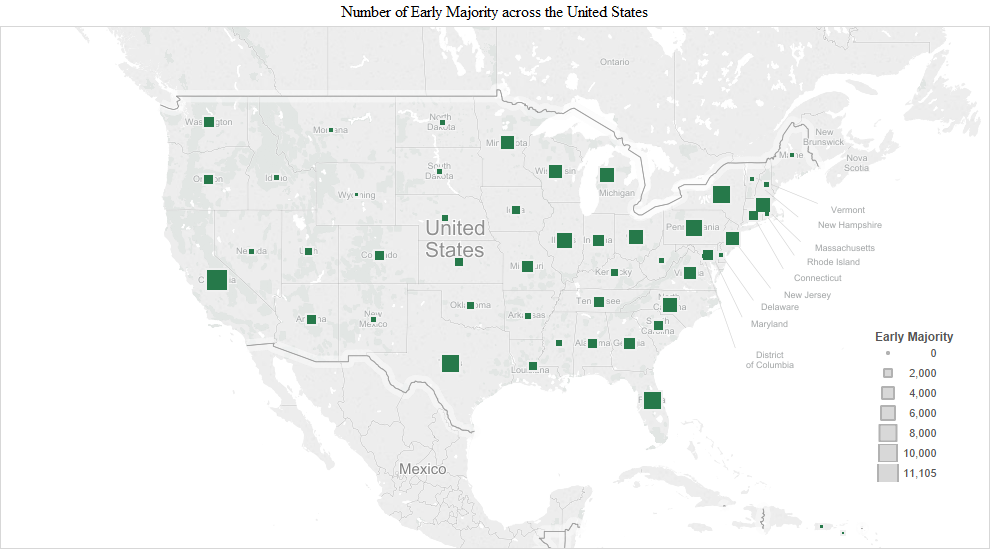
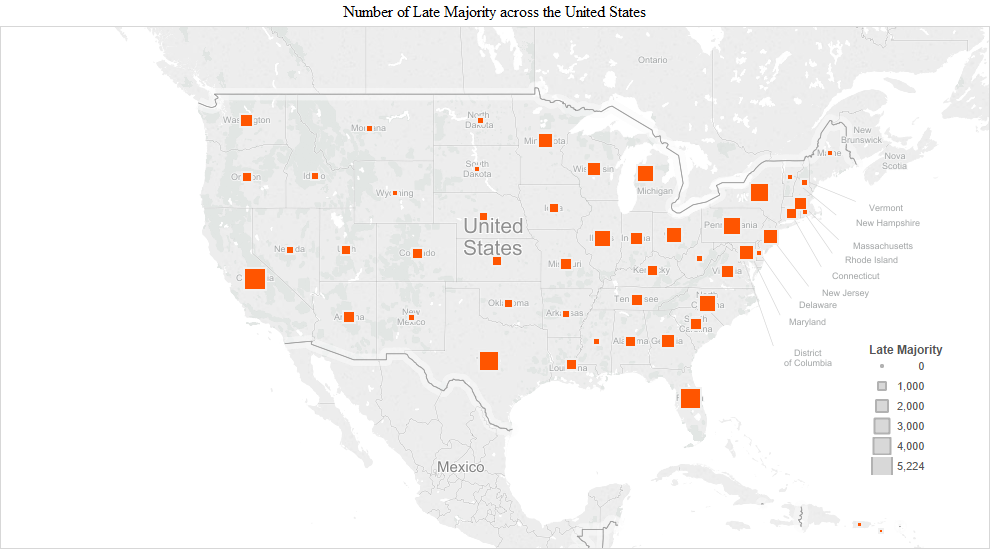
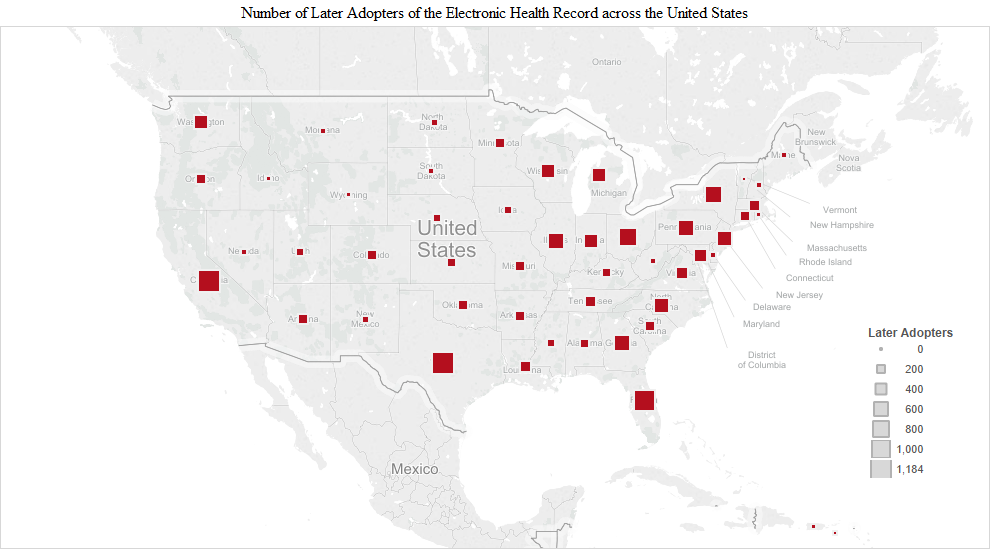
The pattern observed in the early adopter stage continued into the early and late majority stages. The numbers were the largest in the early majority stage and included additions like Indiana (3,340), Georgia (3,228), Missouri (3,130) and Maryland/DC (Maryland 2,563 + DC 455 = 3,018). California had the highest number of the early majority (11,105). In the late majority stage, adopters in Washington (1,497), Tennessee (1,338), Arizona (1,322), South Carolina (1,192), Colorado (1,111) and Kentucky (1,012) joined in larger numbers compared to the remaining states. In the later adopter stage, there was a higher proportion of later adopters in many of the remaining states, including Utah (203), Louisiana (213), Oklahoma (182), Connecticut (179), Arkansas (170), Oregon (161), Alabama (158), Kansas (126), Nebraska (110), Iowa (110) and Mississippi (108) (Figure 1).
We present another way of visualizing the adopters by time of adoption across the United States in the following charts. The size of the squares represents the number of adopters in each of the adoption stages: early adopters, early majority, late majority and later adopters.
|
|
|
|
Provider age and time of adoption of the electronic health record
The visualisation of provider age by time of adoption of the electronic health record revealed the following. Providers in their forties were the most active in all phases of adoption, followed by those in their fifties (Figure 3).
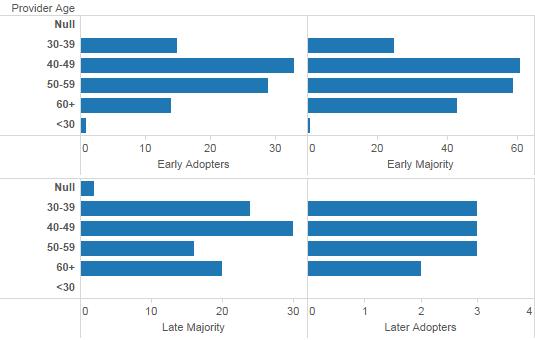
Figure 3: Provider age by time of adoption of the electronic health record.
Those in their sixties were more active in later stages of adoption. Interestingly, this was also the case with providers in their thirties.
Provider specialty and time of adoption of the electronic health record
|
|
|
|
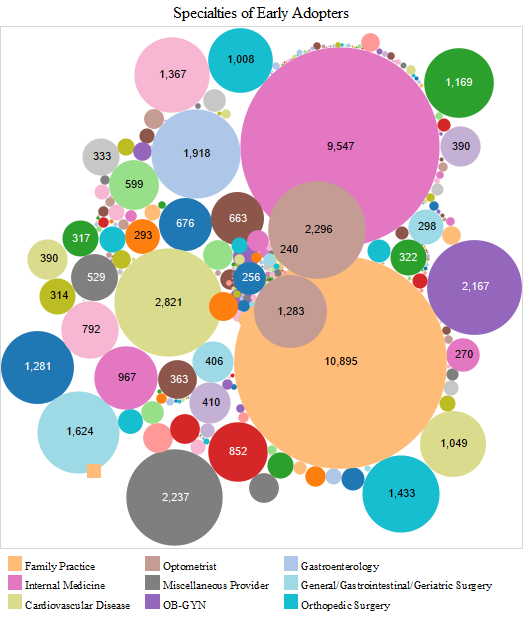
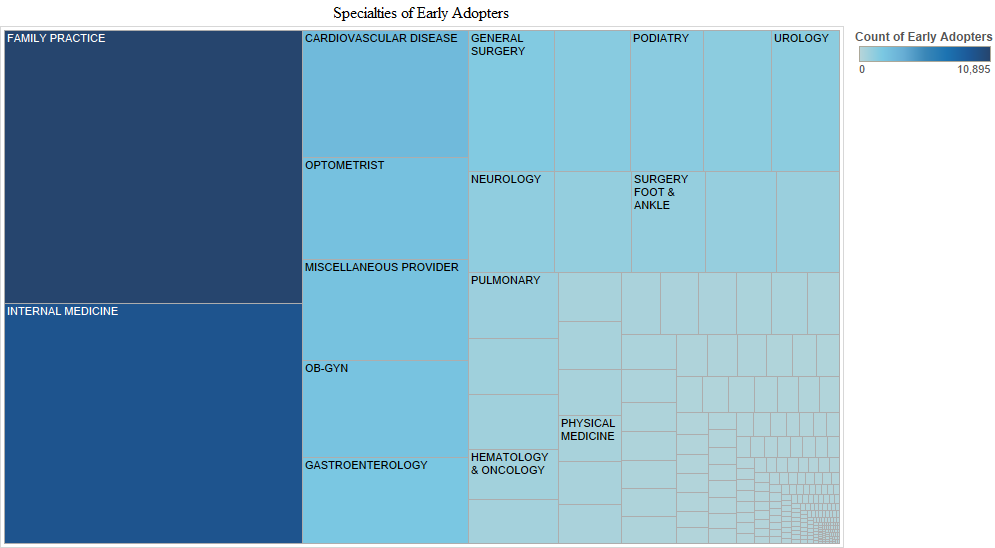
When provider specialties were examined, we found that family medicine physicians and internists were the most active in all stages of the electronic health record adoption. Cardiologists, optometrists, ob-gyns, gastroenterologists, general surgeons and orthopaedic surgeons were the next most active in the early adopter stage (Figure 4). These visualisations for provider specialties are based on two databases that were merged: a) the database we created with the full data set (278,340 cases after removing duplicates from the original 523,371 cases), which included the Centers for Medicare & Medicaid Services payment to providers and b) the National Provider Identifier database which includes provider specialty.
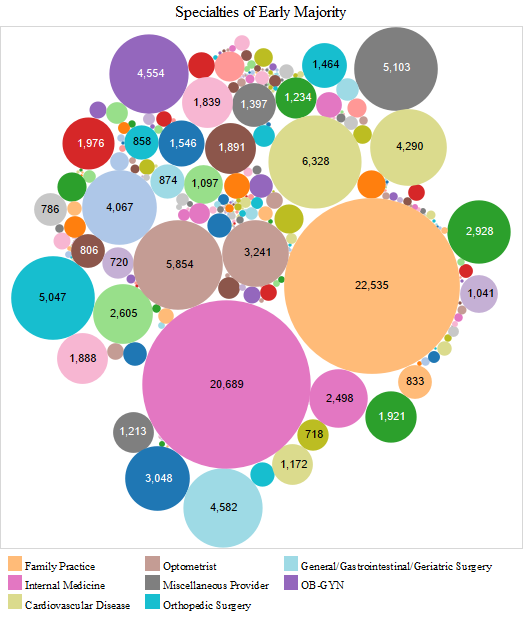
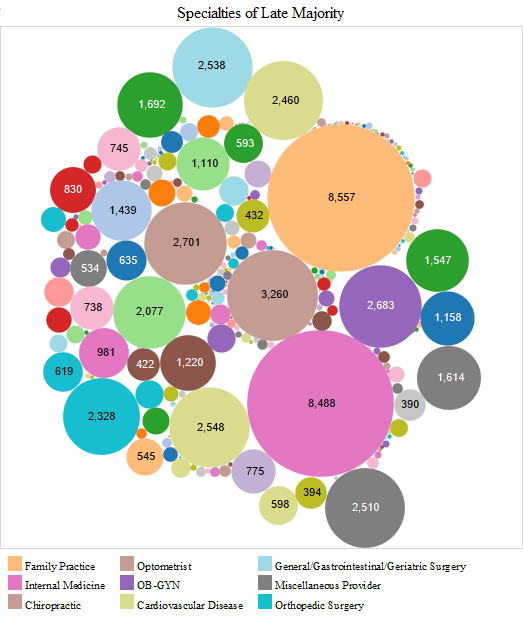
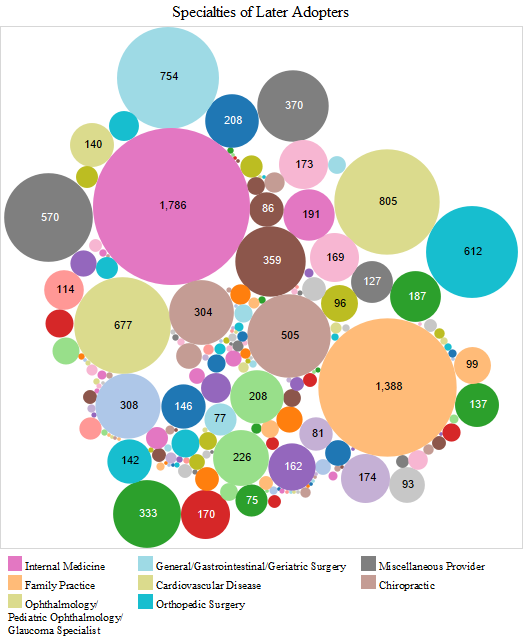
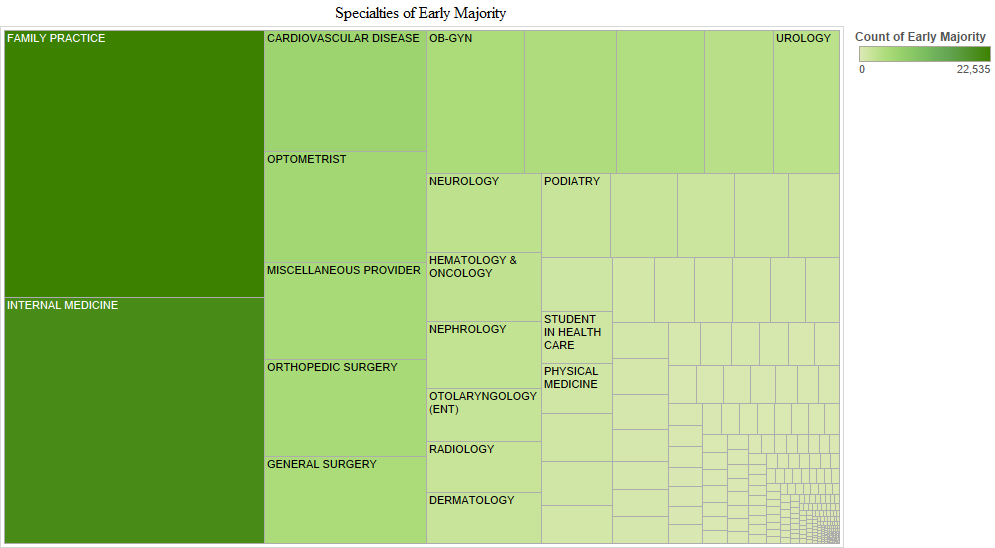
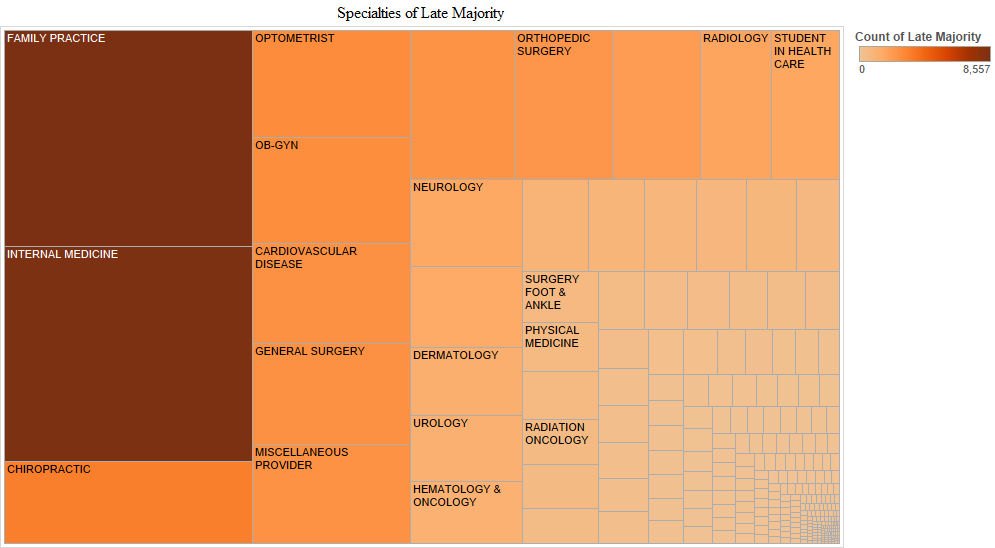
In the early majority stage, family medicine doctors and internists were followed by cardiologists, optometrists, orthopaedic surgeons, general surgeons and ob-gyns. Hence, the pattern was mostly similar to that in the early adopter stage. In the late majority stage, family medicine doctors and internists were followed by chiropractors, optometrists, ob-gyns, cardiologists, general surgeons and orthopaedic surgeons. In the later adopter stage, internists and family medicine doctors were followed by ophthalmologists, general surgeons, cardiologists, orthopaedic surgeons and chiropractors, which is mostly similar to adopters in the late majority stage (Figure 4).
|
|
|
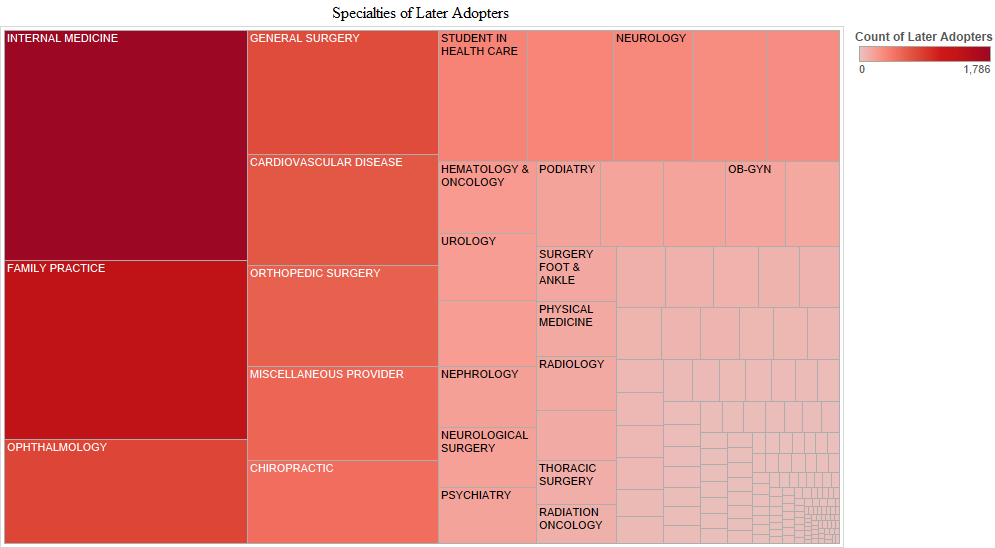
|
We provide another way to visualise time of the electronic health record adoption by provider specialty in the charts above. In these charts, Tableau labels additional specialties as noteworthy in each adopter stage (Figure 5). Other specialities that are noticeable are neurologists, pulmonologists, oncologists, podiatrists, urologists and physiatrists in the early adopter stage. Additional newly active specialties in the early majority stage included nephrologists, otolaryngologists, radiologists and dermatologists. No newly active specialities were noticeable in the late majority stage. In the later adopter stage, however, neurological surgeons, psychiatrists and thoracic surgeons appeared. Another observation is that in the later adopter stage, ob-gyns who had been active since the early adoption stage had decreased in numbers.
State chronic disease rate and provider time of adoption of the electronic health record
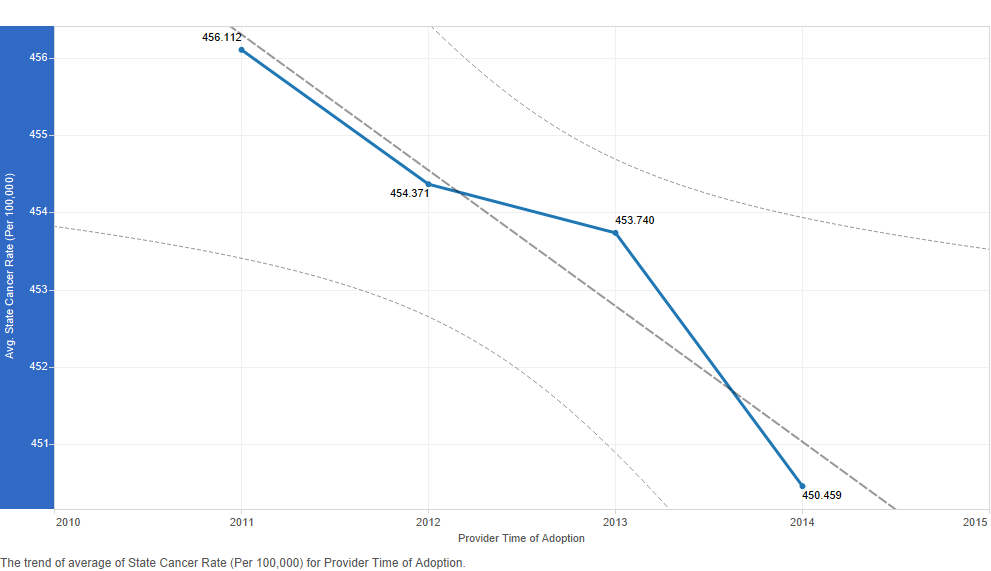
|
|
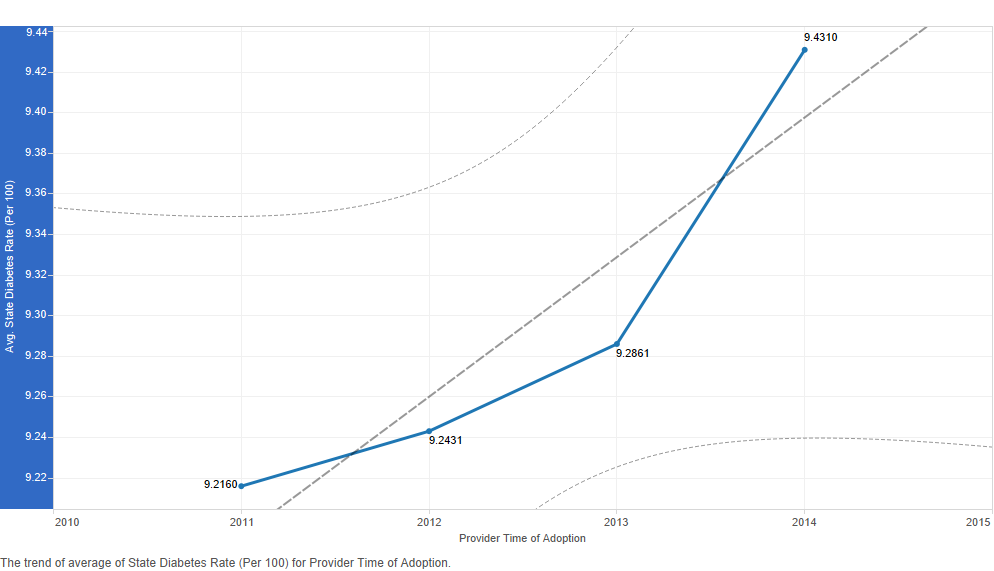
We chose to examine cancer and diabetes incidence rates and heart disease and stroke death rates at the state level in trend lines to find possible associations with provider's time of adoption of the electronic health record (Figures 6-7). Other trend lines follow in Figures 8-10. We produced these trend lines with the full data set (278,340 cases after removing duplicates from the original 523,371 cases). The data points in these trend lines represent averages calculated over a very large data set; hence, differences between data points may not be obvious. Nevertheless, trends are visible. We do not derive the visualisations based on inferential statistics; however, these trend lines which are descriptive are suitable for an exploratory analysis such as ours.
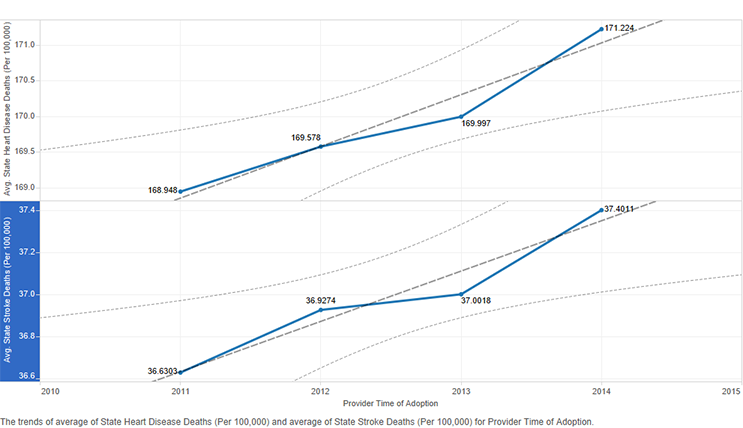
Figure 7: State heart disease and stroke death rates by provider time of adoption of the electronic health record
Early adopters and the early majority were in states with higher cancer rates (Figure 6). The same was not true of diabetes rates. The trend line was in the opposite direction. Early adopters were in states with lower diabetes rates, and later adopters were in states with higher diabetes rates (Figure 6). The trend lines for heart disease and stroke death rates had a pattern similar to that for diabetes rates (Figure 7). Early adopters were in states with lower heart disease and stroke death rates.
State urban area and provider time of adoption of the electronic health record
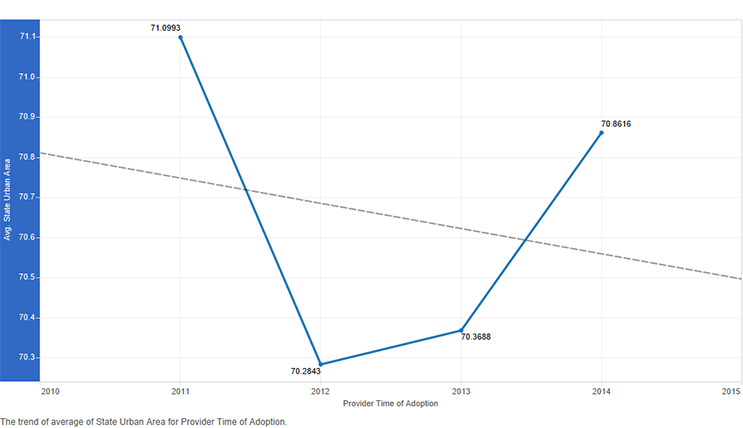
Figure 8: State urban area by time of adoption of the electronic health record
There was an interesting trend in time of adoption of the electronic health record by urban area within a state. Early adopters were in states with larger urban areas. The trend moves downward for the early majority, then it moves upward again. The late majority adopters were in states with larger urban areas compared to the early majority. The trend moves further upward for the later adopters (Figure 8).
State demographics and provider time of adoption of the electronic health record
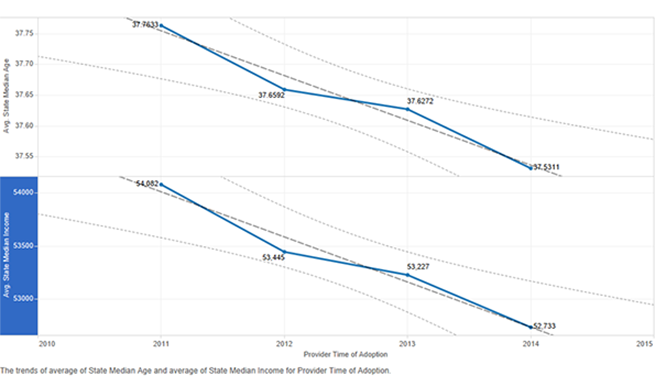
Figure 9: State median income and age by time of adoption of the electronic health record
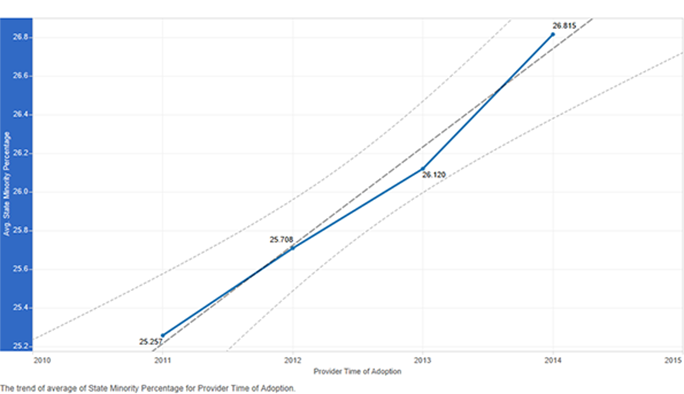
Figure 10: State minority percentage by time of adoption of the electronic health record
The trend line for adopters by time of adoption of the electronic health record in states based on median age shows there were more early adopters in states with higher median age, which is desired (Figure 9). However, the same was true of adopters in states with higher median income, which is not ideal. There were more early adopters in states with higher median income, and the trend moves downwards with later adopters in states with lower median income (Figure 9). There is an interesting trend in states with higher minority population as well (Figure 10). Rather than more early adopters, the later adopters were in these states. This trend line shows a lower minority percentage in states where providers were early and higher minority percentage in states where providers were late in adoption of the electronic health record.
State political affiliation and provider time of adoption of the electronic health record
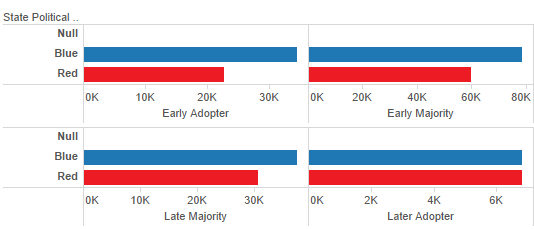
Figure 11: State political affiliation by time of adoption of the electronic health record
When state political affiliation was examined, we found that there were more early adopters of the electronic health record in blue (that is, democratic) states than in red (that is, republican) states (Figure 11). The same pattern continues into the early majority and late majority stages of provider adoption of the electronic health record (Figure 11). The difference is the greatest at the early adopter stage. One example of this pattern is California which had the highest number of early adopters (11,105) (Figure 1). However, by the later adopter stage, there were similar numbers of adopters in red and blue states.
Limitations
We consider our study innovative in employing visual analytics to find and represent patterns in the large data set of 278,340 cases, which is the full data set of 523,371 eligible providers after removing duplicates of providers who moved from Stage 1 to Stage 2 meaningful use. All of the other analyses, except one, are based on this large data set. The only analysis we could not run on the full data set is time of adoption of the electronic health record by provider age. We were unable to download databases that include provider's age to merge with our database; hence, we analysed provider age and participation in the Centers for Medicare & Medicaid incentive programme using a sample (384 cases) drawn from the full data set (278,340 cases after removing duplicates from the original 523,371 cases).
We produced visualisations of a large data set to offer insights to health care administrators and health care policy makers. We do not apply associations rooted in theoretical models to the visualisations we produce. Also, the visualisations, although analytical, are mostly descriptive (Keim 2008). Tableau, the software that we use to illustrate the visualisations, allows only analytics that are descriptive. The emphasis in Tableau is more on the presentation of data. Future research can use robust statistical software to produce visualisations derived from inferential statistics.
We would have preferred to visualise the impact of provider practice size on participation in the Centers for Medicare & Medicaid incentive programme. The importance of provider practice size has been pointed out in the literature (Pipersburgh, 2011); however, our research design and the additional resources required for a survey made this option unlikely at this time. We also did not analyse the Centers for Medicare & Medicaid provider payments because these payments are based on provider responses to the meaningful use core and menu measures, which are presented in separate Centers for Medicare & Medicaid public use files. The latter Centers for Medicare & Medicaid public use files do not identify providers by National Provider Identifier, which makes it impossible to link these files with the provider payment file for payment-related analyses.
Discussion
Our map analysis of provider electronic health record adoption at different points in time, based on Centers for Medicare & Medicaid incentive programme payments, offers insights in geographic patterns. Providers in more populated states with larger cities tended to be early adopters. Thus, we were not surprised to see that California had the largest number of early adopters in the country. California is also a blue state, and we found that providers in blue states were earlier in adoption of the electronic health record. There were, of course, red states that had providers who were early in adoption of the electronic health record, for example, Florida and Georgia. A data brief published by the Office of the National Coordinator for Health Information Technology found that hospital electronic health record adoption rates also varied significantly by state (Charles, Gabriel and Furukawa, 2014). These authors found that 'most of the states with adoption rates significantly higher than the national average were located in the Midwest' (Charles, Gabriel and Furukawa 2014, p. 3). Our analysis focuses on provider adoption of the electronic health record rather than on hospital adoption. Also, the Office of the National Coordinator for Health Information Technology's finding is based on data collected in 2013. Hence, their result is similar to our finding of the pattern among providers at one point in time; that is, the late majority stage. By this time in 2013, providers in Midwestern states had indeed gained momentum.
We had expected providers in their forties and fifties to be active, and our findings show that this age group was in the forefront of participation in the Centers for Medicare & Medicaid incentive programme. We find it interesting that those in their thirties were similar to providers in their sixties in innovative behaviour; however, we are cognisant of the fact that our sample had far fewer providers in their thirties (n = 67) and sixties (n = 79).
Internists and family medicine doctors were highly active in their participation in the Centers for Medicare & Medicaid incentive programme at all four stages: early adopter, early majority, late majority and later adopter stages. Several different specialties followed; however, it is clear that primary care providers are more active in adopting health care information technology. We found scant literature on the importance of provider specialty in electronic health record adoption. Lai and Kheterpal (2011) discuss the suitability of the electronic health record technology in anaesthesiology. In contrast, Khakmahd (2012) discusses how ill-suited and difficult it is to integrate the electronic health record in nephrologists' complex workflow. Regardless of these viewpoints, in today's setting, health care information technology applications are suitable for all specialties when integrated with careful attention to workflow.
We found earlier adopters in states with higher cancer rates, but not in states with higher diabetes rates. The same trend was true of states with higher heart disease and stroke death rates. The later adopters were in these states. These trends, when combined with the findings that later adopters were in states with higher minority percentage and lower median income, are noteworthy. Again, we realise that our analysis is exploratory and descriptive; that is, it is not inferential. Hence, we cannot confirm these associations. Jones and Furukawa (2014) state that areas with lower incomes and higher presence of Hispanic and non-Hispanic blacks lagged behind in adoption of electronic health record. Our findings are in agreement with the preceding.
Urban areas also tend to have higher minority populations. We found that the early adopters were indeed in states with the highest urban mileage. It is already widely reported in the literature that larger hospitals in urban areas are far ahead in innovative behaviour. However, we found that the later adopters were also in states that are high in urban mileage. That is, the early majority were in lower urban mileage states, and the late majority were in slightly higher urban mileage states compared to the early majority. However, the trend moves upward in urban mileage for later adopters of the electronic health record. Our map analysis also shows the presence of later adopters in states with large urban areas. These states had been active since the early adopter stage; however, they continued adoption of the health record into the later stages as well.
Our thinking behind analysing state demographics, especially state median age, was whether providers were earlier in adoption of the electronic health record in states such as Florida where the median age is significantly higher compared to that in other states. We indeed found that more early adopters were in states with higher median age (Figure 9). The presence of early adopters in these states where the median age is higher is desired as older populations seek health care relatively more often and can benefit from the use of electronic health records.
Conclusions
One of our goals in this research is to illustrate the use of Tableau for the visualisation of large sets of data pertaining to research problems in order to draw conclusions. Researchers in other disciplines can begin with input data sources pertaining to their research problems. Then, various computational techniques--such as linking records across sources, natural language processing and matching of other patterns--can be used to extract data elements from disparate sources. We chose to link data elements across databases with a common key. To draw conclusions, machine learning where relevant and related statistical techniques constitute statistical processing. In this research, we chose to use Tableau to produce visualisations based on descriptive statistics; however, future researchers can employ statistical software, write programming code and apply probabilistic measures. Tableau offers the advantage of developing visualisations without the requisite investment in writing programming code.
Our findings, although preliminary, have implications for the integration of health information technology broadly. Future researchers can probe further the determinants of health care information technology adoption. Our findings do inform health care administrators and policy makers to a certain extent. In areas that tend to lag behind in health information technology adoption--for example, states that showed lower early adoption--we believe that outreach and support efforts are critical. Staff development can assist older providers in introducing and integrating health information technology. Internists and family medicine physicians appear to be more interested in electronic health record adoption, but to see benefits of health information technology accrue in specialised medicine, there must be greater effort in analysing workflow and fitting heath information technology with the right support for the practice. However, we recognise the possibility that fewer providers in specialised medicine exist, which may inaccurately portray them as lagging behind internists and family medicine physicians. We also reiterate that our analysis does not include hospital adoption of the electronic health record.
We were surprised to see that providers in states with a higher percentage of urban areas were later adopters. Also, later adopters were in states with higher minority percentages, higher diabetes rates, higher heart disease rates, higher stroke rates and lower income. In urban areas, higher concentrations of minority populations, who may be associated with higher chronic disease rates and lower income, need the health information technology to experience improvements in health care. Greater outreach to practices and providers in these areas is warranted. Heisey-Grove et al. (2014), based on nationwide data gathered from Regional Extension Centers, found provider engagement and administrative issues to be more common in the adoption of electronic health records and meaningful use. Providers feared that meaningful use diverted their attention from patient care by imposing greater reporting requirements (Weeks et al. 2015).
State regional extension centres apparently have an important role to play in addressing regional inequities in health care. One such centre is the Regional Extension Center in Kentucky, which states that it offers 'comprehensive, individualised support that helps clinicians and hospitals in translating complex issues into practical health IT solutions'. Also, 'Kentucky REC [Regional Extension Center] connects clients to the local and federal resources needed to succeed in the changing health care landscape'. A greater attention to the timing of these outreach efforts can produce more effective results.
Acknowledgements
The authors wish to thank Charlie Bowen, Senior Systems Analyst, in the College of Informatics, Northern Kentucky University, for setting up a Windows virtual machine with additional allocated memory to run our data analytics.
About the authors
Kalyani Ankem is an Assistant Professor in the Business and Health Informatics Department, College of Informatics, Northern Kentucky University, 100 Louie B Nunn Dr, Highland Heights, KY 41076, USA. She can be contacted at: ankemk1@nku.edu.
Joshua Turpin is a Data Integrity Specialist in the Health Information Management Department, Cincinnati Children's Hospital Medical Center, 3333 Burnet Ave, Cincinnati, OH 45229, USA. He received his Master of Health Informatics from Northern Kentucky University, USA.
Vishal Uppala is a doctoral student in the Information Systems and Supply Chain Management Department, Bryan School of Business and Economics, University of North Carolina at Greensboro, 1400 Spring Garden St, Greensboro, NC 27412, USA. He can be contacted at: v_uppala@uncg.edu.