Exploring the influences on pragmatic and hedonic aspects of user experience
Tanja Merčun and Maja Žumer
Introduction. Over the last years, we have seen a growing interest in understanding user experience. There are, however, many factors that shape the user experience and studies are only starting to discover the interrelationships between different dimensions and factors. This paper aims to add to this body of knowledge by examining influences on pragmatic and hedonic aspect of user experience.
Method. The paper builds on the data collected in a user study of five bibliographic information systems that applied performance as well as user experience measures.
Analysis. The analysis focuses on the results collected using the reaction cards method. The cards are grouped by pragmatic/hedonic and positive/negative aspects and the results of individual category analysed in the context of other study variables.
Results. The results show that participants selected more cards representing pragmatic than hedonic aspect. Time-on-task and perceived task difficulty represented the strongest factors that influenced on the choice, while the influence of task success and exposure was smaller. The changes in success or perceived difficulty had more effect on the pragmatic than hedonic attributes.
Conclusions. Despite some limitations, the study presents a starting point for analysis of user experience through reaction cards and points to future research questions.
Introduction
Over the last decade, the concept of user experience (or so called UX) has slowly made its way into human-computer interaction research (Hassenzahl and Tractinsky, 2006). Interestingly enough, however, despite its adoption by practitioners and lately also by researchers, the concept still seems to lack not only a commonly accepted definition, but also quality research and in-depth understanding of its dynamics (Hassenzahl, Wiklund-Engblom, Bengs, Hägglund and Diefenbach, 2015). Focusing on the latter, this paper aims to contribute to the understanding of factors that influence on how users perceive and experience their interaction with bibliographic information systems in particular. It does so by analysing the results gathered in our user testing of a bibliographic prototype system where reaction cards were used to elicit users’ impressions of their interactions. By addressing user experience in the context of bibliographic information systems, the results, discussions and the underlying ideas also add to the field of library and information science, where user experience presents a novel research area. Furthermore, traversing between the fields of human-computer interaction, user experience, and library and information science, the paper aims to demonstrate a broader evaluation of user experience within information systems than is typically the case.
The paper first briefly addresses previous research that investigated the interplay of different factors on positive and negative user experiences and introduces our study design, analysis approach, and the reaction cards method. Next the results are presented and discussed, followed by concluding remarks that offer a reflection on the study and possible future explorations.
Theoretical background
Representing a more holistic understanding of user’s interactions with a product or a system (Lallemand, Gronier and Koenig, 2015), there seems to be a general agreement among researchers that user experience is shaped by a combination of pragmatic (“instrumental”) and hedonic (“non-instrumental”) qualities of a system (Hassenzahl and Tractinsky, 2006; Brandenburg, Vogel, and Drewitz, 2013; Mahlke and Thüring, 2007). While the pragmatic qualities refer to the perceived usefulness, efficiency, and ease of use (so called utility and usability aspects), the hedonic qualities take into account the “joy of use” and emphasize stimulation, identification and evocation generated by the use of a system or a product. It is the combination of pragmatic and hedonic qualities that leads to positive or negative emotions and consequently guides the acceptance of the product. In his seminal work, Hassenzahl (2005) argued that while the pragmatic product attributes should not be neglected as they help users achieve hedonic goals, it is the hedonic attributes that are the main contributor to product’s acceptance. This was confirmed in an experiment by Minge (2008), who wrote that their results supported the findings of “overshadowing effects of hedonic aspects, i.e. attractiveness, over pragmatic aspects, i.e. usability”.
Product features present an important factor in the formation of user experience, but there seems to be also a variety of other influences that range from individual characteristics of the user, the context of use and use over time to the interrelationship between user experience dimensions - all of which have yet to be explored in more detail (Bargas-Avila and Hornbæk, 2011). Karapanos (2013), for example, suggests that user experience develops and changes over time: while learnability, novelty, and beauty may be crucial initially, they do not necessarily motivate prolonged use as strongly as some other aspects. A similar conclusion has been made by Minge (2008), who noted that the overshadowing effect of hedonic aspects decreases over time, leading users to value usability independently after a while, especially with low attractiveness systems. On the other hand, Van der Heijden (2004) observed that factors most affecting the user experience differ based on the purpose of the system and suggests that the perceived usefulness loses its power in hedonic systems where it is the perceived enjoyment that becomes predictive of users’ acceptance. This indicates that emotion, aesthetics, and identification with a product may be the key components forming positive or negative user experience in some cases, while products that are more utilitarian in nature might be more dependent on the quality of interaction, perceived usefulness, and engagement. Understanding the influence of different factors within a particular context of use is therefore important for developing products and systems that will create positive user experience and consequently foster adoption.
Methodology
Within a larger usability study that tested a prototype system for display and exploration of bibliographic data, a combination of user performance and experience measures was applied to analyse and compare different user interface designs. While not part of our original research questions, the data collected opened up an interesting area of exploration into user experience. This analysis aims to identify the factors that influenced on the hedonic and pragmatic aspects of user experience and contributed to the overall positive or negative experience. The four aspects of user experience were extracted from the selections of reaction cards, while the potential factors of influence came from the results of usability testing as well as the characteristics of participants and the study design itself.
Reaction cards method
With a limited selection of methods available for evaluating user experience (Michailidou, von Saucken, Kremer and Lindemann, 2014), the reaction cards method holds an interesting potential for tapping into user experience. First described by Microsoft researchers (Benedek and Miner, 2002), the method was primarily intended for eliciting user comments. In its original design, it included 118 reaction cards with 60% positive and 40% negative words (e.g. “fun”, “easy to use”, “frustrating”,…) that were presented to the user after interacting with a system. The user would be asked to select any number of cards that best described his or her experience and then choose a few of them to explain in more detail. From its creation, the method has been used in several studies, but it has been often adapted either by changing the number of cards, the selection of words or the manner of application (examples in Doyle, Quigley, Nixon and Caulfield, 2010; De Guzman and Schiller, 2011; Hastings, Mirasano, Latchininsky and Schell, 2010).
Tailoring the method to the needs of our study, users could select among 29 reaction cards (15 positive and 14 negative) after completing the 10 tasks in each prototype design. To analyse the interrelationships between different variables and user experience captured through reaction cards, the cards were grouped in two ways: all the cards were divided by their positive and negative connotation as well as by their by their pragmatic and hedonic quality (Table 1).
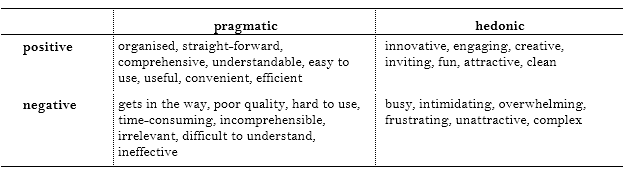
Table 1: Categorisation of reaction cards based on positive/negative, pragmatic/hedonic aspects.
Bibliographic information systems
5 prototype designs were included in the study, 1 represented a typical library catalogue with faceted navigation (Figure 1) while the other 4 designs (Figure 2) included different hierarchical visualizations that could be used for overview and navigation of the bibliographic family.
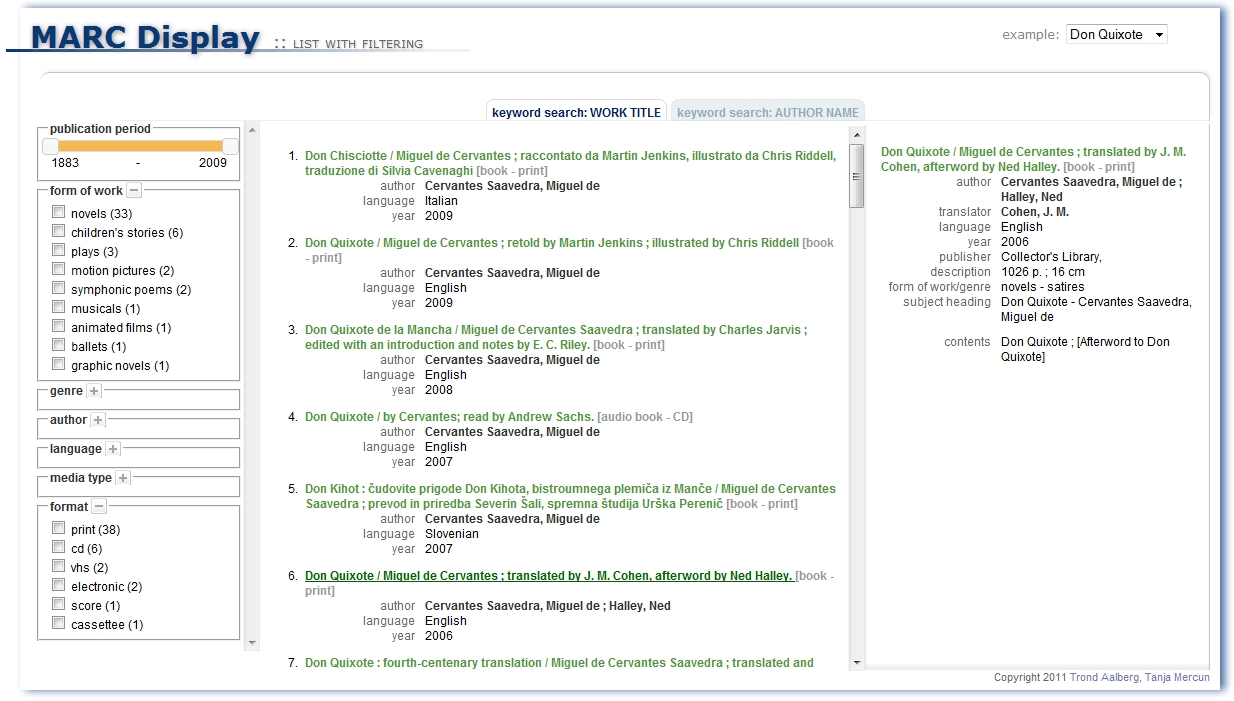
Figure 1: One of the 5 tested designs: a typical library catalogue with faceted navigation
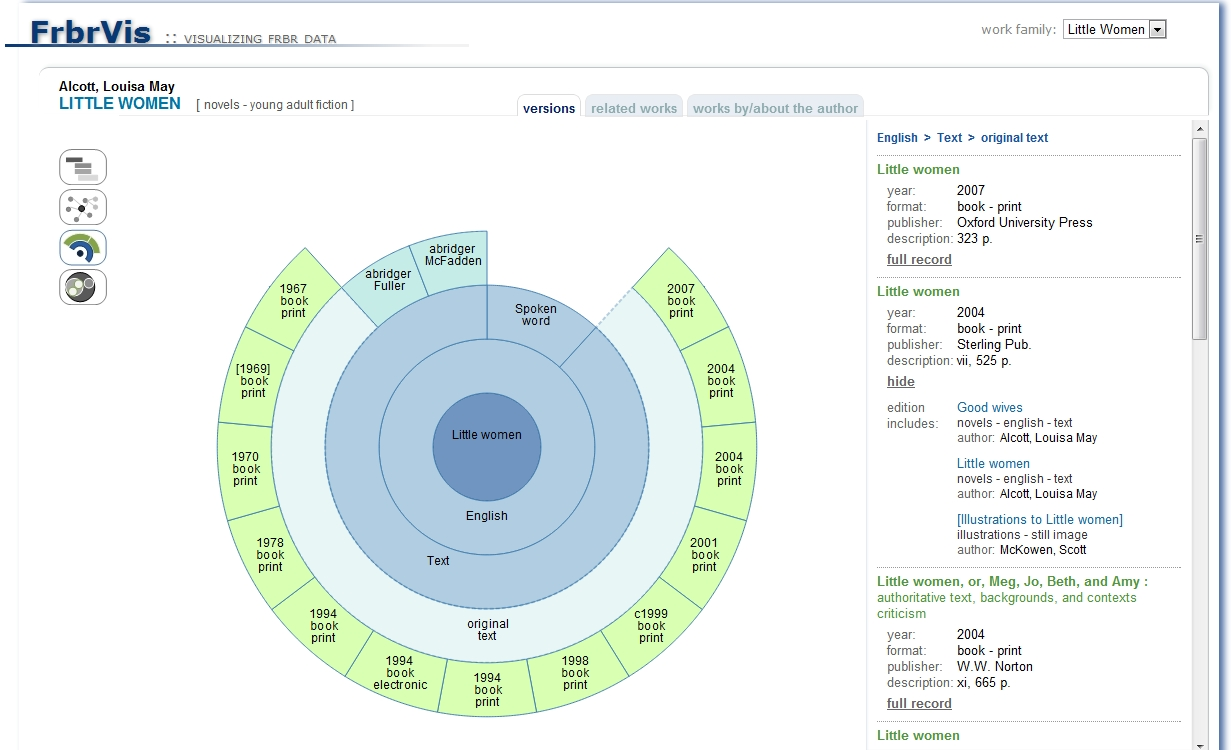
Figure 2: One of the 4 prototype designs with a visual navigation feature
Study design
The experiment was carried out between December 2011 and January 2012 and included 120 students from several faculties at the university. The representation by gender (33% males, 67% females) as well by fields of study (65% social science, humanities and education; 35% science and engineering) corresponded to the general proportions in the student population.
Each of the 120 participants worked with 3 of the 5 bibliographic systems tested in the study. After completing 10 tasks in each system and rating the difficulty of every task, a participant was asked to select any number of the presented 29 reaction cards that best described his or her experience and the perception of the prototype. Once finished with the three prototypes, each participant would also rank the tested systems from most to least favourite. All the prototype designs and tasks were counterbalanced and all the sessions were recorded using Morae software for further analysis by the researcher who coded the data and assigned several performance scores.
Analysis
The results in this paper were based on a total of 360 sessions and do not distinguish between system designs tested in the study, but rather focus on the exploration of interrelationships between user experience represented in reaction card results and other variables in the study:
- performance scores: time-on-task, task completion
- self-reported scores: task difficulty, system preference
- individual’s attributes: field of study, gender
- exposure: position of the prototype in the testing sequence (1st, 2nd, or 3rd)
To enable a more focused analysis and presentation of results, some data (task-on-time, task completion, and task difficulty) have been categorized into quartiles. The percentages reported and used in the analysis represent the mean proportion of selected cards against all possible selections within that particular category. For example, in Table 3 the first reported number 47% tells that participants with lowest time-on-task (Q1) on average selected 47% of all the possible reaction cards describing the positive pragmatic aspect, while participants with the highest time-on-task (Q4) scores selected only 28% of the available cards in that category.
Using individual differences, exposure, performance, and self-reported scores as independent variables, we were interested whether there was a difference in the selection of pragmatic and hedonic attributes of user experience among different groups within each variable. Significant differences were identified using one-way ANOVA and independent t-test, accompanied with effect sizes.
Results
Grouping reaction cards by positive/negative and pragmatic/hedonic aspects, the results (Table 2) show that overall, participants in the study selected a very high proportion of positive cards (85%) as well as more pragmatic (61%) over hedonic attributes (39%). Interestingly, when selecting negative attributes, participants chose hedonic (45%) over pragmatic (55%) aspects more often than within positive attributes, where the share of hedonic attributes was 38%. The last row in Table 2 further compares the number of selected cards within an individual category to the possible number of all selections. Here we can observe that in total, participants selected about 18% of all possible hedonic attributes and 23% of all possible pragmatic attributes. Within the negative reaction cards group, this selection even turned over in favour of the hedonic aspect as we can see that 7% of possible hedonic and 6 % of all possible cards were chosen.
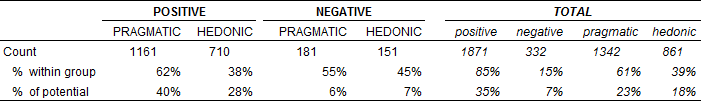
Table 2: The selection of reaction cards
To analyse the potential factors of influence on positive and negative as well as pragmatic and hedonic aspects, the results of reaction cards were segmented by variable values and tested for potential differences based on segment values within a category. Examining the data in Table 3, we can quickly see that in our study, gender and study area did not have an effect on the selection of reaction cards. Most differences can, in fact, be found within the self-reported and performance measures, but it is interesting to see that also the exposure to prototypes had a small influence on the selection of cards within individual categories. Participants, for example, generally selected a smaller proportion of available positive cards and a larger proportion of negative cards for their third prototype in comparison to their first prototype (Figure 3). This might confirm some of the assumptions made in literature that user experience changes with the use of the system. This effect also seems to be slightly more pronounced for pragmatic than hedonic aspects.
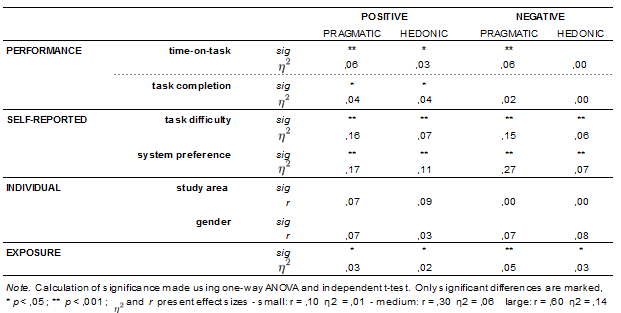
Table 3: Selection analysis based on variable results and pragmatic/hedonic categorisation
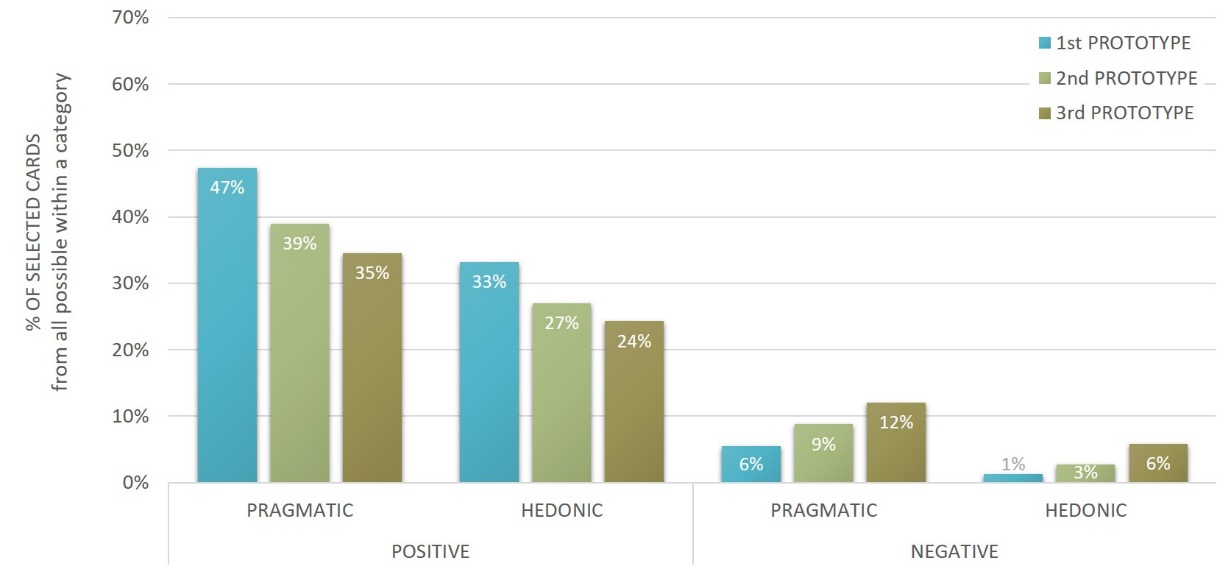
Figure 3: Selection of cards in relation to the prototype exposure (1st, 2nd, or 3rd system in the sequence)
The average time (Figure 4) needed to complete the task was most reflected in the pragmatic reaction cards where we can see that participants who needed more time to complete the task, selected significantly less pragmatic positive cards and significantly more pragmatic negative cards. While some differences appeared also within the hedonic category, they were less distinct and were limited to the positive aspect. Also success in task completion (Figure 5) seems to be somewhat associated with the user experience as participants that were most successful selected as many as 51% of all possible pragmatic positive cards and 36% of all hedonic reaction cards, while the least successful participants selected only 33% and 19%, respectively.
The assessment of task difficulty as well as the system preference are both in fact self-reported measures as are the reaction cards we are comparing them to. However, each of them was taken at a different point in the test: tasks difficulty during the test, reaction cards after the completion of tasks within one prototype, and system preference at the end of all three tests. Despite that, it is possible to observe that the perception of difficulty (Figure 6) and user’s personal preference for one system over another (Figure 7) are clearly reflected in the selection of reaction cards. Also here, however, the effect of differences between variable groups was large within the pragmatic, but medium within the hedonic aspect. Especially in cases when a prototype was least preferred and the tasks perceived as very difficult, the percent of selected positive cards dropped and the percent of selected negative cards rose significantly compared to the cases where the tasks were perceived as easy and the participant felt positive towards the system.
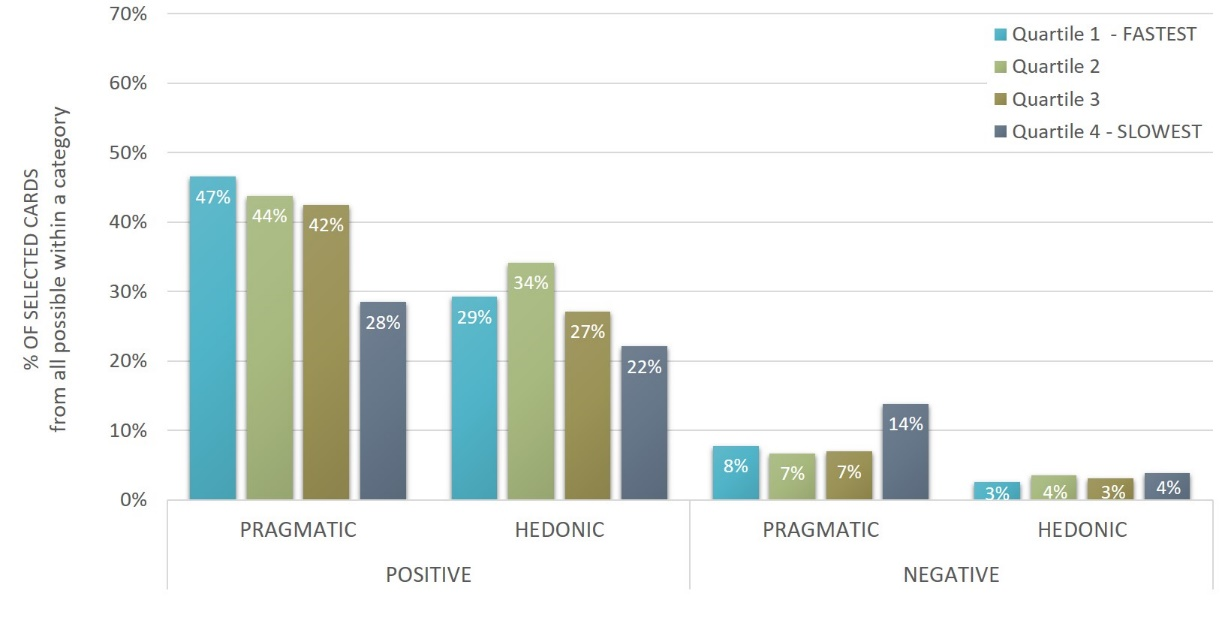
Figure 4: Selection of cards based on participant’s mean time-on-task
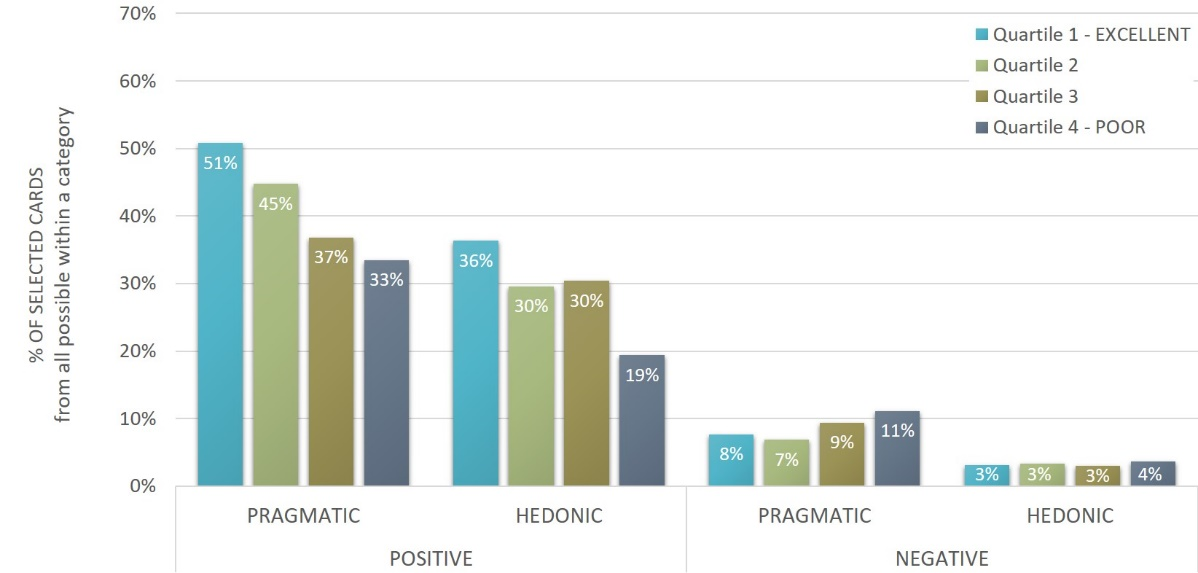
Figure 5: Selection of cards based on participant’s mean task completion.
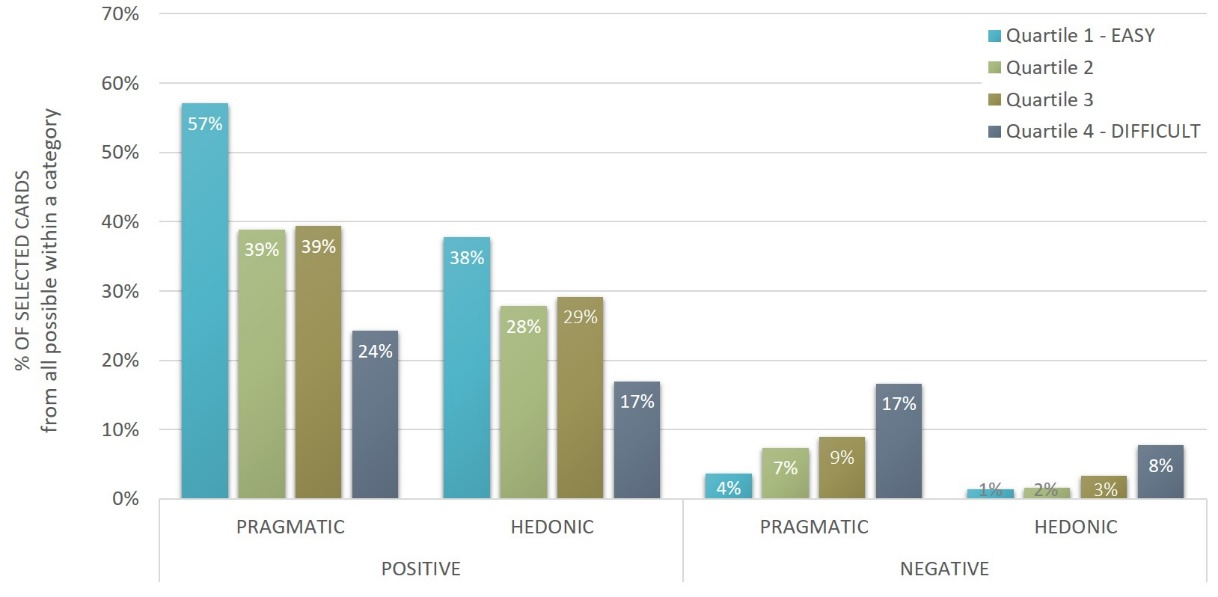
Figure 6: Selection of cards based on participant’s mean task difficulty.
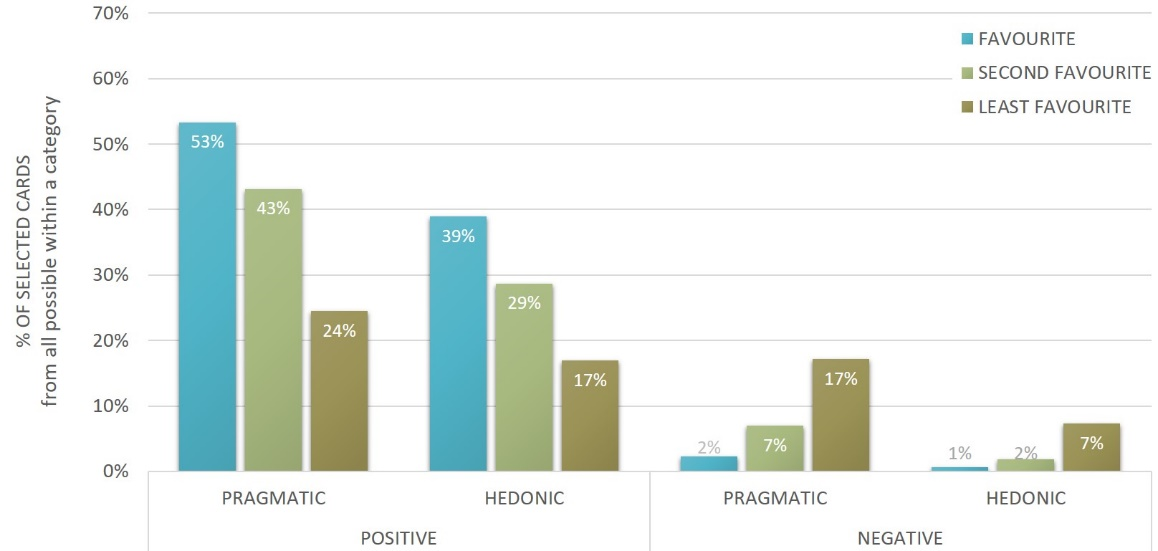
Figure 7: Selection of cards based on participant’s system preference ranking
Concluding remarks
Our investigation of reaction cards presents a small step in the understanding of user experience and the factors that influence how people perceive a product or a system. As user experience can be examined in a variety of environments from web sites to games, computer systems, mobile applications and physical objects (overview in Bargas-Avila and Hornbæk, 2011), the preliminary results of our investigation can therefore be only considered in the narrow context of information system user interfaces. We also feel that the utilitarian nature of the tested bibliographic information systems (i.e. library catalogue) in particular did influence the selected proportions of pragmatic and hedonic attributes as participants would likely asses the system more based on its usefulness and efficiency than its enjoyment. It would therefore be interesting to compare our results with a system that is primarily intended for entertainment or free time activities and is used for reasons other than necessity.
There are also some other limitations of the study that prevent us from gaining an even deeper understanding of the phenomenon. As the study was not originally designed to investigate user experience in-depth or the particularities of pragmatic and hedonic aspects, the selection of the reaction cards used in the study was not made with this goal in mind. Considering the information we could extract from our data, we would also be interested in some other participants’ characteristics that were not collected in our study.
The preliminary analysis has, however, provided some more understanding of the factors that influence how people experience a system. We thought that maybe women would concentrate more on the hedonic perspective and men would analyse more the pragmatic aspects or that participants with a science and engineering background would be more critical of the pragmatic aspects, but the results showed no differences between these groups. It was surprising to see that as participants were exposed to more systems, their observations became more critical. This tells us that when evaluating user experience, also this aspect should be taken into consideration and examined in more detail. While the effect on performance and perceived difficulty on the positive or negative user experience is known, we found it interesting that the effect was somewhat less distinct in the hedonic aspect and that the task success did not have such a strong impact as some of the other variables.
This paper presents our initial analysis of the collected data from the viewpoint of interrelationships between different aspects of user experience. In our further examination, we plan to explore the possibilities of building a model of predictors of positive, negative, hedonic and pragmatic aspects using multiple regression analysis. The paper also introduces the potential of the reaction cards method for investigating user experience dimensions. While we feel that the method captures some important information, it would be interesting to explore its possibilities further not only from the viewpoint of the most appropriate set of words, but also in terms of analysis that would give us a better understanding of when we can designate an experience as positive or negative and what other information can be extracted using this method.
Acknowledgements
The prototypes tested were developed in cooperation with dr. Trond Aalberg (NTNU, Norway).
About the authors
Tanja Merčun is Associate Professor in the Department of Library and Information Science and Book Studies at University of Ljubljana, Slovenia. She received her Ph.D. in 2012 from University of Ljubljana. Her research interests include bibliographic data, evaluation of end-user interfaces, and user experience. She can be contacted at tanja.mercun@ff.uni-lj.si
Maja Žumer is Professor in the Department of Library and Information Science and Book Studies at University of Ljubljana, Slovenia. She received her Ph.D in 1999 from University of Zagreb, Croatia. Her research interests include design and evaluation of information retrieval systems, end-user interfaces, usability and conceptual modelling. She can be contacted at maja.zumer@ff.uni-lj.si
References
- Bargas-Avila, J. A. & Hornbæk, K. (2011). Old wine in new bottles or novel challenges: a critical analysis of empirical studies of user experience. In Proceedings of the SIGCHI Conference on Human Factors in Computing Systems (pp. 2689-2698). New York: ACM.
- Benedek, J. & Miner, T. (2002). Measuring desirability: new methods for evaluating desirability in a usability lab setting. Paper presented at UPA 2002 Conference. Retrieved from www.microsoft.com/usability/uepostings/desirabilitytoolkit.doc (Archived by WebCite® at http://www.webcitation.org/6kAzhg11j)
- Brandenburg, S., Vogel, M. & Drewitz, U. (2013). User experience starts at the keystroke level: the model of user experience (MUX). In Aaron Marcus, (Ed.), Design, User Experience, and Usability. Design Philosophy, Methods, and Tools (pp. 449-458). Berlin: Springer. (Lecture Notes in Computer Science, 8012).
- De Guzman, E. S. & Schiller, J. (2011). How does this look? Desirability methods for evaluating visual design. In Constantine Stephanidis, (Ed.), HCI International 2011 - posters’ extended abstracts (pp. 123-127). Berlin: Springer. (Communications in Computer and Information Science, 173).
- Doyle, J., Quigley, A., Nixon, P. & Caulfield, B. (2010). Towards a pattern language approach to sharing experiences in healthcare technology evaluation. In Gerhard Leitner, Martin Hitz & Andreas Holzinger, (Eds.), HCI in work and learning, life and leisure (pp. 124-137). Berlin: Springer. (Lecture Notes in Computer Science, 6389).
- Hassenzahl, M. & Tractinsky, N. (2006). User experience - a research agenda. Behaviour & information technology, 25(2), 91-97.
- Hassenzahl, M. (2005). The thing and I: understanding the relationship between user and product. In Mark A. Blythe, Kees Overbeeke, Andrew F. Monk, Peter C. Wright, (Eds.), Funology: from usability to enjoyment (pp. 31-42). Netherlands: Springer. (Human-Computer Interaction Series, 3).
- Hassenzahl, M., Wiklund-Engblom, A., Bengs, A., Hägglund, S. & Diefenbach, S. (2015). Experience-oriented and product-oriented evaluation: psychological need fulfilment, positive affect, and product perception. International Journal of Human-Computer Interaction, 31(8).
- Hastings, J. D., Mirasano, A., Latchininsky, A. & Schell, S. P. (2010). CARMA: assessing usability through a non-biased online survey technique. In Proceedings of the 43rd Hawaii International Conference on System Sciences (HICSS-43) (pp. 1-10). New York: IEEE.
- Karapanos, E. (2013). Modeling users' experiences with interactive systems. Heidelberg: Springer. (Studies in Computational Intelligence, 436).
- Lallemand, C., Gronier, G. & Koenig, V. (2015). User experience: a concept without consensus? Exploring practitioners’ perspectives through an international survey. Computers in Human Behavior, 43, 35-48.
- Mahlke, S. & Thüring, M. (2007). Studying antecedents of emotional experiences in interactive contexts. In Proceedings of the SIGCHI Conference on Human Factors in Computing Systems (pp. 915-918). New York: ACM.
- Michailidou, I., von Saucken, C., Kremer, S., & Lindemann, U. (2014). A user experience design toolkit. In Marcus, A., (Ed.), Design, User Experience, and Usability. Theories, Methods, and Tools for Designing the User Experience (pp. 163-172). Springer. (Lecture Notes in Computer Science, 8517).
- Minge, M. (2008). Dynamics of User Experience. Paper presented at the NordiCHI ’08, Workshop on research goals and strategies for studying user experience and emotion, Lund, Sweden. Retrieved from http://bit.ly/2kS9axZ (Archived by WebCite® at http://www.webcitation.org/6kAzycZq6)
- Van der Heijden, H. (2004). User acceptance of hedonic information systems. MIS Quarterly, 28(4), 695–704.