Cognitive styles and eye movement patterns: an empirical investigation into user interactions with interface elements and visualisation objects of a scientific information system
Rong Tang and Yeseul Song.
Introduction. An eye-tracking study was conducted to investigate the impact of astrophysicists’ cognitive styles on how they interact with interface visualisation objects of the Astrophysics Data System.
Method. Twenty users participated in this study by first completing a cognitive test, then performing tasks in version 2.0 of the system using its visualisation tools.
Analysis. The interface objects were coded into ACT (functional icons), HELP (help information), IMG (images or visualisations), and TXT (text information). The eye movement patterns of participants who were imagers, analysers, or analytic-imagers) were compared with those who were non-imagers, non-analysers, or non- analytic-imagers. Qualitative inspection of heat maps was performed to complement and validate the differences found through quantitative data analysis.
Results. Participants’ cognitive styles had significant impact on their interest and noticeability measures. Imagers not only clicked on and visited more IMGs, they also were more actively engaged with ACTs and TXTs than non-imagers. While analysers focused more on HELP, analytic-imagers also fixated or gazed significantly longer on HELP than non- analytic-imagers.
Conclusions. Empirical studies that connect cognitive style with users’ eye movements are rather limited. Findings of the present study provide insights into the interplay between users’ cognitive styles and their eye movements when viewing specific types of interface objects.
Introduction
The present research explores the relationship between scientists’ cognitive styles and their eye movement patterns as they interact with a bibliographic retrieval system featuring visualisation tools. Specifically, astrophysicists’ interaction with the Astrophysics Data System was captured and studied. The Astrophysics Data System (ADS henceforth) is a 'a Digital Library portal for researchers in Astronomy and Physics, operated by the Smithsonian Astrophysical Observatory under a NASA grant' (Smithsonian..., n.d.). The ADS ‘maintains three bibliographic databases containing more than 12.8 million records covering publications in Astronomy and Astrophysics, Physics, and the arXiv e-prints'. According to the NASA Astrophysics Archival Senior Review Panel (Bregman, et al., 2008, p. 4),
The NASA (ADS) provides bibliographic information on articles and preprints in astronomy, instrumentation, and physics to the great majority of U.S. astronomers. It is the premiere astronomical search engine for finding publications on any astronomical subject with links to abstracts and articles.
Housed in the Harvard/Smithsonian Center for Astrophysics and launched in 1993, ADS was developed to serve ‘50,000 scientists worldwide’ (Chyla et al., 2015, p. 1). The user base for the system, as commented by Chyla et al. (2015), ‘is considerable. Currently at any given time there are ∼ 200 − 300 active users on the website (which amounts to ∼ 1 million unique sessions per month)’ (p.1). In 2014 when the research project was conducted, there were two versions of the interface: ADS Classic and ADS Labs (referred to as ADS 2.0). According to the developers, ‘as a result of the massive technological and sociological changes in the field of scholarly communication, the ADS is now completing the most ambitious technological upgrade in its twenty-year history’ (Accomazzi et al., 2014). In the ADS 2.0 interface, the results page features a selection of visualisation functions, including metrics, author network, paper network, and word cloud. Figures 1 and 2 are screen shots of the author network and metrics functions of ADS 2.0.
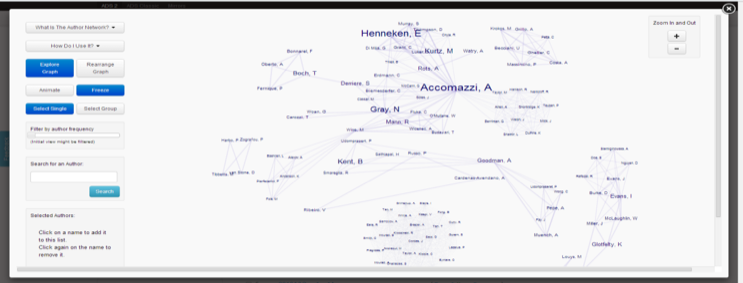
Figure 1: ADS 2.0 Author network visualisation upon searching Accomazzi, Alberto
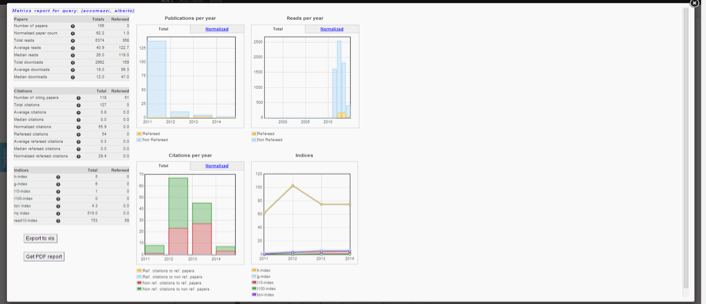
Figure 2: ADS 2.0 Metrics display upon searching Accomazzi, Alberto
Three rounds of usability tests of ADS Labs/2.0 had been conducted as class projects under the instruction of the first author. Over the course of three non-consecutive semesters, seventeen graduate students in the field of astrophysics at Harvard University participated in class research projects. Recommendations were made concerning the visibility of icons, confusion about terminology and conceptual inconsistencies (Danis, Corbett and Kurahashi, 2011; von Eye, He and Hileman, 2011; Prentice and Guillette, 2012; Cressman, Singley, Perry and Walsh, 2014). The design of the ADS 2.0 interface was modified partly based on the recommendations from students of usability classes in three different semesters upon completing their usability testing, heuristic evaluation, content inventory, and other user-experience-related feedback activities. As ADS 2.0 was launched in 2014 (Accomazzi et al., 2014) with re-engineered subsystems to create a new mode of bibliographic retrieval and visualisation (Chyla et al., 2015), there was a need to conduct more thorough user behaviour research both on the ADS 2.0 interface and the core user group (i.e., long term users with beyond graduate-level research experiences).
Previous usability studies of the Astrophysical Data System had been run mainly using graduate students at the Center for Astrophysics as study participants. However, the long-term, primary users of the system are astrophysicists who conduct research and publish their papers in academic journals that would be indexed by the system. These users not only published and checked on their own publications for citation impact, but also relied heavily on tracking, monitoring, and reviewing other published research in their subject areas to update their current awareness of the field. Without the system's primary users as research participants, the understanding of user experience and behaviour related to the system would be limited. To investigate the cognitive characteristics of the primary user population and their eye behaviour with the ADS 2.0 user interface, we incorporated a verbal imagery cognitive style test (VICS) and an extended cognitive style analysis – wholistic analytic test (extended CSA-WA Test) (Peterson, 2005). Combining both tests enabled a comprehensive understanding of users’ cognitive style that involved both the imager-verbaliser and analytic-wholistic cognitive dimensions, which was articulated by Riding (1991) and Riding and Cheema (1991). Multiple studies of cognitive styles and information searching (Park and Black, 2007; Yuan and Liu, 2013; Liu, Thomas, Bacic, Gedeon and Li, 2017) have revealed that cognitive styles influence users’ task performance when interacting with a text-based graphic user interface system and a search results visualisation system. By capturing ADS primary users’ cognitive traits, we hope to further understand the effect of cognitive styles, as articulated by Riding and Cheema (1991) and Riding and Rayner (1998), on user task performance and their eye movements as they use the system. Following the completion of the VICS and extended CSA-WA tests, participants performed five tasks using ADS 2.0. Both their interaction behaviour and eye movements were captured through TechSmith’s Morae software and the Tobii eye-tracker. This paper examines the relationship between cognitive style and users’ eye movements by incorporating measures of cognitive style into the examination of users’ fixation activities and gaze patterns when they interact with different interface elements and data visualisation objects. Specifically, the ADS interface elements and data visualisation objects under investigation for the present study included four types: image objects (IMG), action objects (ACT), text objects (TXT), and help objects (HELP). More details about these four types of visualisation objects are provided in the discussion on the methods.
Literature review
In information science research, investigation into information seeking and searching behaviour has always been based on a conceptual framework connecting users’ cognitive attributes with searching moves (e.g., Wilson, 1999; Ingwerson, 1996). In their review of information behaviour research, O’Brien, Dickinson and Askin (2017) summarised it as ‘cognitive styles were significantly related to information behavior and preferences in many of the studies’ (p. 251). In the fields of cognitive and educational psychology, research on cognitive styles abounds. Consequently, we have focused on literature pertaining directly to the variables of interest in the current study.
Cognitive styles: the VICS and CSA-WA tests
Cognitive styles can be defined as stable attitudes, preferences, or habitual strategies that determine an individual’s modes of perceiving, remembering, thinking, and problem solving (Messick, 1976). To understand individual differences in cognition, researchers in psychology and other fields have developed a variety of taxonomies describing cognitive styles, such as locus of control (Rotter, 1966), concept articulation (Bieri, 1955; Messick, 1976), and field-dependency (Witkin, Moore, Goodenough and Cox, 1977). Field-dependency as a cognitive style construct was first introduced by Witkin et al. (1977). According to the authors, field-dependent people rely on accepting cues from the overall environment, while field-independents have a tendency to think analytically and theoretically. Later works by Riding and his colleagues (e.g., Riding and Rayner, 1998) argued that the field-dependent/-independent grouping is very similar to their wholistic-analytic style dimension. Based on the results of a series of research studies on cognitive styles, Riding and Cheema (1991) proposed two major orthogonal cognitive style families: wholistic–analytic and verbaliser–imager. While the wholistic-analytic style dimension relates to ‘whether an individual tends to process information in wholes or parts’, the verbaliser-imager style dimension pertains to ‘whether an individual is inclined to represent information during thinking verbally or in mental pictures’ (Riding, 1997, p. 30).
Subsequently, Riding (1991) developed a computerised assessment to determine an individual’s style, called cognitive style analysis. To improve the test-reliability and internal consistency of the automatic test, Peterson (2003a, 2003b, 2005) developed the measure of verbal–imagery cognitive style (VICS) and the extended cognitive style analysis-wholistic analytic test (Extended CSA-WA). In this study, because our research focus was in large part on the visualisation elements of the ADS interface, it was considered more effective to directly assess participants’ cognitive style along the dimension of imager-verbaliser. Furthermore, since VICS/CSA-WA incorporates more operable measurements and tests, the present study employed Peterson’s VICS and Extended CSA-WA software to assess participants’ cognitive styles.
Impact of cognitive style on search behaviour and eye movements
In the area of information behaviour research, numerous research studies examined the effect of cognitive style on user search behaviour. Most recently, O’Brien and her colleagues (2017) conducted a scope review of 223 published articles on the topic of individual differences in information seeking behaviour and concluded that cognitive style was one of the three main factors (demographics, cognitive, and personality and affective) that affects information search behaviour. They pointed out that ‘cognitive styles were significantly related to information behavior and preferences in many of the studies, though there is still some ambiguity regarding what styles have an impact on specific outcomes’ (p. 251). Meanwhile, other researchers have applied a variety of categorisations of cognitive styles such as field-dependent -independent (e.g., Leader and Klein, 1996; Palmquist and Kim, 2000; Kim and Allen, 2002; Yecan and Çağıltay, 2006), imager-verbaliser (Kinley and Tjondronegoro, 2010), or analytic-wholistic (Yuan, Zhang, Chen and Avery, 2011; Yuan and Liu, 2013). In several cases, both imager-verbaliser and analytic-wholistic were investigated together in one setting (Graff, 2003; Uruchrutu, MacKinnon and Rist, 2005).
As an example of studying the impact of specific cognitive styles on searching behaviours, Leader and Klein (1996) studied the effects of types of search tools and cognitive style on hypermedia database searches. They found that field-independent learners performed significantly better than field-dependent learners under the index/find and map treatments. Palmquist and Kim (2000) examined the effect of cognitive styles (field dependency) and found that cognitive style significantly influenced the search performance of novice searchers. Authors also found that participants who were field-dependent took significantly longer time to complete search tasks than those who were field-independent. Yecan and Çağıltay (2006) compared eye gazing data from the two types on an instructional website and discovered field-dependent users spent on average a longer time in their fixation duration than field-independent users.
As of February 2018, multiple studies (e.g., Kinley and Tjondronegoro, 2010; Yuan and Liu, 2013) have incorporated the imager-verbaliser or analytic-wholistic cognitive styles as their research variables. These studies investigated several aspects of information system interaction (e.g., performance, navigation style, and satisfaction) that were affected by these cognitive styles. For example, Graff (2003) compared task performance among participants of various cognitive styles and found analytic users and wholistic users outperformed intermediate users on their online assessment. Another example is Kinley and Tjondronegoro’s (2010) investigation into the differences between imagers and verbalisers in Web searching. Their results showed that verbalisers display sporadic navigation styles and adopt a scanning strategy to understand search result contents, whereas imagers followed a structured navigational style and reading approach. Yuan et al. (2011) found that in a ‘knowledge domain visualisation system’ called CiteSpace analytic participants identified more correct answers than wholistic participants. In an extension of the study by Yuan et al., Yuan and Liu (2013) reported that analytic participants consistently produced better scores than other participants.
It is only recently that researchers started using eye-tracking data to study the information behaviour of different cognitive styles. Liu et al. (2017) conducted an eye-tracking study for the purpose of understanding biomedical domain experts’ interactions on a novel information retrieval system. A total of thirty-two participants were asked to use four different search interfaces based on the same underlying system. The four search interfaces were distinguished by whether Medical Subject Headings (MeSH) terms were presented and how the displayed these terms were generated. Interface A mimicked Web search with no controlled vocabulary presented. Interfaces B, C, and D added MeSH terms to the interface in different ways. Interface B mimicked ProQuest and showed suggested MeSH terms for the search query at the top of the screen, Interface C displayed the same MeSH terms alongside each document, and Interface D provided MeSH terms associated with each document as well as the query being displayed alongside each document similarly to EBSCOhost. Researchers found significant differences between the eye gaze behaviour of participants with wholistic and qnalytic styles when they interacted with all four search interfaces. Each cognitive style group paid different amount of attentions to MeSH, but each group also showed design preferences:
Specifically, Wholistic users’ preference of having an overview before drilling down into details was confirmed in the most amount of attention received for MeSH terms in Interface D, while Analytic users’ preference of looking for specific information was supported by their attention to MeSH terms in Interface B (Liu et al., 2017, p. 14).
In an earlier paper by Wittek, Liu, Darányi, Gedeon and Lim (2016), which used the same data as Liu et al. (2017), the authors discovered that wholistic and analytic users had significantly different search strategies in terms of dealing with risk and ambiguity in the information seeking process. According to Wittek, et al., ‘risk is the quality of the current patch and our fragmented perception of it, while ambiguity is related to opportunity cost, the price of not foraging elsewhere’ (p. 2). In this study, analytic users focused on exploitation of resources first, while wholistic users preferred to explore the search space first then consume later.
Eye movement research and measurements
Taxonomy of measures
One of the challenges for researchers conducting eye-tracking studies is that they need to first identify the relevant eye-tracking metrics that are essential to address their research questions, and then subsequently plan for eye-tracking task scenarios and other cognitive activities pertinent to their research study (Jacob and Karn, 2003; Holmqvist et al., 2011; Bojko, 2013; Duchowski, 2003). Over the years, there have been several studies presenting taxonomies of eye-tracking measures to help guide researchers. Researchers examining eye-tracking in user behaviour research have typically regarded fixation and saccades (defined as eye movements between fixations) as primary eye movement metrics. Fixation and saccades are also regarded as essential elements of eye-tracking data (Manhartsberger and Zellhofer, 2005; Jacot and Karn, 2003). Longer fixations could indicate an intensive level of interest in an element on the interface or a visualisation object; longer fixations could also reveal greater visual complexity demanding more visual inspection to fully interpret the meaning and functionality of a specific area, depending on the context. Followed by fixation and saccades, scan-path, a path of eye movements made by connecting fixations and saccades in sequence, and gaze have been commonly mentioned as important measures by multiple researchers.
According to Goldberg and Kotval (1999), eye-tracking measures may be classified into two dimensions: temporal and spatial, and fixation and saccades. Temporal measures capture the sequential, time-based nature of a scan-path, such as duration, whereas spatial emphasizes the spread and coverage of a scan-path, such as spatial density. A few years later, by integrating earlier eye-tracking literature, Poole and Ball (2006) proposed four groups of measures: fixation-derived, saccade-derived, scan-path-derived, and blink rate and pupil size. Ehmke and Wilson (2007) used a classification system similar to Poole and Ball’s. The authors divided the measures into four groups: fixation-related, saccade-related, scan-path-related, and gaze-related.
In 2011, Holmqvist et al. offered a comprehensive classification system that crosses various disciplines by collecting and dividing many eye-tracking measures. They presented over 100 eye-tracking measures and outlined four primary types of measures based on an operational definition: movement measures; position measures; numerosity measures; and latency and distance measures. In their taxonomy, fixation, saccade, and scan-path measures are dispersed over four different categories. Eye movement measures typically include saccade-derived and scan-path-related measures, and several fixation-derived and gaze-related measures are listed as position measures. Numerosity measures include number, proportion, and rate of saccades, as well as fixations and dwells. Latency and distance measures include two saccadic-related measures, saccadic latency, and saccadic gain. Note that the work of Holmqvist et al. work also includes highly technical or esoteric measures that are rarely considered in usability studies.
A taxonomy of eye movement measures that is oriented toward user experience and the intensity of user engagement was outlined by Bojko (2013) through measures of attractiveness. This taxonomy contains two main categories: measures of attraction and measures of performance. The first group has area noticeability measures, area interest measures, and emotional arousal measures. Area noticeability measures, for example, includes the percentage of participants who fixated on an area of interest; the number of fixations prior to first fixation on an area of interest; and the time to first fixation on an area. The second group has mental workload, cognitive processing, target findability, and target recognisability measures. Furthermore, Bojko emphasises the importance of reporting the percentage of participant focus on areas of interest or screens when analysing data to preclude any possibilities of distortion. For example, if a study has ten participants, there is a possibility that only one participant gazed at or fixated on an area of interest. Unless the proportion of the participants on that area is explicitly reported, the results in this case could mislead people into thinking that the data is based on all ten participants’ eye behaviour.
Measurements in Tobii Studio
In Tobii Studio, two types of data are collected through the software: numeric data and visualisation. Numeric data can be divided into three groups: fixation, visit, and click. Fixation data include: fixation duration, fixation count, and percentage fixated, among others. Examples for gaze measures are: visit duration and visit count. Click measures consist of time to first mouse click and mouse click count, among others. All collected data are based on an area of interest defined by the researcher conducting the analysis. Tobii visualisations include gaze-plot, heat map, and cluster, which are all based on fixation and saccades data. Since Bojko’s (2013) taxonomy is, to date, the most comprehensively connected with user experience in the dimension of measures of attraction (noticeability and interests), we decided to incorporate Bojko’s taxonomy with Tobii’s measures. The following classification (Table 1) of the eye movement measures was used in the present study. In Tobii’s (2016) metrics, fixation duration ‘measures the duration of each individual fixation within an AOI [area of interest]’ (p. 106), whereas total fixation duration measures ‘the sum of the duration for all fixations within an AOI’ (p. 106). A visit in Tobii is defined as ‘the interval of time between the first fixation on the AOI and the next fixation outside the AOI’ (p. 109). A visit duration is defined as the ‘duration of each individual visit within an AOI’. Total visit duration is ‘the sum of visit durations of an active AOI’ (p. 110).
| Measures | User-experience category | Eye-tracking metrics |
|---|---|---|
| Measures of attraction | Noticeability | Percentage of participants who fixated on an area of interest Number of fixations prior to first fixation on an area of interest (fixation before) Time to first fixation on an area of interest First fixation duration on an area of interest |
| Interests | Number of fixations on an area of interest (fixation count) Number of gaze visits on an area of interest (visit count) Number of mouse clicks on an area of interest (mouse click count) Total visit duration and visit duration on an area of interest Total fixation duration and fixation duration on an area of interest Percentage of task time on an area of interest | |
| Measures of performance | Efficiency and activities | Total task time Time from first fixation to click on an area of interest Time to first click on an area of interest Percentage of participants who clicked on an area of interest |
In summary, existing research has provided meaningful insight into users’ cognitive styles and search behaviour. However, even though several studies have shown significant differences between the styles of search activities (e.g., Park and Black, 2007; Yuan and Liu, 2013), only a few studies (e.g., Liu, et al., 2017) have examined the impact of cognitive styles on users’ eye movement patterns. Furthermore, most existing studies relied on system-side performance measures (e.g., time, task success, and outcomes); none focused on how users of varying cognitive styles interact with specific types of visualisation objects. Among the research literature examining eye-tracking research and relevant metrics, very few have investigated the impact of users’ cognitive style on their eye movements. This study incorporates measures of cognitive style to examine users’ fixation activities and gaze patterns when they interact with particular kinds of interface objects.
Research objectives and research questions
The objective of this research study is threefold: we aim to:
- Capture the cognitive styles of astrophysicists for understanding scientific users’ behaviour as they interact with scientific information systems.
- Investigate the differences between participants of varying cognitive styles (imagers versus non-imagers; analyser versus non-analysers; analyser-imagers versus non-analyser-imagers) and their eye movement patterns when viewing various interface elements and visualisation objects.
- Explore the implications of such differences in designing user interface and visualisation components of a scientific information system.
Consequently, we address the following research questions:
RQ1. What cognitive styles do users of the Astrophysics Data System exhibit?
RQ2. What differences exist between participants who used ADS 2.0 before and those who did not in their interactions with various interface elements and visualisation objects?
RQ3. To what extent do users of different cognitive styles vary in their time-based performance measures?
RQ4. What differences exist between participants of different cognitive styles and their eye behaviour when viewing all interface objects combined as well as specific types of interface objects?
RQ5. How do qualitative inspections of heat map patterns agree or disagree with and add further insights to quantitative statistical test results?
Method
Sample and data-sets
A call for participation was sent to the Center for Astrophysics listserv by the ADS programme manager Dr Alberto Accomazzi in April 2014. A task scenario had been developed, in consultation with Dr Accomazzi and CfA staff members, by Dr Michael Kurtz, an esteemed astrophysicist who has been on the system development team for over two decades. The first two tasks were self-directed, and participants were asked to search for their own topics and publications. The remaining three tasks were based on utilizing the visualisation tools (author network, metrics, and paper network) in the system. The scenario was pilot-tested by two users, and revised based on their feedback and that of librarians working in the Center for Astrophysics Library. Twenty usability test and eye-tracking sessions took place at Harvard Wolbach Library between April 18 and May 8, 2014. Each participant attended the research session individually. The sample size of the study was not as high as planned due to the limited availability of astrophysicists on site during the time of the research study, however, very rich and extensive eye movement data on thousands of interface objects was obtained. In total, participants examined 6,300 individual interface objects across five tasks. Overall, the participants produced 81,392 fixations and 30,369 visits, averaging more than 4,000 fixations and 1,500 visits per person.
Procedure
All participants came in for an individual session. Each session was led by a researcher acting as moderator for the session. One or two researchers observed. The session took place in the Collaboration Space (an open space on the ground floor, away from the reference desk) of the Center for Astrophysics Library. A Tobii eye-tracker monitor was used as the main screen for participants to complete their tasks and for researchers to capture participants’ eye movements. Each participant began by taking a 25-30 minute cognitive test. Immediately following the cognitive style test, a pre-session interview was conducted during which the participant was asked about their past user experience with the ADS, the types of searches they conducted, and whether they considered themselves a visual or verbal person. After the pre-session interview, after being calibrated by the eye-tracker, participants were asked to perform five tasks. The task performance made up the actual usability testing session. As described earlier, the first two tasks focused on searching their own topics and their own publications, with Task 2 asking them to explore three visualisation tools: word cloud, metrics, and author network. Tasks 3 through 5 were common tasks for all participants, with Task 3 connecting the visualisation of search results to author network, Task 4 to metrics, and Task 5 to paper network. Table 2 outlines the gist of the five tasks. See the Appendix for the full task scenario
.Upon completing their tasks, participants did a brief retrospective task analysis session where they reviewed their eye movements for a randomly chosen task for three to five minutes and articulated their thoughts. Lastly, the researchers interviewed the participants to discuss their likelihood in using individual visualisation tools, what additional features they considered useful, and how they compared ADS 2.0 with ADS Classic. Thus, during one research session, the participant took the cognitive style test, moved on to the usability test which included a pre-session interview, a task scenario performance and a retrospective task analysis, and finished with a post-session interview. Excluding the cognitive test time, each session time averaged 67 minutes, with task performance time averaging 35 minutes.
| No. | Task goals | Visualisation used |
|---|---|---|
| 1 | Search your own topic | |
| 2 | Search your own (or your advisor’s) publications | Word cloud, metrics, author network |
| 3 | Identify common referees | Author network |
| 4 | Research productivity evaluation | Metrics |
| 5 | Michael Kurtz Publications | Paper network |
Data processing and coding
Eye-tracking data were coded in Tobii by scenes and segments. On each scene, various areas of interests were specified. Tobii metrics then generated various counts and measures based on those areas. Given that our research question 4 specifically addresses the differences between cognitive styles and their eye behaviour in viewing various interface elements and visualisation objects, we grouped the areas of interest into four categories including ACT (buttons, tabs, menus and links to perform an action), TXT (textual objects), IMG (image or visualisation objects) and HELP (help information). Among these categories, the highest number of objects viewed by study participants were ACT objects, followed by TXT, then HELP, then IMG objects. In addition to research question 4, this coding of visualisation objects served as the basis of our examination for research question 2 as well as research question 3. Not only did we compare the eye gaze behaviour of people with different cognitive styles when viewing the ACT, TXT, IMG, and HELP objects, we also investigated the differences between participants who had used ADS 2.0 previously with people who had never used ADS 2.0, as well as the differences between cognitive styles and their various time-based performance measures when viewing different object types. Figures 3 and 4 show how the system screens were coded by areas of interest and how each area was subsequently coded as ACT, TXT, HELP, and IMG. Note that in performing statistical analysis of group differences, non-parametric Mann-Whitney U tests were used, as the eye-tracking data were not necessarily normally distributed.
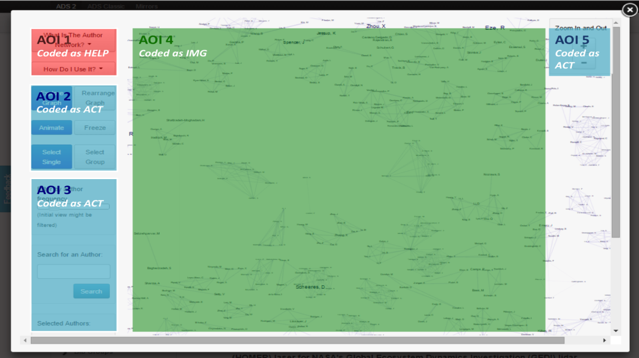
Figure 3: Areas of interest and types of object coding for the author network visualisation screen
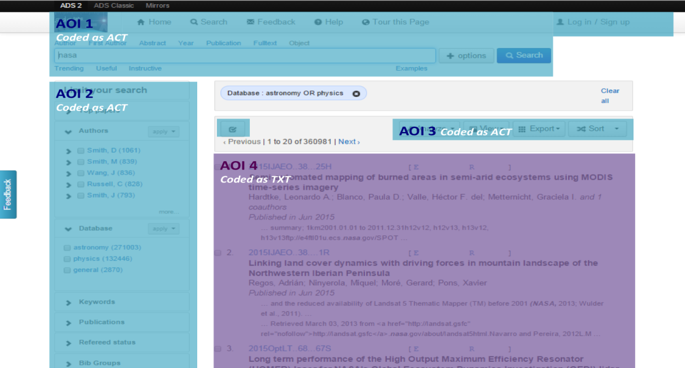
Figure 4: Coding of areas of interest and types of objects for ADS 2.0 results screen
Results
Cognitive styles of users of the Astrophysics Data System
The research study included twenty participants: three were female and seventeen male. Participants’ ages ranged from twenty-four to sixty-four years; average and median ages were forty and forty-three years, respectively (based on the answers of nineteen participants). Half of the participants were native English speakers. Research length ranged from five to forty years, averaging sixteen years. Participants’ fields of research ranged from astronomy and astrophysics, stellar astrophysics, solar physics, galaxies, supernovae, to X-ray astronomy. Seventeen participants worked at Harvard Center for Astrophysics, and of the remaining three, one was a visiting scientist from Argentina, one from Yale, and one from Massachusetts Institute of Technology. The demographic characteristics of these participants reflect the study population of astrophysicists, according to Dr. Accomazzi, Dr. Kurtz, Christopher Erdmann (Head librarian of the Center for Astrophysics Library), and other Center staff members (personal communication, April 11, 2014). Some of the research projects which participants were working on include: impact of embedded B-star wind on the Ophiuchus cloud; analysis of the variability of C IV lines in TW Hya; and characterising shock waves in the solar corona, and their ability to accelerate protons to high energies.
All participants had used Astrophysics Data System Classic, and fourteen had used ADS 2.0 before the study. The average self-rating of familiarity and proficiency with the system was 5.4 and 4.9 respectively, on a seven-point scale where seven is the highest point of familiarity and proficiency. All participants reported using the system as their core research tool to ‘hunt for papers’. One participant added that he used ADS ‘often just to obtain the full text of a cited paper, e.g.. Smith et al. 1994’. Less frequently mentioned was trying to find key papers in a subfield that ‘I'm not very familiar with’. Another participant commented:
I use ADS for all my bibliographic searches. It is my main source to look for papers on my field. I normally use it to look for all references on a particular source such as AGN or X-ray binaries.
The third participant listed how she uses ADS for her research:
1) search for the articles relevant to my current topic of research;
2) follow the references given in the articles to find other relevant publications;
3) search for publications of the specific author, topic, object;
4) find the catalogs of data which are relevant to my research and referenced in the publications.
Most participants had used ADS to search for a specific paper as a known item, but some participants also conducted subject searches related to their topics. The most frequently mentioned search type is author search, followed by title search, keyword search, or subject search. Note that in our design of the tasks for the eye-tracking scenario, there were tasks for author search and subject search. The first two tasks were self-directed: participants were given a chance to search for their own topic and their own work using keyword and title search options. We did not observe any problems with tasks that were unfamiliar or out of the ordinary to participants, and we believed that our tasks were the typical search tasks that participants performed when using the system for their scholarly work.
The VICS results showed that eleven participants had the median verbal/imagery ratios above 1.0 (an inclination towards the imager category), eight participants were in between 0.8 and 1.0 (the bimodal category) and one participant had below 0.8 (an inclination towards the verbaliser category). The CSA-WA test results showed that while nine participants’ median wholistic/analytic ratios were between 0.97 and 1.25 (belonging to the intermediate category), ten participants’ ratios were above 1.25 (inclined towards the analytic category), and one participant was below 0.97 (inclined towards the wholistic category). Overall, imagers and analysers were popular groups among participants. We decided to compare these two groups with the non-imager and non-analyser group, to contrast them with the clear grouping of imagers/analysers. In subsequent data analysis, comparisons were made between imagers and non-imagers (non-imagers included both bimodal and verbalisers), analysers and non-analysers (non-analysers included both intermediate and wholistic styles), analytic-imager and non-analytic-imagers. Analytic-imager participants are participants who tested both as an imager and an analyser. Non-analytic-imager participants included six intermediate bimodal participants, two intermediate imagers, two analytic bimodal participants, one wholistic imager, and one intermediate verbaliser. Table 3 summarises the results of the cognitive tests as well as participants’ self-perception of being a visual person or a verbal person. The cognitive style groups used in statistical analysis for this study are also listed in this table. Note that due to the small sample number in each category, the generalisability of the study results would be limited. It was found that there was no statistically significant difference in the VICS scores between self-perceived imagers versus non-imagers (U=1.01, Z = -0.91, p = 0.36). Meanwhile, both age (rho = -0.55, p = 0.015) and research length (rho = -0.48, p =0.046) were found to correlate negatively with the VICS scores. This means that, in this participant group, the imagers tend to be younger and have less research experience.
| Cognitive style | Test results | Self-perception | Groups used for analysis |
|---|---|---|---|
| Imager vs verbaliser | Imager: n = 11 Bimodal: n = 8 Verbaliser: n = 1 | Visual person: n = 11 Verbal person: n = 1 Balanced: n = 4 Don’t know/depends = 3 Auditory: n = 1 | Imager (n = 11) Non-imager (n = 9) |
| Analytic vs wholistic | Analyser: n = 10 Intermediate: n = 9 Wholistic: n = 1 | Analyser (n = 10) Non-analyser (n = 10) | |
| Cognitive Dimensions | Analytic imager: n = 8 Intermediate bimodal: n = 6 Intermediate imager: n = 2 Analytic bimodal: n = 2 Wholistic imager: n = 1 | Intermediate verbaliser: n = 1 Analytic imager (n = 8) Non-analytic imager (n = 12) | |
ADS 2.0 use experience and eye movement patterns
For this research study, we investigated whether participants’ familiarity with ADS 2.0 would have an impact on participants’ eye movements when viewing various visualisation objects (research question 2). Even though there were no differences in terms of task time performance, participants who had used ADS 2.0 before (n=14) were taking actions or were drawn to interface objects more quickly than those who had not (n=6). They also had more fixations and longer fixations on IMG objects than those who had not used ADS 2.0 before the study session. However, participants who were not familiar with ADS 2.0 interface gazed more on HELP objects than participants who used ADS 2.0 previously. It appears that participants without earlier experiences relied more on HELP than those who had such experiences. Table 4 shows various differential patterns between the two groups based on a series of Mann-Whitney U tests. Note that the Mann-Whitney U test is a non-parametric test, which was used to analyse the eye-tracking data-sets, as eye movement patterns were not normally distributed.
| Objects | Metrics | Mann-Whitney U test results | Mean rank comparison |
|---|---|---|---|
| All objects | Time to first click | U =14.00, Z = -2.309, p = 0.021 | Used before < Not used before |
| Time from first fixation to click | U =14.00, Z = -2.318, p = 0.020 | Used before < Not used before | |
| IMG | Time to first fixation | U =17.00, Z = -2.062, p = 0.039 | Used before < Not used before |
| Fixation counts | U =18.00, Z = -1.979, p = 0.048 | Used before > Not used before | |
| Fixation duration | U =15.00, Z = -2.227, p = 0.026 | Used before > Not used before | |
| HELP | Visit counts | U =13.50, Z = -2.354, p = 0.019 | Used before < Not used before |
Cognitive styles and time-based task performance
The central focus of this research is to discern whether users’ cognitive style significantly impacts how they perceive interface objects. Such impacts may manifest through two areas: (1) time-based performance measures, and (2) types of interface elements or visualisation objects. Time-based performance measures include such quantitative measures concerning time as overall task time, percent of task time, time to first click, time to first fixation, and time from first fixation to click. In terms of overall task performance, no significant differences were found between performance indicators such as completion difficulties, query revision frequency, or self-rated proficiency scores (for a detailed report on task performance through usability measurements, see Tang, 2016).
The VICS scores were found to correlate with percent of time on ACT objects (rho = 0.53, p= 0.017) and TXT objects (rho = 0.56, p= 0.011). The CSA-WA scores were found to correlate with percent of time on HELP objects (rho = 0.47, p= 0.036). Mann-Whitney U tests indicated that imagers spent a higher percent of their task time on ACT objects and TXT objects. There were no differences between analysers and non-analysers in their percent of task time on types of interface objects. Interestingly, even though analyser-imager participants were found to have spent a significantly shorter overall time on their tasks than non- analyser-imager participants, they spent a higher percentage of their task time on IMG objects and HELP objects. Meanwhile, the measures concerning time and activities are also reported here as they relate to performance and efficiency. It took a significantly longer time for analysers to move from their first fixation to a mouse click when they viewed an IMG object. Analyser-imager participants were quicker to get their first fixation on the TXT or ACT objects than non-analyser-imager participants. Table 5 includes relevant Mann-Whitney U test statistics.
| Objects | Metrics | Mann-Whitney U test results | Mean rank comparison |
|---|---|---|---|
| All objects | Overall task time | U =21.00, Z = -2.083, p = 0.037 | Analyser-imager < Non- analyser-imager |
| IMG | Percent of task time | U =22.00, Z = -2.006, p = 0.045 | Analyser-imager > Non- analyser-imager |
| Time from first fixation to click | U =24.00, Z = -1.965, p = 0.049 | Analysers < Non-analysers | |
| TXT | Percent of task time | U =14.00, Z = -2.697, p = 0.007 | Imagers > Non-imagers |
| Time to first fixation | U =20.00, Z = -2.160, p = 0.031 | Analyser-imager < Non-analyser-imager | |
| ACT | Percent of task time | =18.00, Z = -2.393, p = 0.017 | Imagers Non-imagers |
| Time to first fixation | U =21.00, Z = -2.083, p = 0.037 | Analyser-imager < Non- analyser-imager | |
| HELP | Percent of task time | U =13.00, Z = -2.701, p = 0.007 | Analyser-imager > Non-analyser-imager |
Cognitive styles and specific types of interface objects
In this section, we report results of the impact of cognitive styles on all interface objects combined as well as individual visualisation objects. While imagers had more interactions or interests with all kinds of visualisation objects, analysers and analyser-imagers showed higher interests and noticeability on HELP objects.
Imagers versus non-imagers
Imagers were observed to have higher level of engagement with the ADS 2.0 interface than non-imagers. We came to this conclusion by evaluating the number of fixations, mouse clicks, total fixation duration, and gaze duration. We also observed multiple differences in the eye movement patterns exhibited by the two groups. Imagers were found to click significantly more on and visit IMG objects more frequently than the non-imagers group. Imagers also had longer total fixation durations and visit durations on ACT and TXT objects than non-imagers. Furthermore, imagers fixated more frequently on TXT objects compared to non-imagers. Table 6 contains all relevant results on the significant differences between imagers and non-imagers. These differences indicate that, with the exception of the HELP objects, imagers appeared to have more extensive gaze interests in the IMG, TXT and ACT objects, as well as all the visualisation objects combined on the ADS2.0 interface in contrast to the non-imagers.
| Objects | Metrics | Mann-Whitney U test results | Mean rank comparison |
|---|---|---|---|
| All objects | Fixation counts | U =22.00, Z =-2.089, p = 0.037 | Imagers > non-imagers |
| Mouse click counts | U = 23.50, Z = -1.976, p = 0.030 | Imagers > non-imagers | |
| Total fixation duration | U =13.00, Z =-2.773, p = 0.006 | Imagers > non-imagers | |
| Visit duration | U =19.00, Z =-2.317, p= 0.020 | Imagers > non-imagers | |
| IMG | Mouse click counts | U = 23.00, Z = -2.016, p = 0.044 | Imagers > non-imagers |
| Visit counts | U = 15.00, Z = -2.621, p = 0.009 | Imagers > non-imagers | |
| TXT | Total fixation duration | U = 15.00, Z = -2.773, p = 0.006 | Imagers > non-imagers |
| Fixation counts | U = 14.00, Z = -2.697, p = 0.007 | Imagers > non-imagers | |
| Visit duration | U = 19.00, Z = -2.317, p = 0.020 | Imagers > non-imagers | |
| ACT | Total fixation duration | U = 20.00, Z = -2.241, p = 0.025 | Imagers > non-imagers |
| Visit duration | U = 21.00, Z = -2.165, p = 0.030 | Imagers > non-imagers |
Analysers versus non-analysers
Overall, a smaller proportion of analysers fixated on interface objects compared to non-analysers. With regards to specific kinds of interface objects, there are two categories of differences separating analysers from non-analysers. For visualisation objects other than HELP, Analysers were found to have shown less interests in objects such as IMG, TXT or ACT than non-analysers. On the other hand, analysers were found to have noticed significantly more or shown greater interest in the HELP objects than non-analysers. A significantly lower percentage of analysers fixated or clicked on ACT. A lower proportion of analysers fixated on TXT objects, whereas non-analysers had the longer first fixation duration on IMG objects. However, a higher proportion of analysers fixated on HELP objects and had longer fixation duration on HELP than non-analysers. Table 7 provides the statistical results concerning the differences.
| Objects | Metrics | Mann-Whitney U test results | Mean rank comparison |
|---|---|---|---|
| All objects | Percentage fixated | U =22.00, Z = -2.117, p = 0.034 | Analysers < non-analysers |
| HELP | Percentage fixated | U = 22.50, Z = -2.156, p = 0.031 | Analysers > non-analysers |
| Fixation duration | U = 21.50, Z = -2.156, p = 0.031 | Analysers > non-analysers | |
| TXT | Percentage fixated | U = 19.00, Z = -2.343, p = 0.019 | Analysers < non-analysers |
| ACT | Percentage fixated | U = 23.00, Z = -2.041, p = 0.041 | Analysers < non-analysers |
| Percentage clicked | U = 18.00, Z = -2.419, p = 0.016 | Analysers < non-analysers | |
| IMG | First fixation duration | U = 21.00, Z = -2.193, p = 0.028 | Analysers < non-analysers |
Analytic-imagers versus non-analytic-imagers
In general, analytic-imagers participants had fewer fixations before fixating on interface objects than non- analytic-imagers. Similar to the differences between analysers and non-analysers, the comparison between analytic-imagers and non- analytic-imagers participants also revealed two primary differences. Analytic-imagers participants had longer fixation duration and visit duration to HELP objects, and also fixated longer on IMG objects than non-analytic-imagers. On the other hand, analytic-imagers participants were found to have fewer visits and shorter fixation duration on TXT or ACT objects than non- analytic-imagers participants. It took analytic-imagers a shorter amount of time to become fixated on TXT or ACT objects than non- analytic-imagers participants. Table 8 provides details on the significant Mann-Whitney U test results of analytic-imagers versus non- analytic-imagers on specific types of interface objects.
| Objects | Metrics | Mann-Whitney U test results | Mean rank comparison |
|---|---|---|---|
| All objects | Fixation before | U =21.00, Z = -2.117, p =0.034 | Analytic-imagers < non- analytic-imagers |
| HELP | Visit duration | U = 15.00, Z = -2.547, p = 0.011 | Analytic-imagers > non- analytic-imagers |
| Fixation duration | U = 15.00, Z = -2.509, p = 0.012 | Analytic-imagers > non- analytic-imagers | |
| IMG | Fixation duration | U = 19.00, Z = -2.237, p = 0.025 | Analytic-imagers > non-analytic-imagers |
| TXT | Time to first fixation | U = 20.00, Z = -2.160, p = 0.031 | Analytic-imagers < non-analytic-imagers |
| Fixation before | U = 11.00, Z = -2.855, p = 0.004 | Analytic-imagers < non-analytic-imagers | |
| ACT | Visit counts | U = 22.50, Z = -1.968, p = 0.049 | Analytic-imagers < non- analytic-imagers |
| Fixation before | U = 22.00, Z = -2.006, p = 0.045 | Analytic-imagers < non-analytic-imagers | |
| Time to first fixation | U = 21.00, Z = -2.083, p = 0.037 | Analytic-imagers < non-analytic-imagers |
Cognitive style and heat map patterns
Imagers versus non-imagers
Qualitative inspections of the heat-map graphs of imagers and non-imagers revealed that imagers had more intense fixations on the image/visualisation area of the screen than non-imagers. As shown through Figure 5, the heat maps of word cloud and author network for the imager group show a greater quantity of hot zones of gaze points surrounding the centre of both visualisations. Non-imagers exhibited were more scattered with limited heat points.
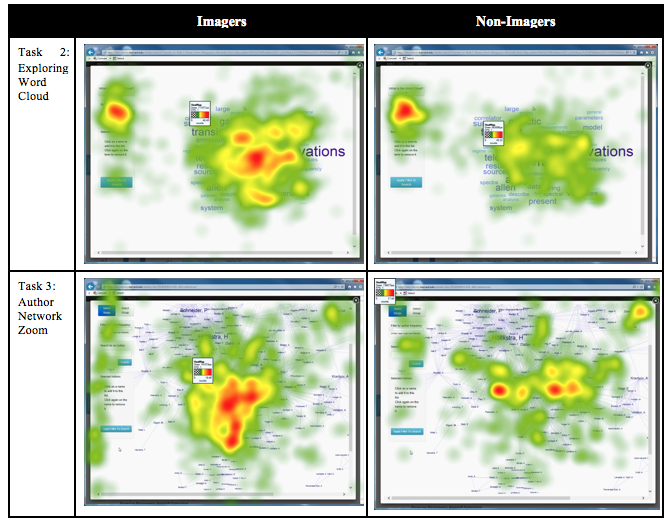
Figure 5: Imagers versus non-imagers in viewing ADS visualisations
Analysers versus non-analysers
Figure 6 includes two sets of heat maps and one set of gaze-plot graphs. Raw inspections of these graphs revealed that non-Analytic participants had more intensive fixation in wider areas of ACT and TXT objects on screens than Analytic participants (see the heat maps in the Task 1: Initial results screen row and the gaze-plots in the Task 5. Select paper network menu row of Figure 6). It is also evident that when participants read the help documentation about AUNet, the Analyser group read more intensively and horizontally than non-Analysers. Analysers appeared to read word-for-word of the instructional texts. However, non-analytic participants appeared to read the HELP texts in a vertical way (see the two heatmaps in the Task 3 Read HELP of AUNet row of Figure 6 below), focusing on the first few words of a sentence on the instruction sheet while skimming the rest of the sentence, and then quickly returning to the first few words of the next sentence.
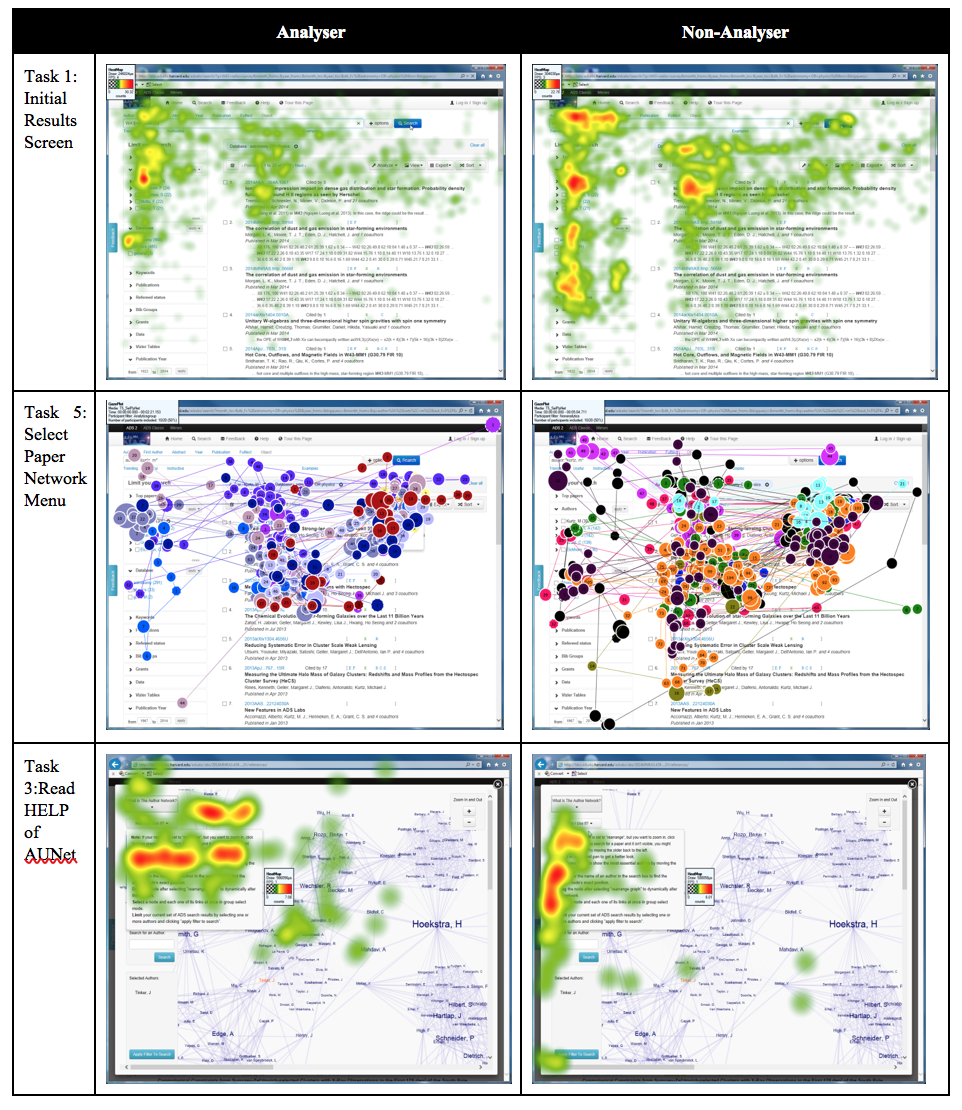
Figure 6: Analyser versus non-analyser in viewing ADS visualisations
Analyser-imager versus non-analyser-imager
Figure 7 contains heat maps of analyser-imager and non-analyser-imager participants when they performed various tasks. Figure 8 displays the heat maps of analyser-imagers only. Qualitative inspections of these heatmap graphs revealed that analyser-imager participants were less intensive in their viewing of ACT or TXT objects than the non-analyser-imager group.
From the first set of graphs in Figure 7, it is clear that non-analyser-imagers had more heated gazes on the search result screens than analyser-imagers. However, in comparing the heat map patterns of participants’ gaze over HELP objects, analyser-imager participants were more attentive than non-analyser-imagers. Furthermore, we observed an interesting pattern while analysing the heat maps (heat maps in the rows of Task 2: Help section from word cloud and Task 5: Paper network help, as well as in Figure 8 AI Task 2: Metrics help (AI only data) and AI Task 2: Author network help (AI only data)): analyser-imager participants fixated in a horizontal line-based path when reading instructions or help texts, whereas non- analyser-imager participants did not share the linear pattern. Instead, as shown through heatmaps such as Task 2: Help section from word cloud and Task 5: Paper network help, non-analyser-imager participants’ eye movement patterns showed that they were reading the HELP texts in a more vertical fashion.
The second and third sets of graphs show a strong linear reading pattern for analyser-imager participants. In Figure 8, the last set of graphs includes heat maps of analyser-imager participants only, as none of the non-analyser-imager participants viewed the HELP objects during that task. These two graphs in Figure 8 showed analyser-imager participants were reading HELP texts linearly. This pattern was also seen from analysers versus non-analysers charts as participants read the HELP text from AUNet (third set of graphs from Figure 7).
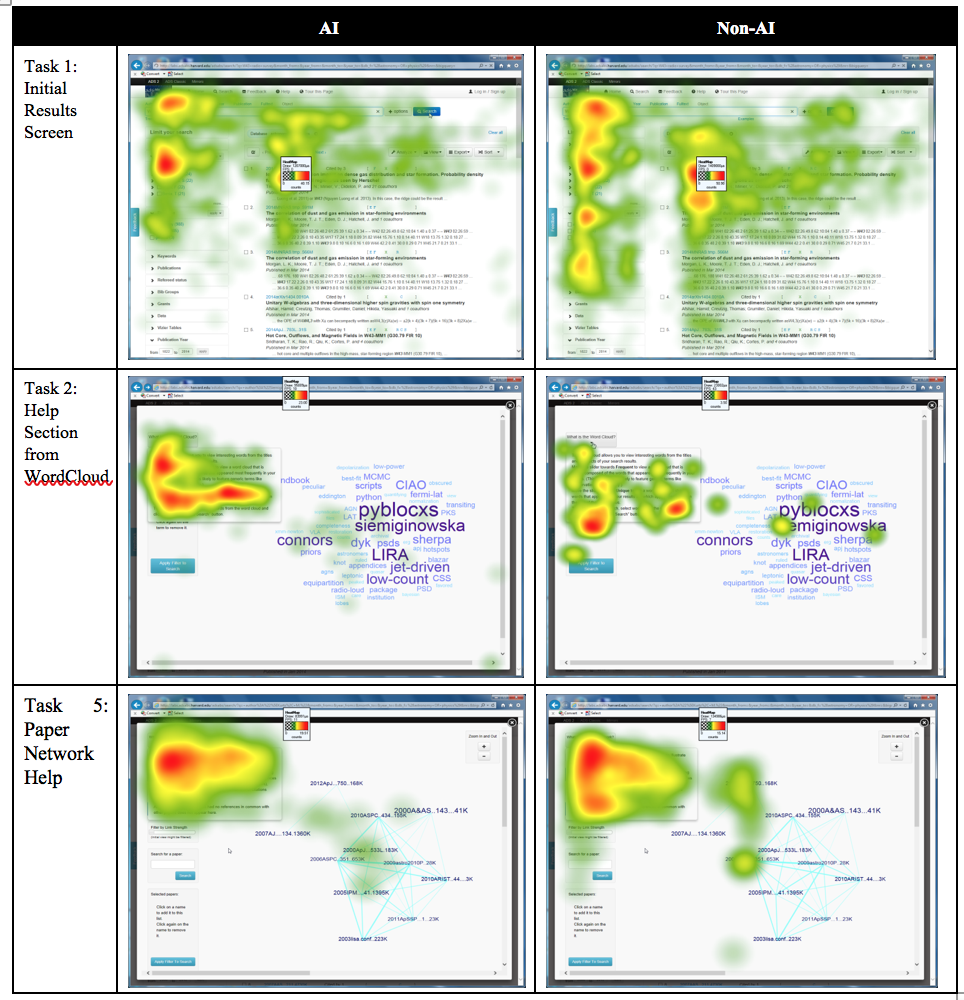
Figure 7: Analyser-imager versus non-analyser-imager participants in viewing ADS visualisations
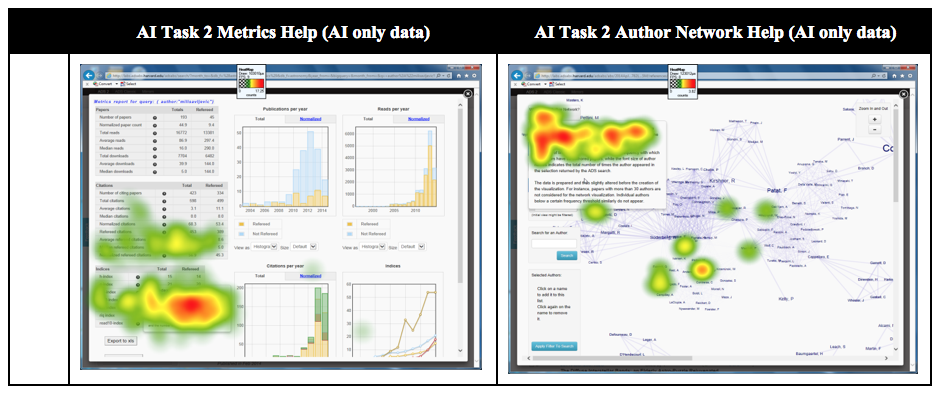
Figure 8: Analyser-imager participants viewing ADS visualisation HELP objects
As they reflected on their eye movements during the retrospective task analysis stage, participants explained particular actions. One participant (S02), an imager, explained why he was attracted to the chart area of the metrics visualisation without paying much attention to the left side table containing numbers and texts, commenting that,
I think that the first thing that drew my attention was the peak, where the peak was, and how high that was, I was trying to read the legend too…That is the first thing I did. I did not spend much time; well I am a visual person. That proves it. (S02)
Participant S20, another imager, described his thoughts as he reviewed his eye movements when looking at the author network visualisation graph. He noted that he paid greater attention to the centralized large clusters of authors instead of authors who scattered as the satellites. His comments not only explained why he was very attentive to the AUNet visualisation but also outlined his own interpretation of the patterns of the graph: he focused on authors in collaborative groups who share ideas and not so much on researchers who do their research by themselves in isolation. Below is the conversation between the researcher and the participant:
Researcher: So, are you looking at...
Participant: Yeah, so I guess I was, yeah, just sort of searching for [author] names. Trying to get a good feel for how to orient the chart and then looking for names that I recognized, looking for names that were standing out just visually.
Researcher: And, like this stuff over here [not at the centre but scattered as isolated individuals] has a clear list of authors’ names. I see that you are kind of not looking at it that much.
Participant: Yeah, um, I guess, so the way that I, that I, way that I interpret this anyway, you know, is in the centre are sort of more collaborative groups and on the edge are groups that don’t collaborate as much. They tend to work a little bit more in isolation. So, in terms of looking for someone to write a review of your paper, people that are sort of less locked into their own—trapped into their little cloud—sort of where there are a lot of ideas in the group. A lot more collaborative environment but not in terms of the immediate centre of the group... So, if there was a different, if I was maybe looking for something different, then I would try to get a sense of the literature and how it was related in general and then I might be paying more attention to the satellites. (S20)
A third imager (S10), explained when he spent time trying to figure out how the filter button works. Note that the quantitative results showed that imagers clicked on and visited significantly more frequently IMG objects than non-imagers, they also had longer total fixation duration and visit duration on ACT and TXT objects than non-Imagers. The following comments explained to some degree why an imager was fixated for a long duration on a particular ACT object:
Well, the logic seemed the opposite to me. It seemed clunky…The way it was by excluding, right, rather than including. I don’t know. Rather, once you know the way to do it, fine, then you can do it but, yeah, it was confusing. It seemed many options did the same thing. (S10)
Participants with other cognitive styles also commented on the characteristics of their own eye movements. An analyser (S08), described his initial difficulty in figuring out how paper network visualisation works:
Um, well, it took me a second to find out that you could scroll over and see the reasons why each paper was in the network. Um, but that happened pretty fast. It was pretty good.
Another participant (S07), a non-analyser, explained why his gaze points in reading an abstract did not follow a linear fashion:
So basically, if I look at it already then have a good sense what is written, like, after a few seconds. Then I need to reread it until the end…
As he was studying how to use the publication year filter, Participant (S06), a non-analyser-imager, pointed out how he focused on this ACT object to learn to use it:
OK, I want to see most recent ones...hmm... how to do this? Oh yeah, change from here. Yeah, it will be nice that you can just do it visually. Hmm... let's see...
These comments provided richer contextual and decision-making information for eye movement patterns as explained by participants themselves.
Discussion
With a rich set of eye-tracking data in connection with the results of participants’ cognitive style tests, this study uncovers a great deal of interesting eye movement patterns with regard to the Astrophysics Data System search interface. Our first research question centred on understanding the core users of the system by developing a cognitive style profile for each participant. It was discovered that core users had cognitive styles consistent with being either an imager or a bimodal person. Only one participant tested as a verbaliser. This consistency also manifested itself through the wholistic-analytic dimension, in that the majority of the participants were either an analytic or intermediate type of person. Only one participant tested as a wholistic type. In combining the two style dimensions, it was found that 70% of the participants had the analyser-imager or bimodal style, with six belonging to the other categories. With over half of the participants being identified as imagers, and exactly half of the participants being identified as analysers, the primary users are capable of both thinking in terms of diagrams and charts and focusing on specific details in scientific experiments and observations.
As discovered by Liu et al. (2017), participants with different levels of experience in using a search engine and search interface had different gaze patterns. Specifically, participants who had more frequent experience with search engines paid more attention to the author and MESH terms while paying less attention to the abstract. In this study, previous experience with ADS 2.0 also had an impact on the participants’ eye movement patterns. Participants who had previous experience with ADS 2.0 were found to be more efficient in their times to first click and first fixation in all interface objects or on IMG objects. They also had longer or more frequent fixations on IMG objects than people who were unfamiliar with the ADS 2.0 interface. These results make sense as people with past experience would be familiar with the interface design and visualisation objects and hence would take actions in less time. It is interesting how the experienced participants not only noticed IMG objects more quickly but also fixated more frequently and in longer duration on all visualisation objects and IMG objects. One explanation might be that with some familiarity of the visualisation design, experienced participants have already acquired a mental model of how ADS 2.0 works, providing them with additional confidence to explore and experiment with all objects while learning how they work. Participants without prior experience with ADS2.0 had not yet established a stable mental model and would be less inclined to experiment with unfamiliar screen elements.
In terms of cognitive style and eye movement patterns, Figure 9 presents an overview of various attractiveness measures and participants’ engagement with types of interface objects. The attractive measures of interest and noticeability were derived from Bojko (2013) (see Table 1 for details regarding the attractive measures). Imagers’ natural inclination towards IMG objects is understandable, but it is interesting that a higher percentage of imagers fixated on text and action buttons compared to non-imagers, as one would assume verbalisers or non-imagers would be more inclined to process TXT objects. One could also assume analysers would be interested in reading into the details of texts, as exhibited by Bojko’s interest measures, but it was found that analysers showed significantly less interest, or noticed fewer TXT or ACT objects, than non-analysers. It took analyser-imager participants shorter times or fewer fixations before they noticed the texts, but it does not suggest that analyser-imager participants were more interested in TXT objects than non-analyser-imagers. It is worth noting that analyser-imagers held both an imagery inclination and an analytic nature. They either very promptly took notice of objects such as ACT or TXT, or showed greater interest in objects such as IMG or HELP in contrast to their non-analyser-imager counterparts.
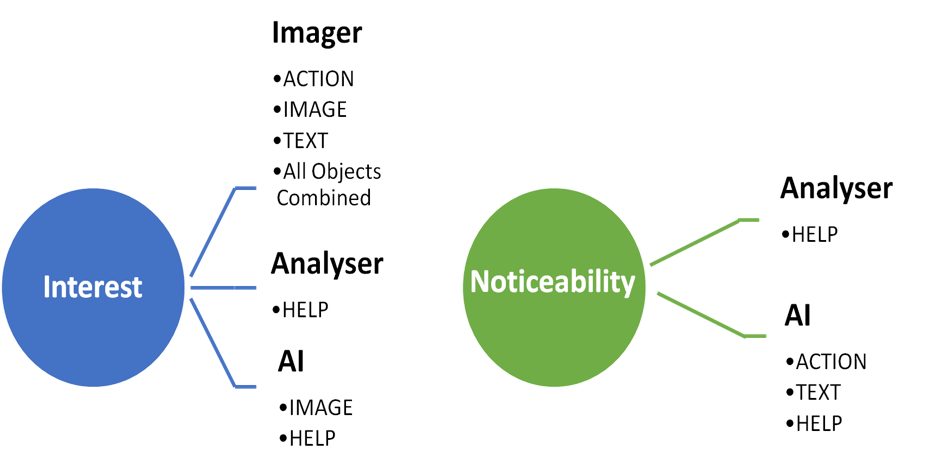
Figure 9: Cognitive styles and attractiveness measures by types of interface objects
Meanwhile, the fact that analyser-imagers or analysers were shown to have more interest in or noticed more HELP objects suggests that these participants were actively engaged in learning how things work with ADS 2.0 by reading the instructions. With analysers or analyser-imager participants relying heavily on HELP information to get them through tasks, HELP information would be more important to user populations that have a greater percentage of analyser or analyser-imager cognitive styles. Additionally, when reading HELP related pull-down texts, both analysers and analyser-imager participants presented horizontal fixation patterns. This might indicate that analyser or analyser-imager participants tend to read the HELP text closely in a word-for-word fashion whereas non-analyser-imager users tend to quickly scan the first line then fixate or gaze on the first word of the next line. Comments from participants also supported this observation. It would be worthwhile to explore whether upon reading the HELP texts closely, analysers or analyser-imager participants outperform those participants who scanned the same HELP texts.
Conclusion
Discovering the relationship between the cognitive styles of users of the Astrophysics Data System and their specific eye movement patterns has helped to inform future development of the system. The data-set is rich with over 4,000 fixations and 1,500 visits per participant; however, future studies should employ more participants for additional samples in each type of cognitive style. In addition to investigating questions specifically related to the interests and noticeability of participants with different cognitive styles on different types of interface objects, further qualitative-oriented analysis of participants’ think-aloud comments and non-verbal behaviour will help provide a fuller, more context-based understanding of the relationship between cognitive styles and eye movement, as reported in this paper.
The specific contributions of this research study include the identification of particular connections between scientists who were analysers and analyser-imagers and their noticeability of HELP objects. It was also revealed that scientists who were imagers were interested in not just IMG objects but also TXT and ACT objects. Nonetheless, they did not rely as much on HELP objects as did analysers. Overall, our findings revealed a rich set of insightful and unique patterns among ADS users’ cognitive styles and their eye movements on various interface objects. Cognitive styles had a significant impact on participants’ fixation and gaze movements. More nuanced differences were found between cognitive styles and the types of interface objects.
While it is fruitful to discover that imagers indeed had more interests in and noticed more IMG objects and that analysers focused on HELP objects, further research is needed on whether such a pattern holds true under different contexts with different information systems. Additionally, it would be useful to explore why imagers’ interests went beyond image objects and spanned across TXT and ACT objects. Why were imagers also interested in texts if by nature they process information from images rather than from texts? Was it because the ADS 2.0 TXT objects tended to be simple metadata level texts rather than longer texts?
At the same time, it makes sense that imagers were not significantly different from non-imagers in their attention to HELP objects as one may imagine they do not necessarily rely heavily on reading the instructions to understand how the interface works. They might be more inclined to watch video tutorials or other more image-driven HELP objects. However, it is puzzling that analysers did not show more interest in or take notice of TXT objects. This and several other questions raised earlier are worthwhile to pursue in further research studies.
With a fresh investigative angle on the impact of cognitive styles on astrophysicists’ interests in and noticeability of various visualisation objects, this research study has paved the way for new research efforts in examining the connection between cognitive styles and users’ gaze patterns or eye movements. Several specific findings, for example, the linkage found between analysers’ and analyser-imager’s interest in and noticeability of the HELP objects, should be re-affirmed through future studies that replicate the present study. The practical benefits of the study were quickly realised through revisions to the Astrophysics Data System along with a new design. The conceptual and scholarly contribution of this study lies in the attempt to tie users’ cognitive styles with attractiveness eye movement measures occurring when users view different types of interface objects. This area of research has great promise and warrants further research.
Acknowledgements
This research study would not have been possible without the generous support and coordination of SAO/NASA ADS Program Manager Dr Alberto Accomazzi. The authors also wish to thank Dr Michael Kurtz for his support and development of the eye tracking study task scenario. The authors’ gratitude is also extended to Christopher Erdmann, head librarian of Harvard University’s Wolbach Library during the time of this research study, for his support and help with recruiting participants and coordinating experiment space. This research work would not be possible without the diligent work of Jeremy Gillette, graduate research assistant, who took care of planning, scheduling, running, and moderating research sessions. Wenqing Lu, a research assistant, was also involved in data collection and recording sessions. The authors would also like to thank Matthew Young, for his hard work and assistance in data analysis and coding. Thanks also go to Steven Gentry, Will Gregg, and Michael Simpson for their edits of the revised version of the paper. Finally, the authors wish to thank all the participants, including the two pilot-test participants.
About the authors
Rong Tang is an Associate Professor at the School of Library and Information Science, Simmons College, 300 The Fenway, Boston, MA 02115-5898, USA. She holds a PhD in Information Science from University of North Carolina at Chapel Hill. Her research interests centre on information science scholarly discourse and user behaviour research, including cognitive styles and user experience, usability evaluation, collaborative user behaviour, and mobile user research. She is the founding and current Director of Simmons Usability Lab. She serves as the Director for External Relations, Association for Library and Information Science Education (ALISE) from 2017 to 2020. She can be contacted at rong.tang@simmons.edu.
Yeseul Song is currently a graduate student at New York University's Interactive Telecommunication Program, 721 Broadway, New York, NY 10003, USA. She holds a Master’s Degree in library and information science from School of Library and Information Science, Simmons College. Her research interests focus on users’ interactive experiences through blending the user, design, technology, and art. She can be contacted at yeseul.song@nyu.edu.
References
- Accomazzi, A., Kurtz, M. J., Henneken, E. A., Grant, C. S., Thompson, D., Luker, J., ... Murray, S. S. (2014). Introducing ADS 2.0. Poster session presented at American Astronomical Society Meeting, Washington, DC, January, 2014. Abstract only retrieved from http://labs.adsabs.harvard.edu/adsabs/abs/2014AAS...22325503A/ (Archived by WebCite® at http://www.webcitation.org/6ylxd1jZ3).
- Bieri, J. (1955). Cognitive complexity–simplicity and predictive behavior. Journal of Abnormal and Social Psychology, 51(2), 263–268.
- Bojko, A. (2013). Eye tracking the user experience: a practical guide to research. Brooklyn, NY: Rosenfeld.
- Bregman, J.N., Evans, A., Herter, T., Janes, K., Malkan, M., Nousek, J.A. ... Ulmer, M. (2008). NASA Astrophysics archival Senior Review Panel Report. Retrieved from https://smd-prod.s3.amazonaws.com/science-red/s3fs-public/atoms/files/ApArchSR-2008_final.pdf (Archived by WebCite® at http://www.webcitation.org/6ylyBsbxb).
- Chyla, R., Accomazzi, A., Holachek, A., Grant, C. S., Elliott, J., Henneken, E. A., ... & Sudilovsky, V. (2015). ADS 2.0: new architecture, API and services. In Andrew Russel Taylor & Erik Rosolowsky, (Eds.), Astronomical Data Analysis Software and Systems XXIV (ADASS XXIV) (Vol. 495, pp. 401-408). Retrieved from: http://www.aspbooks.org/a/volumes/article_details/?paper_id=37367 (Archived by WebCite® at http://www.webcitation.org/6zMSckBOB)
- Cressman, C., Singley, E., Perry, B. H. & Walsh, C. (2014). Usability final report: usability testing of ADS. Unpublished manuscript, School of Library and Information Science, Simmons College, Boston, MA, USA
- Danis, L., Corbett M. & Kurahashi, T. (2011). Usability final report: usability testing of ADS. Unpublished manuscript, School of Library and Information Science, Simmons College, Boston, MA.
- Duchowski, A. T. (2003). Eye tracking methodology: theory and practice. London: Springer-Verlag Ltd.
- Ehmke, C. & Wilson, S. (2007). Identifying web usability problems from eye-tracking data. In Tom Ormerod & Corina Sas (Eds.). Proceedings of the 21st British HCI Group Annual Conference on People and Computers: HCI... but not as we know it. 1, (pp. 119-128). Swindon, UK: BCS Learning & Development Ltd. Retrieved from: https://bcs.org/upload/pdf/ewic_hc07_lppaper12.pdf (Archived by WebCite® at http://www.webcitation.org/6zMTzLR43)
- Goldberg, J. H. & Kotval, X. P. (1999). Computer interface evaluation using eye movements: methods and constructs. International Journal of Industrial Ergonomics, 24(6), pp. 631-645.
- Graff, M. (2003). Cognitive style and attitudes towards using online learning and assessment methods. Electronic Journal of e-Learning, 1(1), pp. 21-28.
- Holmqvist, K., Nyström, M., Andersson, R., Dewhurst, R., Jarodzka, H. & Van de Weijer, J. (2011). Eye tracking: a comprehensive guide to methods and measures. Oxford: Oxford University Press.
- Ingwersen, P. (1996). Cognitive perspectives of information retrieval interaction: elements of cognitive IR theory. Journal of Documentation, 52(1), 3-50.
- Jacob, R. J. & Karn, K. S. (2003). Eye tracking in human-computer interaction and usability research: ready to deliver the promises. In R. Radach, J. Hyona & H. Deubel (Eds.). The mind’s eye: cognitive and applied aspects of eye movement research (pp. 573-605). Oxford: Elsevier Science BV.
- Kim, K. S. & Allen, B. (2002). Cognitive and task influences on web searching behavior. Journal of the American Society for Information Science and Technology, 53(2), 109-119.
- Kinley, K. & Tjondronegoro, D. W. (2010). The impact of users’ cognitive style on their navigational behaviors in web searching. In Falk Scholer, Andrew Trotman & Andrew Turpin, (Eds). Proceedings of 15th Australasian document computing symposium (ADCS) (pp. 68-75). Melbourne, Australia: School of Computer Science and IT, RMIT University. Retrieved from: https://eprints.qut.edu.au/39058/3/39058.pdf (Archived by WebCite® at http://www.webcitation.org/6zMU4ez1F)
- Leader, L. F. & Klein, J. D. (1996). The effects of search tool type and cognitive style on performance during hypermedia database searches. Educational Technology Research and Development, 44(2), 5-15.
- Liu, Y. H., Thomas, P., Bacic, M., Gedeon, T. & Li, X. (2017). Natural search user interfaces for complex biomedical search: an eye tracking study. Journal of the Australian Library and Information Association, 66(4), 364-381.
- Manhartsberger, M. & Zellhofer, N. (2005). Eye tracking in usability research: what users really see. In Holzinger, Andreas & Weidmann, Karl-Heinz. (Eds). Empowering Software Quality: How can Usability Engineering reach these goals? 1st Usability Symposium, (pp. 141-152). Vienna, Austria: The Austrian Computer Society (OCG). Retrieved from: http://www.usability.at/ueberuns/images/EyetrackinginUsability.pdf (Archived by WebCite® at http://www.webcitation.org/6zMUNQRyS)
- Messick, S. (1976). Personality consistencies in cognition and creativity, in S. Messick & Associates (Eds.), Individuality in learning (pp. 4-22). San Francisco, CA: Jossey-Bass.
- O'Brien, H. L., Dickinson, R. & Askin, N. (2017). A scoping review of individual differences in information seeking behavior and retrieval research between 2000 and 2015. Library & Information Science Research, 39(3), 244-254.
- Palmquist, R. A. & Kim, K. S. (2000). Cognitive style and on-line database search experience as predictors of web search performance. Journal of the American Society for Information Science, 51(6), 558-566.
- Park, Y. & Black, J. (2007). Identifying the impact of domain knowledge and cognitive style on web-based information search behavior. Journal of Educational Computing Research, 36(1), 15-37.
- Peterson, E. R. (2005). VERBAL imagery cognitive styles test & extended cognitive style analysis-wholistic analytic test administration guide. Edinburgh, UK: University of Edinburgh.
- Peterson, E. R., Deary, I. J. & Austin, E. J. (2003a). The reliability of the cognitive style analysis test. Personality and Individual Differences, 34(5), 881–891.
- Peterson, E. R., Deary, I. J. & Austin, E. J. (2003b). On the assessment of cognitive style: four red herrings. Personality and Individual Differences, 34(5), 899–904.
- Poole, A. & Ball, L. J. (2006). Eye tracking in HCI and usability research. In G. Claudi (Ed.), Encyclopedia of human computer interaction (pp. 211-219). Hershey, PA: Idea Group Inc.
- Prentice, J. & Guillette, J. (2012). Usability final report: usability testing of ADS. Unpublished manuscript, School of Library and Information Science, Simmons College, Boston, MA.
- Riding, R. (1991). Cognitive style analysis. Birmingham, UK: Learning and Training Technology.
- Riding, R. (1997). On the nature of cognitive style. Educational Psychology: An International Journal of Experimental Educational Psychology, 17(1-2), 29-49.
- Riding, R. & Cheema, I. (1991). Cognitive styles—an overview and integration, Educational Psychology, 11(3-4), 193–216.
- Riding, R. & Rayner, S. (1998). Cognitive styles and learning strategies: understanding style differences in learning and behaviour. London: David Fulton Publishers.
- Rotter, J. B. (1966). Generalized expectancies for internal versus external control of reinforcement. Psychological Monographs: General and Applied, 80(1), 1-28.
- Smithsonian Astrophysical Laboratory. (n.d.). About ADS. Retrieved from https://ui.adsabs.harvard.edu/about/ (Archived by WebCite® at http://www.webcitation.org/6yly3AQ1o).
- Tang, R. (2016). Cognitive styles, demographic attributes, task performance and affective experiences: an empirical investigation into Astrophysics Data System (ADS) core users. Journal of Library and Information Studies, 14(1), 1-23.
- Tobii AB. (2016). User manual — Tobii Studio version 3.4.5. Danderyd, Sweden: Tobii AB. Retrieved from https://www.tobiipro.com/siteassets/tobii-pro/user-manuals/tobii-pro-studio-user-manual.pdf (Archived by WebCite® at http://www.webcitation.org/6ylwfKYIN).
- Uruchrutu, E., MacKinnon, L. & Rist, R. (2005). User cognitive style and interface design for personal, adaptive learning. what to model? In Liliana Ardissono, Paul Brna & Antonija Mitrovic, (Eds.), Proceedings of User Modeling 2005 (pp.154-163). Berlin: Springer. (Lecture Notes in Computer Science, 3538).
- von Eye, V., He, X. & Hileman, W. (2011). Usability final report: usability testing of ADS. Unpublished manuscript, School of Library and Information Science, Simmons College, Boston, MA.
- Wilson, T. D. (1999). Models in information behaviour research. Journal of Documentation, 55(3), 249-270.
- Witkin, H.A., Moore, C.A., Goodenough, D.R. & Cox, P.W. (1977). Field-dependent and field independent cognitive styles and their educational implications. Review of Educational Research, 47(1), l-64.
- Wittek, P., Liu, Y. H., Darányi, S., Gedeon, T. & Lim, I. S. (2016). Risk and ambiguity in information seeking: eye gaze patterns reveal contextual behavior in dealing with uncertainty. Human Media Interaction, 7, Article 1790, 1-10. Retrieved from: https://www.frontiersin.org/articles/10.3389/fpsyg.2016.01790/full (Archived by WebCite® at http://www.webcitation.org/6zMUUznMy)
- Yecan, E. & Çağıltay, K. (2006). Cognitive styles and students' interaction with an instructional web-site: tracing users through eye-gaze. In Kinshuk, Rob Koper, Piet Kommers, Paul Kirschner, Demetrios G. Sampson & Wim Didderen, (Eds). Proceedings of 2006 advanced learning technologies, (pp. 340-342). Los Alamitos, CA: The IEEE Computer Society. Retrieved from: http://hci.metu.edu.tr/conference/ieee-2006.pdf (Archived by WebCite® at http://www.webcitation.org/6zMUDShh6)
- Yuan, X. & Liu, J. (2013). Relationship between cognitive styles and users' task performance in two information systems. In Jens-Erik Mai, (Ed.). Proceedings of the American Society for Information Science and Technology, (pp. 1-10). Hoboken, NJ: Wiley. Retrieved from: https://onlinelibrary.wiley.com/toc/15508390/50/1 (Archived by WebCite® at http://www.webcitation.org/6zMUHVtVm)
- Yuan, X., Zhang, X., Chen, C. & Avery, J. M. (2011). Seeking information with an information visualisation system: a study of cognitive styles. Information Research, 16(4), Paper 499. Retrieved from: http://www.informationr.net/ir/16-4/paper499.html (Archived by WebCite® at http://www.webcitation.org/6zMUYKYRe)
How to cite this paper
Appendix. Astrophysics Data System eye-tracking study - task scenario
Task 1. Search your own topic
To start, we’d like you to use ADS 2.0 to find articles relevant to a topic of your own interest. You are now at the ADS 2.0 Home Page. You can use this time to familiarize yourself with the interface, perform searches that you might normally perform in ADS Classic, or simply find articles that may be useful to your current or future research projects.
Task 2. Search your own publications
● Use ADS 2.0 to look up your own publications.
○ Should you prefer, you can look up the publications of another astronomer instead.
● On the results screen, does someone have the same name as you?
○ If yes, can this person be removed from a list of your publications?
● Have you ever seen or used a word cloud?
○ If a word cloud were to be generated from the results you see, what would you expect it to convey?
● Find and open the “Word Cloud” function. Explore the word cloud.
○ Recalculate the cloud by emphasizing the “Unique” and then the “Frequent” words.
○ Do the displays make sense to you in terms of your research work content?
● Go back to the results screen, find and open the “Metrics” function.
○ How many citations do you have?
○ How many normalized citations?
○ What is your riq?
○ Do these metrics make sense to you?
● Choose your most recent article and select the references. Using the “author network” view:
○ Can you find your collaborators?
○ Can you find other scholars in the field that you haven’t worked with?
Task 3. Identify common referees
Now imagine that you are an editor of the MNRAS The following two articles are submitted, and you want to use a single referee for both.
● Using the co-author graphs for both articles reference lists find two possible referees.
○ Hint: They will be prominent in both graphs.
❏ 2014MNRAS.439...48A Applegate, D.~E., von der Linden, A., Kelly, P.~L., et al. \mnras, 439, 48
❏ 2014MNRAS.439....2V von der Linden, A., Allen, M.~T., Applegate, D.~E., et al. \mnras, 439, 2
Task 4. Research productivity evaluation
Now imagine you are on the CalTech hiring committee for assistant professor. The following CalTech postdocs have applied:
❏ Konidaris, Nick
❏ Bellm, Eric
For this task we are assuming that these names are distinct enough that disambiguation is not an issue.
● Use the metrics page to evaluate these individuals. Please make sure to talk me through your evaluation process.
● Based on these metrics, who do you think is the more productive scholar?
● Whose work do you think holds greater scholarly impact?
Task 5. Kurtz’s research fields
Michael Kurtz works in two distinct fields.
● First search on his papers and then limit them from 2000 to present.
● Use the “paper network” view to find the two fields.
● How would you determine which distinct fields Michael works in?
● How would you go about finding the topics of the two clusters of work?