The development of tourism indicators through the use of social media data: the case of Minas Gerais, Brazil
Rafael Almeida de Oliveira and Renata Maria Abrantes Baracho.
Introduction. This research aims to study the development of tourism indicators in the Minas Gerais state (Brazil) by using social media data.
Method. To this end, we used a scraper to collect data from TripAdvisor, searching for key information about Minas Gerais tourist attractions and turning them into a structured database.
Analysis. Information was collected from a total of 1,384 attractions of 253 registered municipalities. However, these numbers were shortened to 235 attractions of forty-six municipalities considered for the analysis of the results because some of the attractions had a very small number of reviews, which would make it difficult to analyse quantitative information.
Results. It was possible to develop three indicators to monitor data inside TripAdvisor: number of reviews of Minas Gerais tourist attractions, average satisfaction in Minas Gerais tourist destinations and percentage of evaluations at less-evaluated destinations.
Conclusion. The results show that data from the platform can be used to develop and monitor indicators that aim to assist governmental decision-making processes.
Introduction
It is known that digital data is spread all over the Internet, making it difficult for organizations' and companies' managers to capture, treat and analyse them during the decision-making process. This data is often made available by social network users who review and post comments on products and services on Websites such as TripAdvisor.
The platform is described as the largest social network for the exchange of information on tourist destinations around the world. The Website users provide the data by evaluating tourism products and services both quantitatively and qualitatively and, therefore, they facilitate each other's choice of destinations and travel plans. According to the information on the website, TripAdvisor pages reached 390 million individual visitors per month in the first quarter of 2017, having 500 million appraisals, and over seven million registered views of many types of lodging, restaurants and attractions.
TripAdvisor and other travel assessment websites benefit from the content generated by tourists' need to disseminate information to a community (Munar and Jacobsen, 2013). These types of media are regarded as the most trusted social networking platform according to Internet users. The TripAdvisor example reinforces that the increased search for information during travel arrangements has become an important part of the tourist experience, where users need as much information as possible to support decision-making (Xiang, Magnani and Fesenmaier, 2015), turning travel review websites into an important planning tool. Such websites 'provide ideas, make decisions easier, add fun to the planning process and increase confidence by reducing risk and making it easier to imagine what places will be like' (Gretzel and Yoo, 2008, p. 44). This information gathering for tourist destinations allows tourism professionals from both the public and private sector to understand better the visitors' profiles, the type of information used to plan a trip, as well as with whom travellers share their experiences before, during and after the trip (Xiang, et al., 2015).
Monitoring tourism indicators becomes crucial for public managers and for the private sector tourism professionals who need evidence to assist decision makers in organizations. Because of the dynamic global economy and the appearance of new tendencies in the market as well as in tourists' profiles, it is of utmost importance to follow social media indicators more precisely (Dupeyras and Maccallum, 2013).
For instance, according to the Minas Gerais Transparency Portal in 2015, the Secretary of Tourism of the Minas Gerais state in Brazil accounted for only 0.02% of the state expenses, in which more than half of these expenditures were allocated to costs related to the secretary's own administration (such as payroll, hotel expenses, consumable goods). As a consequence, the resources that were used to carry out projects became insufficient for the preparation of larger and more detailed surveys.
Research results enable tourism professionals to evaluate the impact of the public sector's social programmes and projects and then to improve them based on these evaluations (Serapioni, 2016). The government should do this type of monitoring on a regular, timely and systemic basis. Moreover, one of the ways to carry this out is by building indicators that are 'useful for the timely management of government actions' (Cardoso Junior, 2015, p. 12), thus facilitating decision-making. Therefore, finding low-cost alternatives to collect data that help monitor the impact of actions in the tourism field becomes critical to the public sector.
One possible way of extracting digital data is to use tools called web scrapers or scraping (Vargiu and Urru, 2012). Besides being a technique to collect relevant information in an automated form of online data, the use of web scrapers can contribute directly to studies from areas of knowledge not initially related to programming (Marres and Weltevrede, 2013).
The overall objective of the study is to use social media data to develop indicators in Minas Gerais state (Brazil) to evaluate the efficacy of government tourism strategies. This study aims to determine if key indicators could be evaluated from the web scraper output and used in the formation of strategies to improve tourism in Minas Gerais. To do so, a web scraper was used with TripAdvisor, which permitted the capture and analysis of information in a clear way that could be used for developing and monitoring key indicators.
Once applied, this study will serve as a basis for tourism managers to facilitate monitoring indicators for the tourism activity based on Web social media data. The indicators will help plan more effective strategies aimed at improving service and visitors' satisfaction in tourist attractions and destinations in Minas Gerais. The use of a scraper for data extraction and information analysis contributes to the development of new monitoring methods and new information sources in tourism.
Literature review
Web data extraction
In times of a great build-up of information on digital platforms, organizations must handle the processes of extracting, preparing, analysing, understanding, managing and filing volumes of data on a regular basis (Stanton, 2012). Consequently, for the whole process to be well executed, we need the best data extraction possible, as it will affect all the following stages of the process.
Information shared on social media and the Internet have helped digital data extraction become a great tool that assists managers of companies and organizations during their decision-making process (Chen, Chiang and Storey, 2012; Devika and Surendran, 2013). For this reason, automated digital data extraction, especially from websites, has become a very frequently used technique (Marres and Weltevrede, 2013; Devika and Surendran, 2013).
There are several ways to extract digital information from websites, but three techniques stand out: web usage mining, semantic annotation and web scraping (Malik and Rizvi, 2011).
Web usage mining is a type of extraction that catches the information of access routes of users visiting the web sites (Malik and Rizvi, 2011). The main idea is to discover usage patterns from web data to improve web applications (Srivastava, Cooley, Deshpande and Tan, 2000).
The semantic annotation makes it possible to add formal structures to unstructured textual documents, creating semantic meanings for words, data, metadata and more between different files (Malik and Rizvi, 2011; Uren et al., 2006). Machines use semantic Web annotations to identify concepts and relationships between documents (Uren et al., 2006).
The third method for extracting data from websites is the technique named Web scraping, or simply scraping. This technique allows non-structured web data, often in HTML format, to be transformed into a well-structured database that can be analysed (Vargiu and Urru, 2012).
Pages from a particular website usually have templates that are similar to each other and may share data in a standardised way. As scraping relies on information structures such as website templates, this technique is the easiest way to collect and analyse this kind of data (Marres and Weltevrede, 2013).
According to Devika and Surendran (2013, p. 278), 'web data extraction is the reverse process of page generation'. Marres and Weltevrede (2013, p. 318) state that the scraping process is composed of:
a series of steps in which formatted data are extracted out of an informational mess. To scrape is to build a chain from the relatively unformed mass of online data to formatted information, and along this chain relatively raw textual data are progressively stripped of its useless elements and formatted so as to produce a well-ordered, useable data set.
The authors still reinforce that the scraping process has become essential for research related to social behaviour and that it is increasingly being used in the social sciences. The use of scraping tools can expand the Internet's sociological potential from the moment that the data inserted in greater online platforms such as Facebook, Twitter and Wikipedia can be analysed (Marres and Weltevrede, 2013).
Therefore, the web scraping technique enables researchers to analyse the information produced by users of digital platforms. As a consequence, understanding users' behaviour may help resolve several issues dealt with daily by researchers and organizations from different areas, such as tourism.
Tourism in the digital era
It is worth saying that tourism has always been seen as a social fulfilment activity. In the same way that postcards and letters were used to exchange information about trips, digital media and social networks are transforming how travellers share information with each other (Munar and Jacobsen, 2013). Since the 1990s, the tourism sector has adopted the Internet as a new channel to distribute services and to advertise. The relationship between service providers and their clients has improved over time until it reached social networks, which enabled interaction between them, as well as the exchange of opinions among individuals online, thus getting the attention of companies and organizations (Xiang, et al., 2015).
The exchange of information among users on social network websites enabled the creation of the term eWOM (electronic word of mouth), where recommendations from acquaintances or strangers end up influencing the users' choice of their travel destinations (Gretzel and Yoo, 2008). The authors also affirm that, 'as the use of the Internet for travel planning becomes ever more prevalent, travel decision-making processes are expected to become increasingly influenced by eWOM' (p. 36).
In this context, the search for information while planning a trip became an essential part of the tourist's experience, from which they need the greatest amount of information to help them make decisions (Xiang, et al., 2015). Therefore, websites where people evaluate travel destinations became an important planning tool, as they 'provide ideas, make decisions easier, add fun to the planning process and increase confidence by reducing risk and making it easier to imagine what places will be like' (Gretzel and Yoo, 2008, p.44).
Once travellers start to review destinations and companies' profiles on evaluation Websites by sharing their opinions and comments, they are encouraged by companies to rank them on these online platforms. This way, eWOM happens more effectively, bringing more clients to establishments (Gretzel and Yoo, 2008) and enhancing competitiveness among tourist destinations.
Travel assessment on the web: the TripAdvisor example
TripAdvisor and other websites designed to assess travel experiences benefit from the Internet-based content created by users (such as comments, ratings, photos and videos) who need to share information with a community. This kind of medium is the most trustworthy social network platform among users (Munar and Jacobsen, 2013; Limberger, Anjos, Meira and Anjos, 2014).
The interaction among users on TripAdvisor generates a large database about tourist attractions and destinations, turning the website into a benchmark for information on the Web. The users' comments and opinions on TripAdvisor not only have quantitative elements (ranking positions, ratings, numbers of comments, etc.) but also qualitative information, allowing the owner of an establishment, for instance, to identify what clients are saying about their business and, in case of receiving a negative review, to correct their flaws in a faster and more efficient way (Torres, 2013). Therefore, if these clients' reviews are processed efficiently, it enables companies to improve the quality of their products and services, turning that information into a great asset for the people who manage it (Torres, 2013).
With a view of building collaborative content, the website users register the tourist attractions from each destination and share them according to pre-selected categories, enabling people interested in a particular type of attraction (e.g., a museum) to search for information through filters.
On TripAdvisor, the user who is interested in registering an attraction must fill in a form with information about the place, as well as classify it according to what kind of attraction it is from a limited number of options (e.g., a water park, a square, a church, etc.). Besides, the user may answer a set of thirty-six questions by clicking on yes, no or not sure to help the website to promote the attraction more precisely, according to the user's interest. Some of these questions are: Are animals involved in this attraction?, Is this location good for couples?, Is it a good place for lunch / dinner?, Is it free of social charge?.
To rate an attraction, users must rank it according to their satisfaction, from 1 to 5 (meaning, 1 = terrible, 2 = poor, 3 = average, 4 = very good, 5 = excellent). They may also write a comment, answer questions related to what type of visit it was (couples, families, friends, business or solo) and when they visited the location (choosing one among the last twelve months from the current year). It is also possible to write on the form how long they recommend the visit to last, apart from answering yes, no or not sure to some questions (the same way it is done while registering an attraction) and upload photos.
At the end of the evaluation process, users must confirm that their assessment was based on their own experience and that the questions were answered sincerely, without having any personal or commercial relations with the location evaluated. This way, it is expected that the establishments cannot hire people to write positive reviews on the website to increase the ranking position of the place. Therefore, TripAdvisor reinforces that all comments and reviews must be written according to the visitor's personal experience, avoiding the manipulation of opinions.
The use of indicators in tourism
The development of indicators is essential for monitoring actions from a specific programme or project. It is difficult for managers to have enough periodic and particular information about implementation and achievement of results during programme and project follow-ups (Jannuzzi, 2015).
Indicators enable the formulation and evaluation of public policies. It is of utmost importance that state and federal research bodies invest in the building of elaborate indicators and encourage managers to use them as a management tool (Pereira and Pinto, 2012, p. 365).
Advances in information systems and technologies shaped a brand new information society, as well as contributed directly to an increase in the use of indicators from databases.
Data, once forgotten inside cupboards and filing cabinets, starts to move through the Internet and becomes well-structured information for analysis and decision-making. Statistical data that used to be inaccessible in huge digital files start to be 'customised' as tables, maps and quantitative models built by non-specialised users (Jannuzzi, 2015, p. 138 (own translation)).
Measuring impacts in tourism is a very challenging task. It is usually one of the main activities for the development of many countries, as it facilitates the increase of revenues, number of jobs and the revitalisation of several areas (Dupeyras and MacCallum, 2013). Creating statistics and indicators about a particular activity may determine the direct impacts in the economy of a tourist destination. It may also help to plan new products, understand the visitors' profiles and assist in promotion and marketing strategies (Viegas, 1997).
Understanding visitor behaviour is fundamental for the creation of tourism development actions and for evaluating the destination's competitiveness (Dwyer and Kim, 2003; Dupeyras and MacCallum, 2013). The indicators are vital for this evaluation.
In 2008 the United Nations World Tourism organization (UNWTO), the international organization responsible for standardising guidelines for the sector, produced a manual of recommendations for the definition of indicators to guide countries and regions on the creation of statistics for tourism. The indicators are divided into two categories: demand perspective and supply perspective. Among the main indicators of the demand perspective are the flows of visitors, characteristics of the visitor and trips and tourism expenditure. The supply perspective indicators focus on the number of services and products and employment in the tourism industries (United Nations, 2010). To collect data and monitor these indicators, the UNWTO recommends conducting surveys and using integration systems, such as hosting systems, without mentioning the use of alternative collection methods, like scrapers.
The evolution of digital media has made capturing data on tourist activities an essential part of understanding customers' behaviour and levels of satisfaction. Digital content is widely available, changing what was an individual experience into knowledge shared in several databases. Nowadays, this information can be monitored and analysed by private or public companies or organizations (Munar and Jacobsen, 2013). In addition, analysing virtual platform data from user feedback makes it possible to approximate the demands of a particular group of the population within the public sector. And as a consequence, it makes public sector actions more transparent to society (Scott and Orlikowski, 2012).
Generally speaking, the networks that surround travellers while planning their holidays capture and generate a huge volume of information, thus creating opportunities and challenges for tourism. The mapping of information for tourist destinations:
allow professionals…to understand better how and where real and potential visitors live, the nature of the information they use to plan a trip, as well as with whom travellers share their experiences before, during and after the trip (Xiang, et al., 2015, p. 524).
For tourism, the development of indicators from modern contexts of technological innovation and relationships among people on online platforms may serve as a means of monitoring public policy, thus facilitating decision-making and focusing efforts to improve projects directed towards the sector. For this purpose, it is crucial that the indicators proposed can be developed in a clear and transparent way, increasing its legitimacy as a management tool (Jannuzzi, 2015).
Methods
This study dealt with the extraction of information, as well as data handling, to elaborate indicators quantitatively (Gil, 2002; Teixeira, 2003) based on the demand perspective (United Nations, 2010), and with the census information of Minas Gerais attractions and destinations registered on TripAdvisor. Because tourism data on TripAdvisor are provided by visitors - that is, by the tourist demand itself - working with supply perspectives indicators was not considered. It should be emphasised that the proposal of this method focuses on the elaboration of indicators that may complement data monitoring in the demand's perspective, based on UNWTO general guidelines, and is not meant to replace existing indicators that are collected in traditional ways. Since data collection from social networks is a recent phenomenon, it becomes relevant to study the feasibility of developing and monitoring new forms of indicators.
The process of developing indicators was as follows:
- Data extraction from TripAdvisor;
- Descriptive analysis of the results from the information collected;
- Selection of the most relevant results for the development of indicators;
- Elaboration of technical files with details of each indicator;
- Monitoring of indicators and evaluation of implementation feasibility.
A web scraper called import.io was used to collect users' comments and ratings posted on TripAdvisor about Minas Gerais tourist attractions and destinations. It enabled the transformation of HTML pages on TripAdvisor into well-structured data that could be managed from electronic spreadsheets (Vargiu and Urru, 2013).The extractions were done in three sessions. The first one was on 12 July 2016, on which a descriptive analysis was based. The second extraction was done nearly a year after the first results came out, on 17 July 2017. Finally, the last one happened on 18 July 2018, and focused on monitoring the indicators generated.
The results were evaluated at the exploratory level to describe and explain the phenomena encountered for decision makers. The proposed indicators were not intended to work at the predictive level and did not propose goals or future scenarios. The summary of the method is shown in Figure 1.
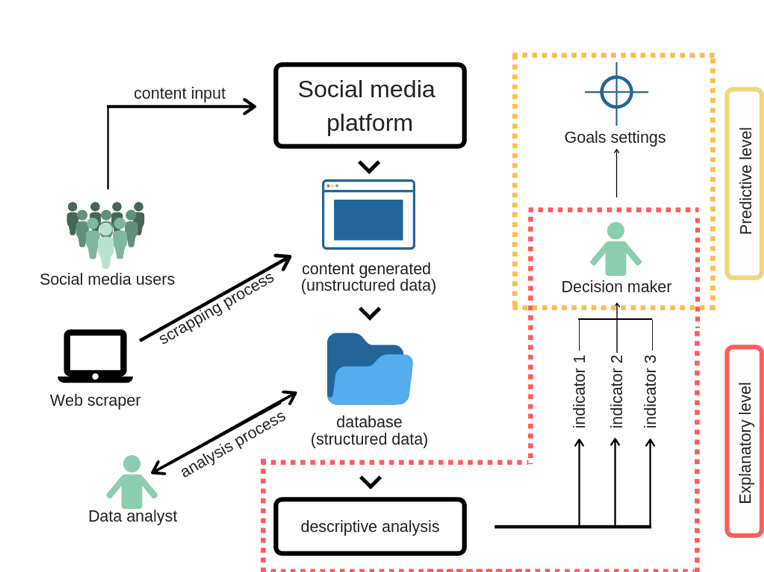
Figure 1: Diagram of the proposed method
The steps for the data collection and organization using the import.io tool, as well as the method for the elaboration of indicators, are discussed below.
Data collection
The data extraction was done with import.io in its server-based version because it allowed free extraction of up to 10,000 individual pages (or URLs) per month, which was enough for this research.
It was necessary to create two extractors to collect data. The first one collected selected information from the destinations pages on TripAdvisor, starting from a model page. The second indicator focused on extracting all URLs of Minas Gerais attractions to feed the first extractor, enabling it to collect all selected information from all Minas Gerais tourist attraction pages. The creation of these two extractors is detailed as follows.
Extraction 1
The selected information for the capture was highlighted as numbered in Figure 2 and listed as: attraction name (1), municipality (2), attraction category (3), number of ratings by ranges of satisfaction - excellent (4), very good (5), average (6), poor (7), terrible (8), motivation for visiting the attraction - family (9), couple (10), solo (11), business (12) or friends (13), and the travel season - March to May (14), June to August (15), September to November (16) and December to February (17).
It is important to note that, as shown in Figure 2 (see item 3), TripAdvisor allows viewing more than one option of the attraction categorisation (in the example, Praça da Liberdade is categorised as points of interest & landmarks and sights & landmarks). However, it was noticed in some tests before the final extraction that the first classification shown on the page considered the most significant one to classify the attraction, as the second category is seen as more general than the first, and the third one is even more generalised than the second and so on. Therefore, it was preferable to extract only the first category.
Another point highlighted in Figure 2 refers to the numbers between 4 and 17. The number of ratings displayed on the site is related to the comments filtered by the language used by the traveller, which in this case was Portuguese (as mentioned in item 18).
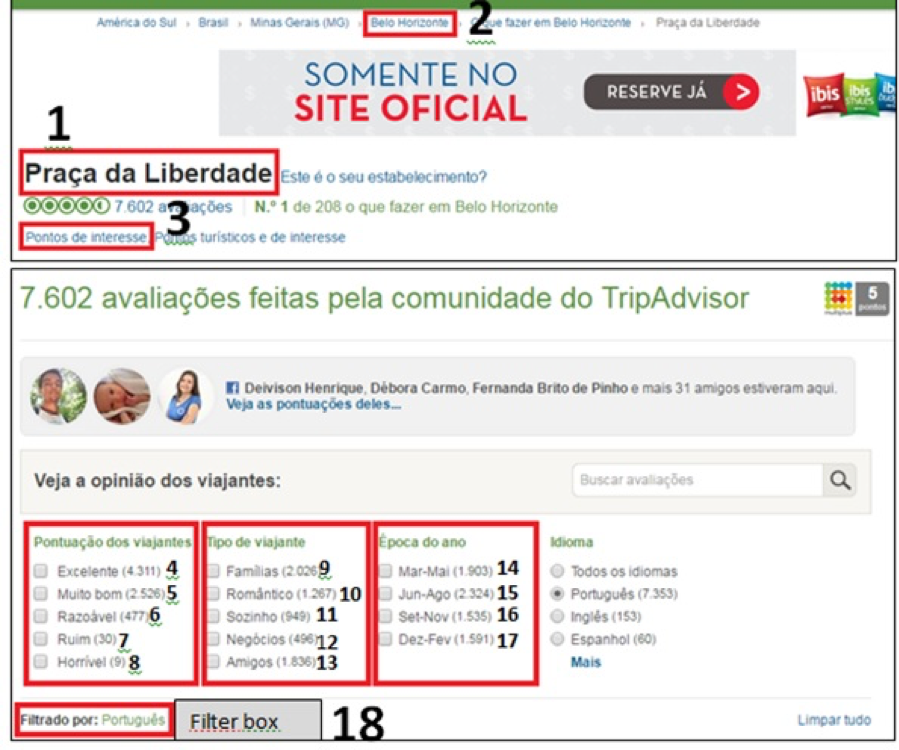
Figure 2: Selected information for extraction on TripAdvisor
This step taught the extraction tool how to collect the information selected from any page about tourist attractions on TripAdvisor. Next, it was necessary to create another extractor to collect the URLs that would be used in the first one to gather the information not only from one model page, but also from all Minas Gerais attractions.
Extraction 2
Figure 3 shows that each URL of a certain municipality on TripAdvisor has the basic information list of all the attractions of that place, and the information with the name of the attraction can be accessed by a link leading to the attraction's page.
The same figure shows that, on the Belo Horizonte page, users can click on names of attractions to access that attraction's page. In this case, it was necessary to create an extractor from the Belo Horizonte model page that retrieved only the URLs from the titles of the attractions. Next, the information from the titles was transformed into URLs as shown below, with each page on the list displaying a maximum of thirty attractions:
- Praça da Liberdade =
https://www.tripadvisor.com.br/Attraction_Review-g303374-d1534424-Reviews-Praca_da_Liberdade-Belo_Horizonte_State_of_Minas_Gerais.html - Mercado Central de Belo Horizonte =
https://www.tripadvisor.com.br/Attraction_Review-g303374-d1534420-Reviews-Mercado_Central_de_Belo_Horizonte-Belo_Horizonte_State_of_Minas_Gerais.html - Memorial Minas Gerais Vale =
https://www.tripadvisor.com.br/Attraction_Review-g303374-d2360286-Reviews-Memorial_Minas_Gerais_Vale-Belo_Horizonte_State_of_Minas_Gerais.html - ...Attraction N30 = URL_attraction_N30
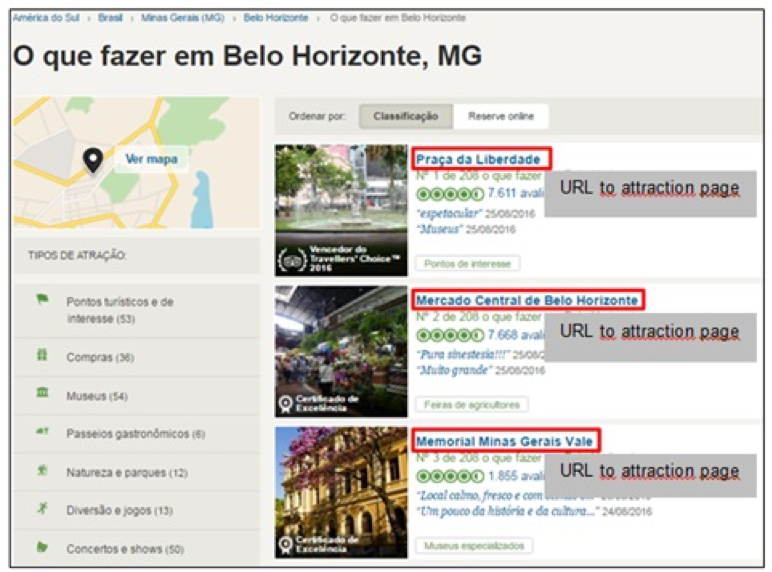
Figure 3: Page What to do in Belo Horizonte
The other URLs of Minas Gerais municipalities were found in the page called What to do in Minas Gerais and also in the more link on the same page. Thus, it allowed the download of a file in a spreadsheet format containing the addresses of all 1,482 URLs of Minas Gerais tourist attractions registered on TripAdvisor.
Next, all URLs from extractor 2 were copied to extractor 1, permitting the extraction of the information selected during the first stage for all Minas Gerais tourist attractions.
Database organization
In total, data were collected from 1,482 URLs, of which ninety-eight (6.6%) were disregarded since they were URLs of groups of attractions or services (and not a single attraction or service), used to redirect the user to other attraction pages.
Thus, a total of 1,384 attractions from 253 registered municipalities were considered for the creation of the database. However, some of the attractions had a very small number of reviews, making it difficult to analyse quantitative information. Therefore, it was decided to make a cut in the number of attractions from the total number of evaluations of each one (sum of the evaluations – excellent, very good, average, poor or terrible). To make this cut, the average of the number of evaluations was calculated. The result showed that, on average, each attraction had 106 evaluations and therefore, only those that had a number equal to or above this average were considered.
After this cut, 235 attractions from forty-six municipalities were considered for the analysis of the results, that is, 17% of the number of attractions and 18% of the municipalities initially extracted.
To evaluate each attraction it was necessary to sum the absolute values of visitors' satisfaction (in the fields excellent, very good, average, poor, terrible), visitors' profile (family, couples, solo, business, friends) and the visitation period (Mar-May, Jun-Aug, Sep-Nov, Dec-Feb).
The average score of each destination was calculated relative to visitor satisfaction. To obtain this, for each evaluation in the excellent field, a grade 5 was assigned, a grade 4 for very good, a grade 3 for average, a grade 2 for poor and a grade 1 for . Then, all values were summed, and the results divided by the total of the evaluations, reaching the average value of the evaluation for each attraction or destination, always in the range of 1 to 5, with 1 being the minimum value and 5 the maximum value.
The development of indicators
After a descriptive analysis of the results, three indicators were proposed, focused on measuring the attractions performance based on the quantity of reviews and the connection between the attractions and the visitors' satisfaction level.
The construction of technical files for each indicator was adapted from the method used by the Minas Gerais government in the construction of the Indicators Notebook, which was a printed publication in 2011 and was transformed into an interactive data-monitoring site in 2013. The purpose of the publication was to 'present state public policy performance indicators' (Minas Gerais, 2011), which listed 108 indicators from different areas that were described in eighty technical data sheets. None of the 108 indicators suggested had data collected from social networks as the source of information.
The attributes used in the technical file of each indicator were (Minas Gerais, 2011):
- Title: indicator's name;
- Description: indicator's simple translation that describes or conceptualises all its variables;
- Calculation formula: mathematical formula with adequate translation of each term used;
- Polarity: desired direction for the measure concerned. To increase measures, 'larger better' and to decrease measures, 'smaller better';
- Application: justification for the choice of the indicator, what it measures and the way it is used, as well as its specificities;
- Limits and limitations: they refer to the use of the indicator and to the restrictions on its application.
Moreover, the reference values observed during the first extraction in 2016 were added, as well as the values monitored for the indicators observed during 2017 and 2018.
As tourism is seasonal, data monitoring should happen annually. It is believed that this interval is the most suitable for the monitoring of the Minas Gerais attractions as a whole.
Results
The methods presented in this study allowed the collection of information of each attraction selected in Excel. It was possible to identify:
- The offer of attractions by municipality and by attraction's category (museums, churches, malls, etc.);
- The tourist attractions, municipalities and categories with the highest number of absolute evaluations, the average of grades, besides the percentage of evaluations by range of satisfaction (excellent, very good, etc.);
- The visitors' profile for each municipality, attraction and category (family, solo, business, etc.)
- The most relevant period of visitation of each municipality, attraction and category.
Offer of attractions
Among the sample of attractions shown below, the results showed that the main attractions and destinations in Minas Gerais registered on TripAdvisor were divided into fifty-three categories. The main classification can be seen in Table 1.
| Category | Entries (%) | N |
|---|---|---|
| Point of interest | 13.62 | 32 |
| Churches and cathedrals | 13.19 | 31 |
| Specialized museums | 10.64 | 25 |
| Architectural works | 6.38 | 15 |
| Other outdoor activities | 4.68 | 11 |
| Parks | 4.26 | 10 |
| Souvenir and specialized stores | 3.40 | 8 |
| Sites with wildlife and nature | 2.5 | 6 |
| Waterfalls | 2.55 | 6 |
| Shopping malls | 2.55 | 6 |
| Theatres | 2.55 | 6 |
| Hiking paths | 2.55 | 6 |
| Caves and caverns | 2.13 | 5 |
| History museums | 2.13 | 5 |
| Near water points | 2.13 | 5 |
| Others | 24.68 | 58 |
| Total | 100.00 | 235 |
As users are allowed to categorise the attractions and the extraction was done only with the first highlighted category on the website, for a state analysis, some attractions could be categorised differently, as in the case of Itacolomi State Park. In the extraction, the attraction was categorised as sites with wildlife and nature, but there were also the category parks and even state parks. This factor could hamper TripAdvisor users when searching the website for information from categories, by failing to report on relevant attractions that had been categorised incoherently. Taking this into consideration, it is suggested that the analysis performed from category filters be carefully evaluated as they are treated as full information for the state.
Evaluations
The extracted data allowed analyse of the percentage of evaluations by municipalities and by satisfaction ranges, summarised in an average grade. Table 2 shows the results for the municipality of Mariana:
| Categories and attractions | Evaluations (%) | N | Excellent (%) | V. good (%) | Average (%) | Poor (%) | Terrible (%) | Grade |
|---|---|---|---|---|---|---|---|---|
| Churches and cathedrals | 31.98 | 747 | 43.01 | 45.03 | 10.04 | 0.98 | 0.94 | 4.28 |
| Basilica de Sao Pedro dos Clerigos | 23.83 | 178 | 42.70 | 45.51 | 9.55 | 1.12 | 1.12 | 4.28 |
| Catedral Basilica da Se | 33.07 | 247 | 43.72 | 45.34 | 8.91 | 1.21 | 0.81 | 4.30 |
| Centro Historico de Mariana | 26.37 | 197 | 41.62 | 43.65 | 13.71 | 0.00 | 1.02 | 4.25 |
| Igreja N S do Carmo – Mariana | 16.73 | 125 | 44.00 | 45.60 | 8.00 | 1.60 | 0.80 | 4.30 |
| Mines | 34.16 | 798 | 43.61 | 39.85 | 13.16 | 2.76 | 0.63 | 4.23 |
| Minas da Passagem | 100.00 | 798 | 43.61 | 39.85 | 13.16 | 2.76 | 0.63 | 4.23 |
| History museums | 7.06 | 165 | 22.42 | 49.70 | 26.06 | 1.82 | 0.00 | 3.93 |
| Casa de Camara e Cadeia | 100.00 | 165 | 22.42 | 49.70 | 26.06 | 1.82 | 0.00 | 3.93 |
| Train tours with landscape | 10.19 | 238 | 42.86 | 37.39 | 14.29 | 3.36 | 2.10 | 4.16 |
| Maria Fumaca - Ouro Preto | 100.00 | 238 | 42.86 | 37.39 | 14.29 | 3.36 | 2.10 | 4.16 |
| Points of interest | 16.61 | 388 | 45.62 | 42.08 | 11.25 | 0.61 | 0.43 | 4.32 |
| Praca Gomes Freire | 29.90 | 116 | 37.93 | 44.83 | 15.52 | 0.86 | 0.86 | 4.18 |
| Praca Minas Gerais | 70.10 | 272 | 53.31 | 39.34 | 6.99 | 0.37 | 0.00 | 4.46 |
| Mariana (Total) | 100.00 | 2336 | 41.35 | 43.47 | 12.91 | 1.46 | 0.82 | 4.23 |
From the data presented, it can be seen that the category mines represents 34.16% of the total evaluations of the attractions presented. The category churches and cathedrals represents 31.98% of all evaluations. Within this category, it is possible to observe that Catedral Basilica da Sé has the highest number of evaluations compared to other churches (33.07%). It is also possible to observe that from all Mariana's attractions, the highest satisfaction mark was reached by Praça Minas Gerais (4.46) and the lowest by the historical museum Casa de Câmara e Candeia (3.93).
Visitors' profiles
Table 3 shows the most visited categories for each type of visitor profile.
| Categories | Family (%) | N |
|---|---|---|
| Theme parks | 68.7 | 632 |
| Gardens | 64.5 | 294 |
| Entertainment and game centres | 63.1 | 89 |
| Aquariums | 57.8 | 74 |
| Science museums | 54.2 | 193 |
| Categories | Couple (%) | N |
| Off-road excursions, quadricycle and 4WD | 66.8 | 155 |
| Canyoneering and abseiling | 63.8 | 261 |
| Dams | 63.3 | 105 |
| Hiking paths | 57.2 | 2566 |
| Nature and wildlife excursions | 48.4 | 44 |
| Categories | Friends (%) | N |
| Arenas and stadiums | 46.8 | 1390 |
| Farmers' markets | 42.0 | 1891 |
| Observations sets | 41.0 | 241 |
| Outdoor activities | 36.4 | 72 |
| National Parks | 34.5 | 57 |
| Categories | Solo (%) | N |
| Libraries | 28.3 | 32 |
| Farmers' markets | 17.6 | 791 |
| Observatories and planetariums | 17.0 | 44 |
| Shopping malls | 16.7 | 249 |
| Religious and sacred sites | 15.6 | 12 |
| Categories | Business (%) | N |
| Conference and convenience centres | 27.8 | 62 |
| Without identification (Minascentro) | 25.7 | 58 |
| Theatres | 11.4 | 145 |
| Religious and sacred sites | 10.4 | 8 |
| Shopping malls | 10.1 | 161 |
Concerning families, the categories with the highest number of evaluations were intended for places with large flow of people or related to entertainment and areas of knowledge such as theme parks, entertainment and game centres, aquariums and science museums. On the other hand, the most valued categories for couple profiles are characterised by attractions among nature and adventure sports usually offered in cities suitable for honeymoons. In the friends category, the highlights were for outdoor or event-focused attractions, such as stadiums or national parks that feature camping areas with a young audience. In the case of single people, the highlights were for libraries, shopping or soul-searching. As for business-motivated individuals, the highlighted categories were related to places of events and exhibitions, or possible leisure activities that can be carried out during a short time span as theatre, religious sites or malls.
Best seasons for visiting
The data enabled the visualization of periods with the highest number of travellers' comments per three-month intervals. Table 4 presents as an example the comparative data of two destinations in Minas Gerais that have distinct tourist activities. Carrancas is a municipality known for having a natural heritage, for its number of inns, waterfalls and natural attractions that draw mostly young people's attention. The data in Table 4 present a large number of evaluations in the period between December and February that corresponds to the period of school holidays in Brazil, suggesting a link with the visiting public of that place. Monte Verde district is known in Minas Gerais as a winter destination (cold climate and romantic hotels). Table 4 shows the peak of evaluations (32.01%) exactly between June and August (Brazilian winter).
| Municipalities and attractions | N | Mar-May (%) | Jun-Aug (%) | Sep-Nov (%) | Dec-Feb (%) |
|---|---|---|---|---|---|
| Carrancas (Total) | 863 | 34.32 | 13.80 | 16.76 | 35.11 |
| Cachoeira da Esmeralda | 130 | 54.62 | 9.23 | 0.00 | 36.15 |
| Cachoeira Da Fumaca | 123 | 35.77 | 19.51 | 17.07 | 27.64 |
| Carrancas Eco Adventure | 106 | 35.85 | 13.21 | 16.98 | 33.96 |
| Centro Historico de Carrancas | 175 | 32.57 | 17.14 | 22.29 | 28.00 |
| Complexo da Zilda | 212 | 24.06 | 16.04 | 20.28 | 39.62 |
| Poço do Coração | 117 | 23.08 | 7.69 | 23.93 | 45.30 |
| Monte Verde (Total) | 4424 | 25.85 | 32.01 | 24.12 | 18.01 |
| Casa dos Beija Flores | 121 | 24.79 | 30.58 | 28.93 | 15.70 |
| Chapeu do Bispo | 392 | 26.28 | 34.95 | 23.21 | 15.56 |
| Igreja de Sao Francisco de Assis - Monte Verde | 146 | 23.97 | 26.71 | 25.34 | 23.97 |
| Pedra Partida | 435 | 25.52 | 35.86 | 23.22 | 15.40 |
| Pedra Redonda | 2626 | 28.90 | 32.14 | 19.69 | 19.27 |
| Pico Selado | 307 | 27.04 | 31.60 | 24.76 | 16.61 |
| Trilha do Plato | 113 | 25.66 | 33.63 | 25.66 | 15.04 |
| Unger's Pottery House | 284 | 24.65 | 30.63 | 22.18 | 22.54 |
After this analysis, it was possible to establish a proposal for performance indicators that may help Minas Gerais tourism policy managers to monitor the evolution of the tourist attractions on TripAdvisor.
Suggested indicators
1 - Number of reviews of Minas Gerais tourist attractions
Description: The objective of the indicator is to measure the number of absolute evaluations in all Minas Gerais attractions on TripAdvisor.
Calculation formula: AvaTotal = AvaAtrat1 + AvaAtrat2 + …AvaAtratn
In which AvaAtrat = absolute number of assessments in one state attraction and AvaTotal = absolute number of all assessments of the state attractions.
Reference value (2016): 122,076
Value observed (2017): 171,458
Value observed (2018): 193,821
Polarity: Higher better
Application: The indicator aims to measure the effectiveness of promotions that encourage visitors to Minas Gerais tourist attractions to evaluate them on TripAdvisor. An increase in the number of state assessments on the platform will also increase the relevance of the destinations compared to other national destinations on the website.
2 - Average satisfaction in Minas Gerais tourist destinations
Description: The aim of the indicator is to transform the ratings made by TripAdvisor users into a single grade, ranging from 1 to 5 marks, with 1 being the lowest and 5 being the highest, making it easier to follow. Thus, each evaluation performed as excellent is scored with a grade 5, very good is assessed as grade 4, average as grade 3, poor grade 2 and terrible grade 1. From then, the average of the grades of each municipality is taken from the average of the grades of each attraction of the municipality. Next, the general value of Minas Gerais will be the average of the grades of all municipalities.
Calculation formula: Satisf=(notm1+notm2...+notmn)/mTotal
In which Satisf = average satisfaction in the tourist destinations of Minas Gerais; notm1= average grade of municipality 1 (any); notm2= average grade of municipality 2 (any); notmn= average grade of municipality n (any) and mTotal = total number of municipalities.
Reference value (2016): 4.29
Value observed (2017): 4.28
Value observed (2018): 4.32
Polarity: Higher better
Application: The indicator assesses the users' level of overall satisfaction with the Minas Gerais attractions on TripAdvisor. It makes it possible to monitor whether improvements in promotion and infrastructure are directly impacting the quality of the attractions offer in Minas Gerais destinations.
3 – Percentage of evaluations at less evaluated destinations
Description: The indicator measures the percentage of ratings on the destinations with the lowest number of TripAdvisor reviews in relation to destinations with the highest number of ratings. The average number of evaluations for each destination on the website is 2,654, but only seven destinations are above this value, concentrating 77.83% of all evaluations. The other thirty-nine municipalities are below average, concentrating only 22.17% of the evaluations.
Calculation formula: DestMenos=(AvaMenos x 100)/AvaTotal
In which DestMenos = Percentage of evaluations at less evaluated destinations; AvaMenos = Absolute ratings of less rated destinations and AvaTotal = Absolute ratings of all destinations.
Reference value (2016): 22.17%
Value observed (2017): 22.11%
Value observed (2018): 22.38%
Polarity: Higher better
Application: This indicator measures the impact of actions meant to decentralise and diversify the supply of products and services to the largest number of municipalities in the state. Because most of the tourist destinations are located in only a few municipalities, the benefits of the tourism industry affect only a few areas.
Discussion
The web scraping method enabled data extraction from tourism websites. The scraping technique helped to gather non-structured data into well-structured worksheets, enabling a more efficient analysis of information (Vargiu and Urru, 2013).
The classification observations in municipalities were more accurate than for results aggregated within region or states. The categories were also divided by the type of traveller (family, couple, friends, solo, business), creating a ranking of the types of attractions most visited for each profile. These results could be used to present an offer to visit similar attractions to potential customers.
User ratings were analysed individually by the name of the attraction and grouped by the attraction category and municipality. An evaluation by scale of satisfaction of the visitors to each attraction was obtained by transforming the absolute values of the evaluations into percentages. Scores were excellent, very good, average, poor or terrible. The average of the absolute values of the evaluations provided a general average of satisfaction for the attractions. The general average enables a faster analysis of the results considering a large listing of attractions, as well as creating a decreasing ranking with the highest valuation attractions.
The number of evaluations made for each season (Mar-May, Jun-Aug, Sep-Nov, Dec-Feb) makes it easier to identify the most visited attractions in a given period. This result is important to understand the seasonality of tourism in a city or between cities. One of the main challenges faced by public managers is the creation of strategies that allow for optimal distribution of visitors for an attraction or for a municipality in a homogeneous way throughout the year (Butler, 1998). These measurements can help identify seasonality and sources of variation.
The data also enable the creation of some coherent indicators according to Minas Gerais strategic planning. Three extractions were performed during two years and it was observed that the indicators could be monitored without prejudice to data.
According to the indicator related to the number of reviews of Minas Gerais tourist attractions, there was a variation of 40% between 2016 and 2017. Meanwhile, the variation rate was of 13% from 2017 to 2018. Considering that TripAdvisor is a platform with great prestige that influences travellers' decision-making (Munar and Jacobsen, 2013; Limberger et al., 2014), it is crucial that the attractions encourage visitors to assess the quality of their services and products. The greater the number of reviews and comments on the website, the better the database will be for managers to assess, helping them to make decisions (Chen, Chiang and Storey, 2012; Devika and Surendran, 2013). Moreover, encouraging evaluations on the platform helps to promote the destination and its attractions in relation to other similar holiday destinations on TripAdvisor.
The second indicator related to the average satisfaction in Minas Gerais tourist destinations showed a slight positive variation between 2016 and 2018 (4.29 to 4.32). The indicator not only measures the level of satisfaction for the state but also for each municipality. This way, it is possible to identify which destinations have below-standard levels of satisfaction within the state, enabling the creation of positive actions to improve the quality of products and services in those places. Understanding visitors´ satisfaction levels enables making changes in marketing actions, as well as identifying problems and opportunities to aid long-term planning (Dwyer and Kim, 2003).
The last indicator about the percentage of evaluations at less-evaluated destinations showed a positive variation between 2016 and 2018 (22.17% to 22.38%), which demonstrates that there was a slight lower concentration of evaluations among Minas Gerais destinations. In 2016, only seven destinations were above the average of evaluations in the entire state. In 2018, the city of Capitolio also surpassed the state average and increased the value observed. The indicator enables the creation of promotion and marketing strategies among the less-assessed destinations to distribute better the flow of visitors and generated income among those places. Action plans together with two or more destinations are rare but crucial to distribute better the number of visitors among different geographical points of a specific territory (Smith, 2014).
It is expected that actions should be taken to improve the indicator values if the government accepts these indicators as reliable results for tourism policies.
Conclusions
The present study demonstrated the feasibility of extracting digital information for the creation of tourism indicators to be used by the public administration. For this purpose, a scraping technique was used to collect data related to the attractions category, visitors' profiles, periods of visit and overall satisfaction rating by the users of the registered attractions on TripAdvisor. Three indicators were developed to be compatible with the general guidelines from UNWTO (United Nations, 2010). The method presented does not aim to replace the traditional forms of data collection completely. It serves as complementary research to help in the decision making process for public and private managers. It is suggested that the results presented be combined with other sources of information available on tourism, aiming for a more integrated analysis and broader context. For two and a half years, the indicators were monitored and their measuring feasibility was approved.
In general, the indicators development process was carried out as follows:
- Data extraction from TripAdvisor;
- Descriptive analysis of the results from the information collected;
- Selection of the most relevant results for the development of indicators;
- Elaboration of technical files with details of each indicator;
- Monitoring of indicators and evaluation of implementation feasibility.
Besides creating a database, this study also enabled the elaboration of indicators from travellers' information on social media for use in public administration. Prior to this work, there were no indicators for Minas Gerais based on network users' data.
Municipalities can use this method to make their own monitoring solutions and identify the bottlenecks pointed out by TripAdvisor users. For example, the number of comments and the average rate of the attractions assessed can help managers to create promotional strategies that aim to increase the number of visits to destinations that have a good satisfaction grade but a low number of visits. Work can improve satisfaction rates of the attractions that obtained lower grades. It will also allow for the creation of strategies for mitigation of the data in a more precise way.
In the private sector, the results can serve as an alternative method to assist in the formation of infrastructure improvements for public agencies (such as accessor street lighting) and to create action plans (such as promotions, improvements in service and support, promotional campaigns) to increase the number of visitors and the quality of users' experiences in tourist attractions.
It highlighted that the use of indicators can be extended and used for the evaluation of new projects. For example, indicators could be created that compare the performance of Minas Gerais heritage sites recognized by UNESCO in relation to other national or international heritage sites that have similar characteristics to the ones in Minas Gerais. In addition, indicators that monitor the evolution of certain municipalities or attractions of Minas Gerais relative to municipalities' or Brazilian attractions overall, can be an important tool for the analysis of competition in the market.
Finally, it is also expected that new methods of extraction can be used in future research, adding information about bars, restaurants, hotels and travel agencies. Moreover, the data that captured users' qualitative comments for each attraction could be further analysed to help better understand the results presented.
About the authors
Rafael Almeida de Oliveira is a PhD candidate at the Federal University of Minas Gerais of School of Information Science. He is member of International Federation for IT and Travel & Tourism (IFITT). His research interest includes web scraping, data analytics and tourism technology. He can be contacted at rafalolbh@hotmail.com.
Renata Maria Abrantes Baracho is a Professor in the Graduate Programmes of the Architecture School and the School of Information Science at the Federal University of Minas Gerais UFMG, Brazil. She holds undergraduate degrees in Architecture and Computer Science, a Masters in Computer Science and PhD in Information Science (UFMG, Brazil) with PSDE from Penn State University (USA). She can be contacted at renatabaracho@ufmg.br.
References
- Butler, R. W. (1998). Seasonality in tourism: issues and implications. The Tourist Review, 53(3), 18–24.
- Cardoso Junior, J.C. (2015). Monitoramento estratégico de políticas públicas: requisitos tecnopolíticos, proposta metodológica e implicações práticas para a alta administração pública brasileira. (Strategic monitoring of public policies: technopolitical requirements, methodological proposal and practical implications for the Brazilian public administration.). Brasília: Instituto de Pesquisa Econômica Aplicada. Retrieved from http://www.ipea.gov.br/portal/images/stories/PDFs/TDs/td_2040.pdf (Archived by WebCite® at http://www.webcitation.org/74JuHR5mc)
- Chen, H., Chiang, R.H.L. & Storey, V.C. (2012). Business intelligence and analytics: from big data to big impact. MIS quarterly, 36(4), 1165–1188.
- Devika, K. & Surendran, S. (2013) An overview of web data extraction techniques. International Journal of Scientific Engineering and Technology, 2(4), 278-287.
- Dupeyras, A. & MacCallum, N. (2013). Indicators for measuring competitiveness in tourism: a guidance document. Paris: OECD Publishing. (OECD Tourism Papers, 2013/02).
- Dwyer, L. & Kim, C. (2003). Destination competitiveness: determinants and indicators. Current issues in tourism, 6(5), 369–414.
- Gil, A.C. (2002). Como elaborar projetos de pesquisa. (How to design research projects). São Paulo, Brazil: Atlas.
- Gretzel, U. & Yoo, K.H. (2008). Use and impact of online travel reviews. In P. O'Connor, W. Hopken & U. Gretzel (Eds.), Information and communication technologies in tourism (pp. 35–46). Vienna: Springer-Verlag Wien.
- Jannuzzi, P.M. (2015). Indicadores para diagnóstico, monitoramento e avaliação de programas sociais no Brasil. (Indicators for the diagnosis, monitoring and evaluation of social programmes in Brazil). Revista do Serviço Público, 56(2), 137–160.
- Limberger, P.F., Anjos, F.A., Meira, J.V.S., Anjos, S.J.G. (2014). Satisfaction in hospitality on TripAdvisor.com: an analysis of the correlation between evaluation criteria and overall satisfaction. Tourism & Management Studies, 10(1), 59–65.
- Malik, S. K. & Rizvi, S. A. M. (2011). Information extraction using web usage mining, web scraping and semantic annotation. In Proceedings, 2011 International Conference on Computational Intelligence and Communication Systems, 7-9 October, 2011, Gwalior, India. (pp. 465–469). New York, NY: IEEE.
- Marres, N. & Weltevrede, E. (2013) Scraping the social? Issues in live social research. Journal of Culture Economy, 6(3), 313–335.
- Minas Gerais. Assembleia Legislativa. (2011). Caderno de indicadores. Belo Horizonte, Brazil: Escritório de Prioridades Estratégicas. Retrieved from https://bit.ly/2DV2FXj. (Archived by WebCite® at http://www.webcitation.org/74Ducu9uJ).
- Minas Gerais. Assembleia Legislativa. (2016). Plano Mineiro de desenvolvimento integrado. Volume 1: desenvolvimento econômico e social sustentável de Minas Gerais – 2016 a 2027. Belo Horizonte, Brazil: Assembleia Legislativa de Minas Gerais. Retrieved from https://bit.ly/2rfAE5f. (Archived by WebCite® at http://www.webcitation.org/74Dv6Ge7d).
- Munar, A.M. & Jacobsen, J.K. (2013). Trust and involvement in tourism social media and Web-based travel information sources. Scandinavian Journal of Hospitality and Tourism, 13(1), 1–19.
- Pereira, D. R. M. & Pinto, M. R. (2012). A importância do entendimento dos indicadores na tomada de decisão de gestores públicos. (The importance of the understanding of the indicators in the decision making of public [services] managers.). Revista do Serviço Público, 63(3), 363–380.
- Provost, F. & Fawcett, T. (2013). Data science and its relationship to big data and data-driven decision making. Big Data, 1(1), 51–59.
- Scott, S. V., & Orlikowski, W. J. (2012). Reconfiguring relations of accountability. Materialization of social media in the travel sector. Accounting, Organizations and Society, 37(1), 26–40.
- Serapioni, M. (2016). Conceitos e métodos para a avaliação de programas sociais e políticas públicas. (Concepts and methods for the evaluation of social programmes and public policies). Sociologia, 31(1), 59-80.
- Smith, S. L. (2014). Tourism analysis: a handbook. London: Routledge.
- Srivastava, J., Cooley, R., Deshpande, M., & Tan, P. N. (2000). Web usage mining: discovery and applications of usage patterns from web data. ACM SigKDD Explorations Newsletter, 1(2), 12–23.
- Stanton, J.M. (2012). Introduction to data science. Syracuse, NY: Syracuse University. Retrieved from https://bit.ly/2AFdvO6. (Archived by WebCite® at http://www.webcitation.org/74DvVgAUd).
- Teixeira, E. B. (2003). A análise de dados na pesquisa científica: importância e desafios em estudo organizacionais. (Data analysis in scientific research: importance and challenges in organizational studies). Desenvolvimento em Questão, 1(2), 177–201.
- Torres, J. L. X. S. (2013). Análisis cuantitativo de los hoteles en Tripadvisor: destinos costeros en España y Portugal. (Quantitative analysis of hotels in TripAdvisor: destinations in Spain and Portugal.) (Unpublished master's thesis). Universidad de Málaga, Málaga, Spain. Retrieved from https://bit.ly/2RnsJhT (Archived by WebCite® at http://www.webcitation.org/74IiGp5WN)
- United Nations. Statistical Division. (2010). International recommendations for tourism statistics 2008. New York, NY: United Nations Publications. (Studies in methods. Series M. No. 83). Retrieved from https://unstats.un.org/unsd/publication/seriesm/seriesm_83rev1e.pdf . (Archived by WebCite® at http://www.webcitation.org/74Dvn4dFw).
- Uren, V., Cimiano, P., Iria, J., Handschuh, S., Vargas-Vera, M., Motta, E. & Ciravegna, F. (2006). Semantic annotation for knowledge management: requirements and a survey of the state of the art. Web Semantics: Science, Services and Agents on the World Wide Web, 4(1), 14–28.
- Vargiu, E. & Urru, M. (2012). Exploiting web scraping in a collaborative filtering-based approach to web advertising. Artificial Intelligence Research, 2(1), 44-54.
- Viegas, M.M.V.A. (1997). As estatísticas do turismo e a uniformização de conceitos. (Tourism statistics and the standardization of concepts). Lisbon: Instituto Nacional de Estatística.
- Xiang, Z., Magnani, V.P. & Fesenmaier, D.R. (2015). Information technology and consumer behavior in travel and tourism: Insights from travel planning using the internet. Journal of Retailing and Consumer Services, 22, 244–249.