Development of online travel Web scraping for tourism statistics in Indonesia
Yustiar Adhinugroho, Amanda Pratama Putra, Muhammad Luqman, Geri Yesa Ermawan, Takdir, Siti Mariyah, and Setia Pramana
Introduction. This research aims to study a novel approach to producing tourism statistics, especially accommodation statistics, in Indonesia using scraping of online travel agent Websites.
Method. Accommodation data (e.g., room availability and price) were gathered from two of the largest online travel agencies in Indonesia. All data were collected automatically from the sites’ URLs listed in the sitemap.
Analysis. The data were collected daily from 6 March to 27 July 2019. Datasets from the two Websites were merged. The room occupation rate (ROR) for each province was calculated and compared with the official statistics from Statistics Indonesia.
Results. The results show that the online room occupancy rates and official statistics have a similar pattern indicating the use of the Web scraping technique provides valuable information, to measure the room occupation rate with an advantage in terms of cost and collection time.
Conclusions. It is feasible to use big data as a proxy of or a complement to official statistics, especially in tourism statistics. By using the Web scraping technique, the indicator that usually requires significant time and cost can be done in real-time and less cost. This new approach would improve the quality of tourism statistics produced by BPS Statistics Indonesia.
DOI: https://doi.org/10.47989/irpaper885
Introduction
Technology developments are rapid from year to year. These developments massively increase the usage of the Internet. Along with the Industrial Revolution 4.0, the Internet has become an information centre containing various kinds of data from many different sources. Many people today have made the Internet their primary source of information for data and information related to their daily interests. Data that was initially only available to certain media and institutions is now widely spread through cyberspace. Big data can be used by each institution or company as a supporting tool to meet their business process needs. These data can be used to conduct business supervision, capture more consumers, and for future decision-making.
The Indonesian Central Bureau of Statistics (Statistics Indonesia) is a government agency that has the authority and duty as the organizer of integrated national statistical activities to provide a reliable, effective, and efficient national statistics system. Statistics Indonesia collects both basic and sectoral statistics, including tourism statistics needed by the government to determine policies for the development of the tourism sector, one of the national priority projects.
Tourism is one of the industrial sectors that (at the time of writing) is seeing rapid development around the world and in Indonesia. 'In 2015, this sector has contributed 4.25% of the Indonesia Gross Domestic Product (GDP)'' (Statistics Indonesia, 2015). 'Furthermore, as shown in Table 1, from 2017 until 2018, more than one million foreign tourists have visited Indonesia every month' (Statistics Indonesia, 2018).
| Month | Number of visits by tourists (2017) | Number of visits by tourists (2018) |
|---|---|---|
| January | 1,107,968 | 1,097,839 |
| February | 1,023,388 | 1,197,503 |
| March | 1,059,777 | 1,363,426 |
| April | 1,171,386 | 1,302,321 |
| May | 1,148,588 | 1,242,705 |
| June | 1,144,001 | 1,322,674 |
| July | 1,370,591 | 1,547,231 |
| August | 1,393,243 | 1,511,021 |
| September | 1,250,231 | 1,,370,943 |
| October | 1,161,565 | 1,291,605 |
| November | 1,062,030 | 1,157,483 |
| December | 1,147,031 | 1,405,554 |
In addition, the Indonesian government has targeted the tourism sector as a leading foreign exchange contributor. 'By the end of 2018, it was noted that the tourism sector was the second largest foreign exchange contributor after oil palm, which reach the 17.6 billion dollar mark' (Indonesia Ministry of Tourism, 2018). Since the tourism sector is a strategic sector in the economic structure of Indonesia, it is necessary to collect quality statistical data as a basis for policymaking and determining the direction of tourism development.
Information about tourism statistics is widely available on the Internet. In Indonesia, data are available on online travel agents such as Traveloka, Trivago, Agoda, and Pegipegi, and include information about hotels, restaurants, airplane tickets, train tickets, etc. Information about tourism services can be collected and used to produce statistics that describe the conditions and phenomena of a region.
Accommodation services are an important part of the tourism sector and fundamental to the supply of tourists. One way of recording accommodation data is through surveying the companies providing accommodation services. 'Monitoring tourism indicators becomes crucial for public managers and for the private sector tourism professionals who need evidence to assist decision-makers in organizations' (Oliveira and Baracho, 2018).
So far, Statistics Indonesia has collected accommodation data in Indonesia through a conventional survey (Figure 1).
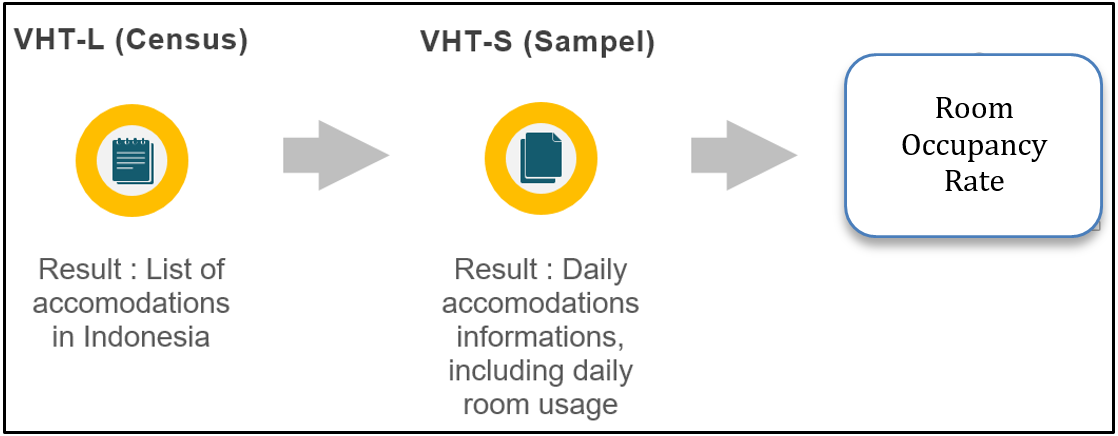
Figure 1: Accommodation information collection process
The accommodation information list is collected by a census called VHT-L, created by Statistics Indonesia. A survey called VHT-S is then carried out based on the list of accommodation collected from VHT-L. The VHT-S survey is performed every month by sending the questionnaire to each accommodation service provider. The provider fills out the questionnaire every day for one month to see how the room use is available. After completing one month, the completed questionnaire will be returned, and the provider will receive a new questionnaire for the next month. Next, the questionnaire will enter the stages of cleaning, batching, editing, coding, and validation. Finally, the data that has been cleaned will be compiled and tabulated to produce accommodation statistics.
The process of collecting existing data requires a lot of time and money. One solution that can be used to overcome the above problems is to use the Web scraping method. The Web scraping method is used to retrieve unstructured data that is available on online travel agent Web pages, then transformed into structured data. With the Web scraping method, the data can be collected in real time, saving time and money.
One of the goals of Statistics Indonesia is to provide quality statistical data through integrated and national and international standard statistical activities. In the bureaucratic reform of Statistics Indonesia for 2015-2019, they targeted changing and reforming their statistical development, such as increasing the quality of the statistics. Improving the quality of statistics can be done by transforming existing business processes with the modernization of information and communication technology. That is, by using data from the Internet and the modernizing the process of collecting data, moving from a paper-based to a computerized system. Statistics Indonesia previously used big data as an alternative source of data. They conducted a study of the potential implementation of big data that can be applied for official statistics (see Pramana et al., 2017).
This study aimed to investigate the utilization of big data, in this case through Web scraping, to produce tourism statistics, especially accommodation statistics in Indonesia by using online travel agent data.
Literature review
Big data
Big data is a collection of data in large numbers, complex, and has a complex structure. Additionally, 'Big data can also be interpreted as growth data that increases, varies, and creates new challenges in understanding it' (Narendra, 2015). Stantic and Pokorny (2014) note that ‘Big data has some data dimension that characterized by several Vs’:
Volume: explains that the data generated every second time has a large size. This means that big data is too large to save using traditional database technology, and requires large amounts of processing, managing, and analysing data.
Velocity: represents how long the process is from the data creation to data collection through data streaming into data processing. Velocity relates to both how quickly data is being produced and how quickly the data must be processed to meet the demand for extracting useful information.
Variety: refers to the data types and variation from the existing data file format, and the structure of the data. Most big data is unstructured so tabulation cannot be done directly. The variety of unstructured data creates problems not only for storage but also for mining and analysing data.
Veracity: refers to the complexity of data structures, availability of data, accountability, and the level of trust in data. Veracity in data analysis is the biggest challenge when compared with volume and velocity as it is harder to solve problems to keep your data clean.
The other ‘V’ characteristics include value (indicates if the data is worthwhile), variability (the different meanings with a given piece of data), and volatility (how long data is valid and how long should it be stored).
Nowadays, big data is considered to be capital. Some of the biggest technology companies in the world use data enables them to constantly improve, offer better services, and develop new products and features. Technological breakthroughs have decreased data storage and data backup costs, making it easier and cheaper to store more data than before. By using large data volumes that are now cheaper and more accessible, we can make business decisions that are more accurate and precise. Finding value in big data is not just about the analysis process. The discovery process requires as much insightful analysis as the information we can extract from big data, finding patterns, making assumptions, and predicting data so it can help us to create the right business decisions.
Website structure
The structure of each Website is formed from the interaction between programming languages HyperText Markup Language (HTML), Cascading Style Sheets (CSS), and JavaScript. Website structure refers to how Website content is organized and interacts and includes content, tags, pages, or another Website. A good Web structure can help the crawler from a search engine or crawler from the robot find all of the sub-pages and link quickly. Some Websites provide files such as sitemap.xml or robots.txt that contain a list or index of all sub-pages that belong to its server. In this paper, we use this file to speed up the crawler in gathering data.
Web scraping
Web scraping is a method or technique of data extraction by a computer software program to obtain information from a Website. 'The procedure usually works by simulating data requests from the user's side by implementing low-level HTTP or by inserting a program on a Web browser' (Mahto and Singh, 2016). The data displayed by most Websites can only be seen using a Web browser and does not provide facilities to store or copy these data. Data collection from Websites can be done by manually copying the data on the Website. The process of automating data collection from several Web pages is called Web scraping. Web scraping is usually done when the data needed is not available in the Application Programming Interface (API). Web scraping is related to the automation of Web simulation, which simulates how users request response data by sending requests to the Webserver through a robot program. Web scraping also focuses on how to transform unstructured data on the Web into structured data. To convert unstructured data into structured data, Web scraping has several automation techniques known as parsing. The robot program will translate unstructured data sources that can be source code from HTML pages, as well as XMLHTTPRequest (XHR) files generated by Web browsers into structured data like JSON.
'There are three levels of Web scraping based on its complexity depending on the amount of JavaScript' (Fedak, 2018):
- A Web page that has a simple structure without using JavaScript, all of the site content and link addresses of the Website are directly listed in the HTML without the need to call it using JavaScript. Retrieval of the data is done by getting its HTML, and then finding the location of elements and retrieving the desired value.
- Web pages that use JavaScript to display a portion of HTML content. Retrieval of the data is done by using the combination of simulation and then extracts the HTML.
- Web pages where most of the content is built with JavaScript, or there is captcha.
Room occupancy rate
'The room occupancy rate (ROR) is a comparison between the number of nights the room is used with the number of nights available in percent' (Statistics Indonesia, 2019). Room occupancy rate indicators can be used to:
- Give an idea of what percentage of available rooms are filled by guests staying at a certain time;
- Indicate whether or not accommodation is demanded by visitors, so it can be seen whether an area lacks accommodation or does not meet the needs of the tourists.
The formula used to calculate room occupancy is

High occupancy rates indicate that the accommodation in an area is more attractive to tourists, while for a low occupancy rate, accommodation is less attractive.
Related works
There are several studies related to the utilization of big data for tourism. Einav’s (2014) study explains 'how the transformation of data and the prospect of large data in economic terms, which can be made the basis of decision making'. Dhirathra et al. (2016) compared 'the results of scraping data from tourism statistics with TripAdvisor Web travel and Instagram social media', and then discussed the number of visits to Paris, TripAdvisor reviews, and the number of posts on Instagram in some periods.
Li et al. (2018) reviewed numerous big data implementations and challenges of tourism statistics. Various data sources coupled with diverse analysis approaches can be used for tourism insight such as tourist demand predictions. Oliveira and Baracho (2018) used social media for development tourism indicators for government policy in Brazil.
Research by Putra and Wulandary (2018) also used online travel agent data to measure the room occupancy rate in Bali. The difference with this current research is the number of travel agent Websites to be scrapped and the geographical target of scraping which is not only in Bali but in all provinces in Indonesia. We also use the data collection framework in Python, therefore the data collection process is more scalable and automatic. The current study has eavaluated all accommodation in Indonesia to see how the accommodation is spread, occupancy fluctuation, and tourism rates.
Method
Data collection was carried out by taking accommodation data for Indonesia through Agoda and Pegipegi, two online travel booking companies. Pegipegi is an Indonesian online travel agent. There are six steps in the workflow from data collection process to analysis: 1. Preparing data extraction, 2. Determination of Web scraping technology, 3. Accommodation collection, 4. Daily scraping, 5. Cleaning and computing data, and 6. Analysis and processing (see Figure 2).
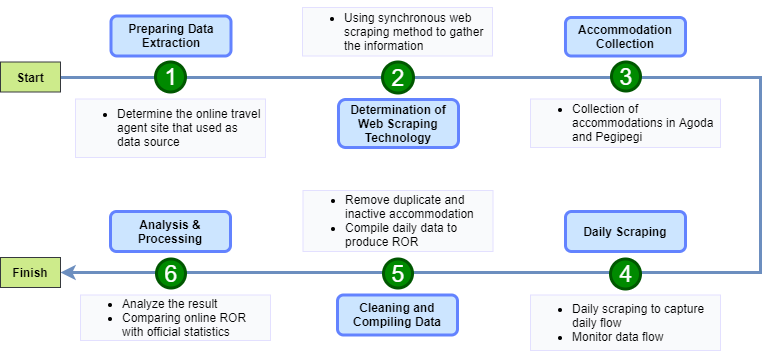
Figure 2: Research workflow
The scope of this study included listing all accommodation names and locations in Indonesia in a single directory. Accommodations as used in this research includes hotels, guesthouses, resorts, homestays, holiday parks, etc (see Figure 9). This list was then used to calculate daily occupancy patterns and daily price patterns. It also can be used to looking at the distribution of accommodation in Indonesia. Each step is discussed below.
Preparing data extraction
We chose Agoda and Pegipegi as data sources for Web scraping because the accommodation information to calculate room occupancy rate (e.g., number of available rooms, number of total rooms) was available.
Accommodation data was acquired from Agoda using JavaScript. We could not get the data directly from the HTML. It takes a long time to gather the accommodation URLs by waiting for the Javascript to load all of the data. To get a list of accommodation on Agoda, we use the sitemap page. The sitemap provided by Agoda can be searched by adding /sitemaps.xml to the site link.
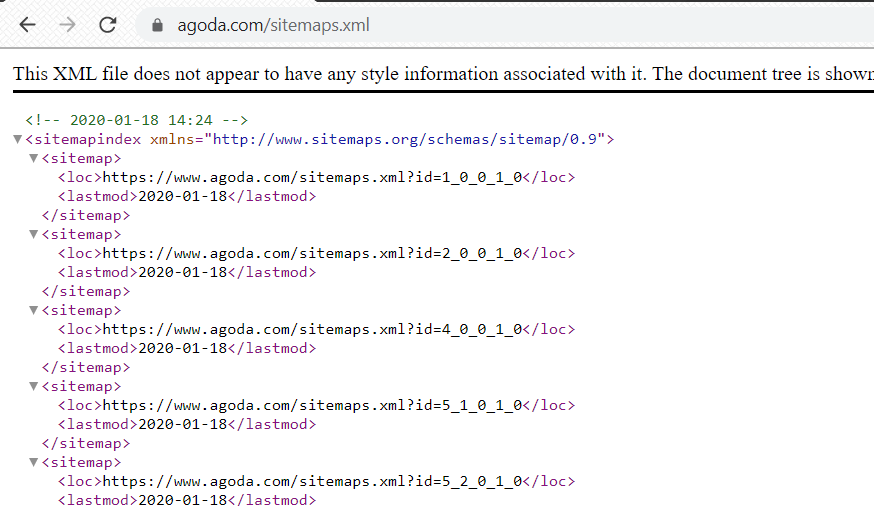
Figure 3: Sitemap of Agoda
We found the accommodation pages by looping through all of the sitemaps inside the <loc> element. To get the Indonesian accommodation, we filtered all hotels by checking whether the word hotel and Indonesia appear in the URL of each sitemap. We used this approach because we learned that the URL structure of each accommodation provider on Agoda includes country name and accommodation type to allow it to be grouped into the same country and the same accommodation type. We gathered all this information by using the Requests module and the Beautiful Soup module in Python. The Requests module was used to get the HTML response from the Web server and the Beautiful Soup module was used to parse the element of accommodations URL from the HTML response.
Beautiful Soup is a Python library that can make parsing pages from HTML easy. Three features make it powerful:
- Beautiful Soup provides a few simple methods and Pythonic idioms for navigating, searching, and modifying a parse tree: a toolkit for dissecting a document and extracting what you need. It doesn't take much code to write an application.
- Beautiful Soup automatically converts incoming documents to Unicode and outgoing documents to UTF-8. You don't have to think about encodings unless the document doesn't specify an encoding and Beautiful Soup can't detect one. Then you just have to specify the original encoding.
- Beautiful Soup sits on top of popular Python parsers like lxml and html5lib, allowing you to try out different parsing strategies or trade speed for flexibility. (Richardson, 2019)
From this method, we got 41,730 Indonesian accommodations from Agoda.
To compile a list of accommodation providers on Pegipegi, the approach was different to Agoda. Pegipegi doesn't use much JavaScript and almost all of the accommodation data in Pegipegi is displayed when the Web page is loaded. Moreover, Pegipegi provides a page that indexes all Indonesian accommodations alphabetically by name. We use Requests and Beautiful Soup modules in Python to loop through the index page to search and parse the current accommodation links. Using this approach, we obtained 20,495 accommodations from Pegipegi.
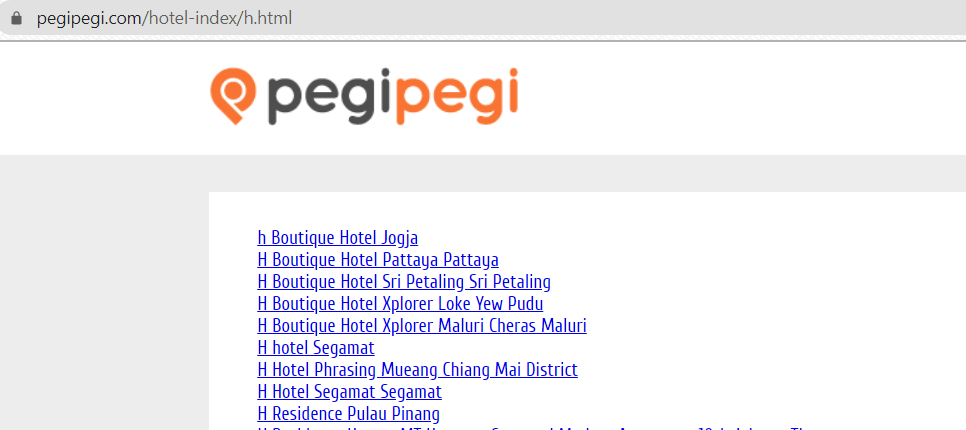
Figure 4: Pegipegi accommodation list
Accommodation data collection
After the accommodation links from Agoda and Pegipegi were collected, we could start to scrape the accommodation information from each URL. Then, we created the second scraper that would extract the information about the accommodations that could run daily. Data collected consist of the link, id, name, type, stars, address, price, review score, number of reviews, room type, number of room types, number of rooms remaining, number of floors, number of restaurants, number of rooms total, year built, latitude, longitude, city or area, and facilities. The collection process was done every day at 6 pm to avoid the check-in and check-out times.
In this research, we used the Scrapy framework. We use Scrapy because it can run asynchronously, so the accommodation information gathering process could be done faster than using only the Requests module in Python. To obtain the information from Agoda, we used an Application Programming Interface (API) that contains HTTP Header, and HTTP response. To get the data, we first sent the HTTP request to the API server with request parameters such as check-in date, check-out date, and hotel id that we already got from the first scraper. After sending the request and its parameters, the server will send a JSON that contains the information about the accommodation. We used two APIs to get all of the information we need. The JSON file contained all of the information as it was provided in the current accommodation on Agoda.
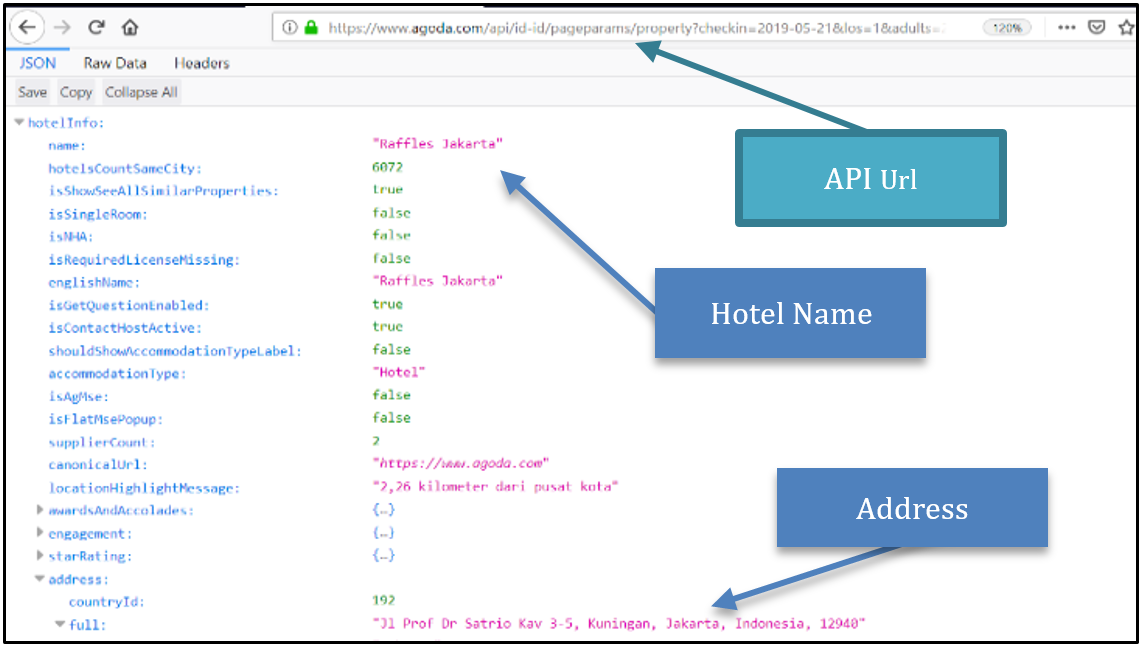
Figure 5: JSON page from Agoda
To get the accommodation data from Pegipegi, we saved the HTML from the Web page using the Requests module. When we visited a particular accommodation Web page in Pegipegi, it automatically showed the accommodation data for that day. Therefore, there was no need to determine the check-in and check-out dates. After we stored the data, we extract the information by parsing the HTML element using the Beautiful Soup module. Parsing is needed to determine the location of the desired element in HTML.
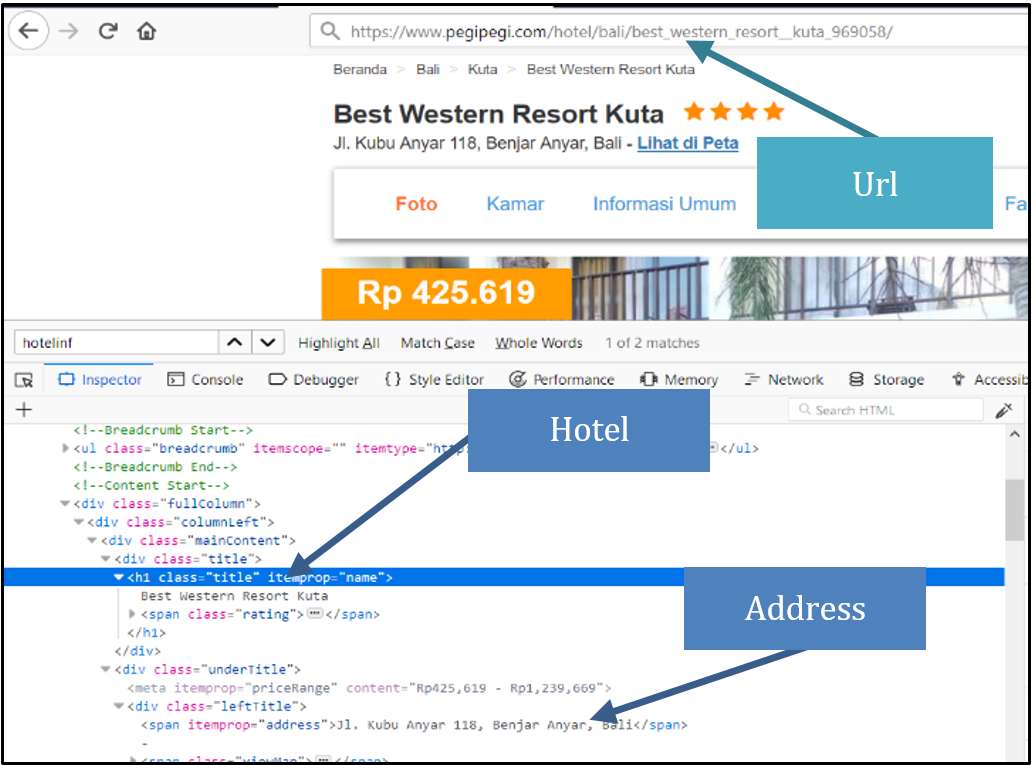
Figure 6: HTML page from Pegipegi
We ran both Agoda and Pegipegi scrapers daily to capture accommodation availability in Indonesia. We did this so we could compare the data from an online source with official statistics generated by Statistics Indonesia.
Cleaning and compiling data
Data obtained from the Web scraper needed to be cleaned before being analysed. The cleaning process included:
- Removing dummy data. Both Agoda and Pegipegi have dummy accommodation data. The dummy data is determined by its name and address.
- Changing the data field into the correct data type. Changing the data field is necessary so we could analyse the result appropriate. For example, Agoda sometimes displays the accommodation price in a different currency.
- Removing data duplication based on name, address, hotel id, and coordinate of the accommodation.
- Removing non-active accommodation. In Pegipegi there is much accommodation that is currently not active but still exists on the list. We classified an accommodation as a non-active if it said inactive, non-active, not active, no active, or not active next to its name.
After the cleaning was done, we merged the accommodation directories from Agoda and Pegipegi into a single directory. In this process, we used a similarity matching algorithm to determine whether two accommodations were the same or not. The matching is done by comparing names and coordinates. We use the Jaro-Winkler (Winkler, 1990) algorithm to find the accommodation name similarity score, and the Haversine formula to compute the distance between coordinates. We determine that two accommodations from Agoda and Pegipegi are the same if the Jaro-Winkler score is more than 0.85 and the Haversine distance is less than 2 kilometres. From this process, we obtained 19,834 unique accommodations.
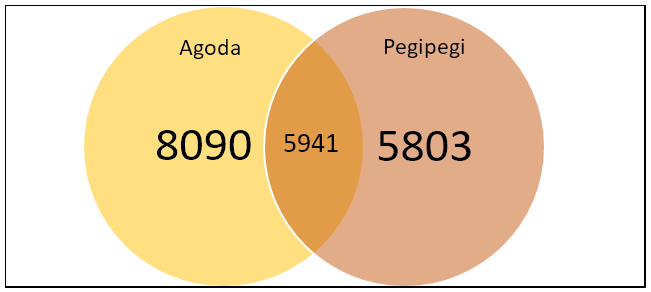
Figure 7: Compiling results
The cleaned data from each day was stored in the local database (in CSV format) and the cloud (using SQL in Bigquery). We used Bigquery because it can manage data using fast SQL-like queries for real-time analysis.
Data processing
After cleaning and compiling the data, we analysed the data to produce the room occupancy rate (ROR). From the Web scraping results, the available variable is the numbers of remaining rooms and numbers of total rooms. To measure occupancy, we need the numbers of booked rooms and the numbers of total rooms. Since the number of booked rooms is not available in the results, we used this formula to calculate room occupancy rate:

We took this approach because the numbers of booked rooms and available rooms complement each other.
Results and discussion
Accommodation distribution in Indonesia
The accommodations are widely scattered in Bali Province and in provinces in Java (Figure 8). We found 33.4% of accommodations are in the Bali Province and 43.2% are in Java. For areas outside of Java, accommodations are widely distributed in North Sumatra Province, West Sumatra Province, Riau Islands Province, and West Nusa Tenggara Province.
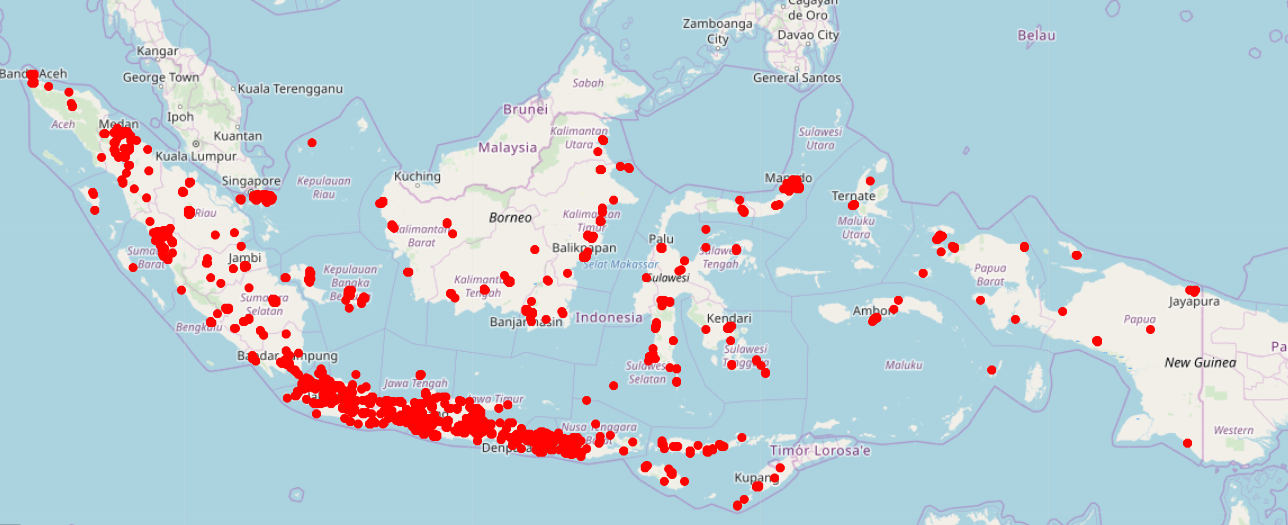
Figure 8: Distribution of accommodation in Indonesia
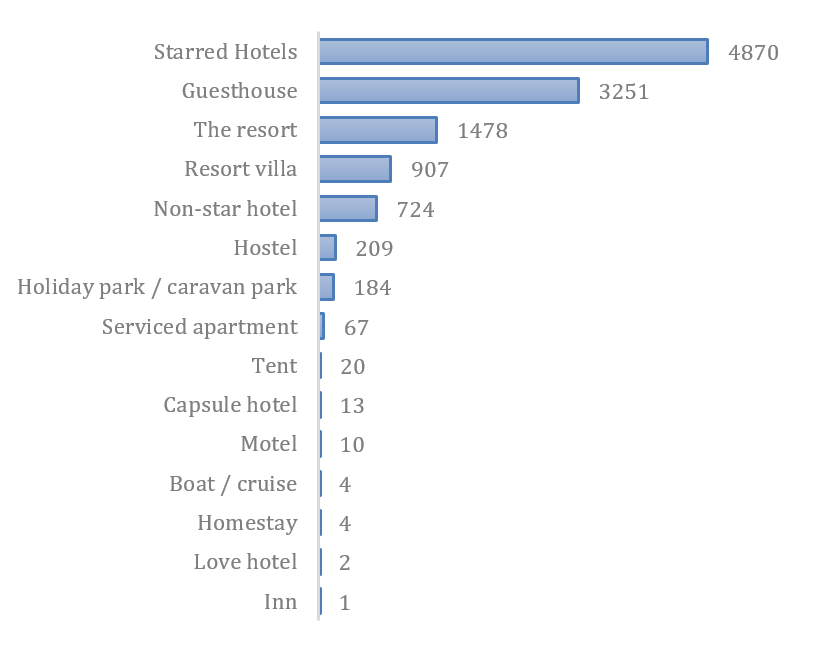
Figure 9: Accommodation distribution based on type
The number of accommodations listed on Agoda's Website is dominated by 4,870 starred hotels, then 3,251 guesthouses, and 1,478 resorts. There are only four homestays, two love hotels and one inn (Figure 9).
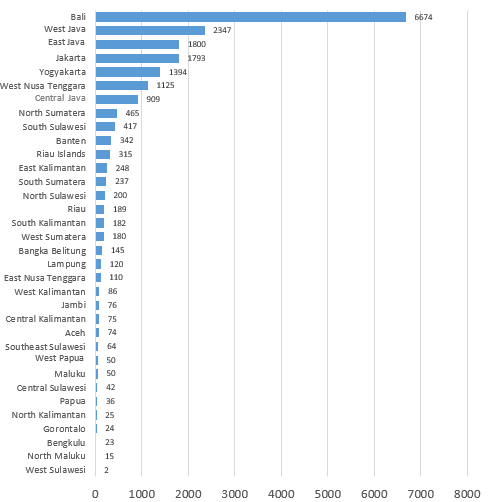
Figure 10: The number of accommodations based on the province
Nearly half of all accommodations are from the Bali Province. Bali has 6,674 accommodations to cater for visitors to its many and popular tourist destinations such as Ubud, Kuta, Seminyak, Jimbaran, Uluwatu, Bedugul, and Legian. West Java Province has 2,347 accommodations for popular tourist destinations such as Bandung, Bogor, and Cianjur. East Java Province has 1,800 accommodations for Surabaya, Malang, and Batu. Jakarta Province is in the fourth position with 1,793 accommodations which are widely spread in urban areas and economic centres including West Jakarta, South Jakarta, and Central Jakarta. Yogyakarta placed in the fifth position with 1,394 accommodations widely distributed in Yogyakarta and Sleman (Figure 10).
Room occupancy and accommodation price
The occupancy rates and accommodation prices fluctuate and form a time series pattern. The time series pattern can be described in three basic component classes: trend, cycle, and seasonality. Occupancy data trends and accommodation prices are quite linear. The occupancy rate from March 6 2019 to April 21 2019 was stable around 75%. From April 22, occupancy rates moved up and then were steady at 80% until May 4 2019. From May 5 to early June, occupancy rates dropped dramatically to 70%. This is because Indonesia entering the Muslim fasting month. The price of accommodation in the fasting month also tends to fall. Then from early June 2019 to June 8, 2019, occupancy rates and accommodation prices rose rapidly. This is because that period has the Eid holidays when most of the people spend time on vacation or going to their hometown (Figure 12).
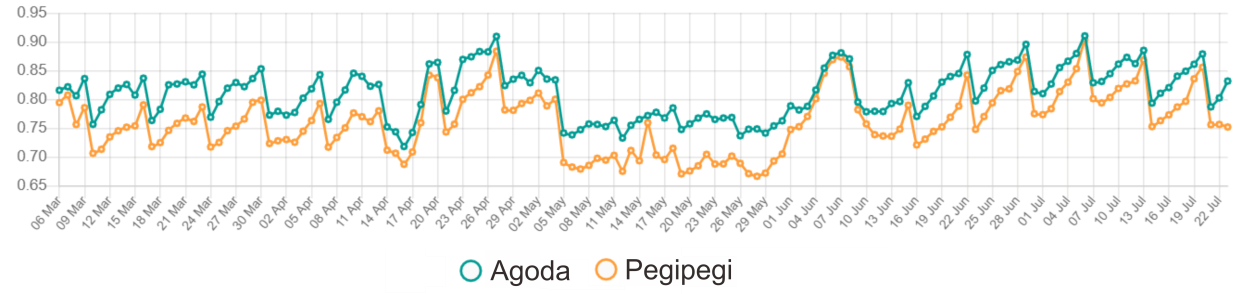
Figure 11: Daily room occupancy rate (ROR)
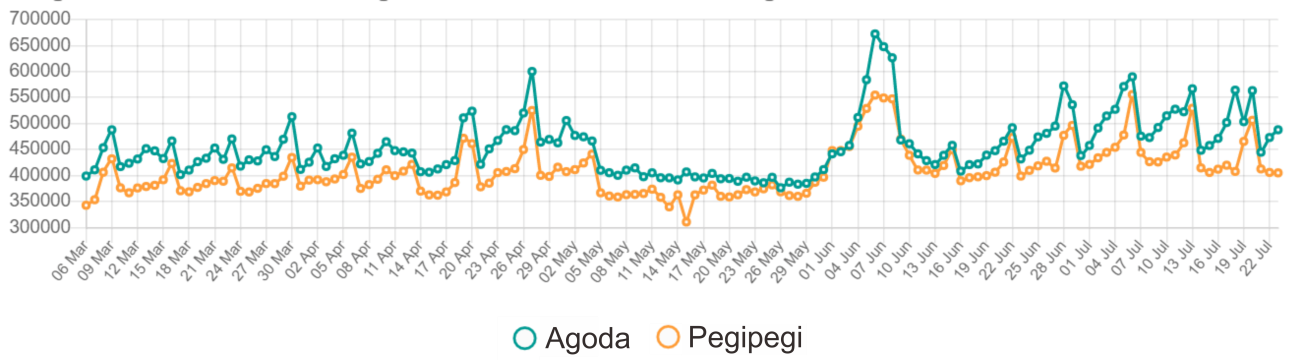
Figure 12: Daily accommodation price
We observe that occupancy rates and accommodation prices form a weekly cycle. The lowest point of occupancy is Monday, and then it stays steady until Thursday before rising rapidly on Friday. The highest point of the occupancy rate is the weekends, especially Saturdays when most tourists spent their time on vacation.
Online room occupancy rate and official statistics from March to July have the same pattern. The occupancy rate produced by official statistics is the result of the monthly survey conducted by BPS Statistics Indonesia in 2019. It can also be seen that the online occupancy rate is always higher than the official statistics room occupancy rate (Figure 13). These results indicate the use of the Web scraping technique provides valuable information for calculating room occupancy rates faster and cheaper than the conventional survey.
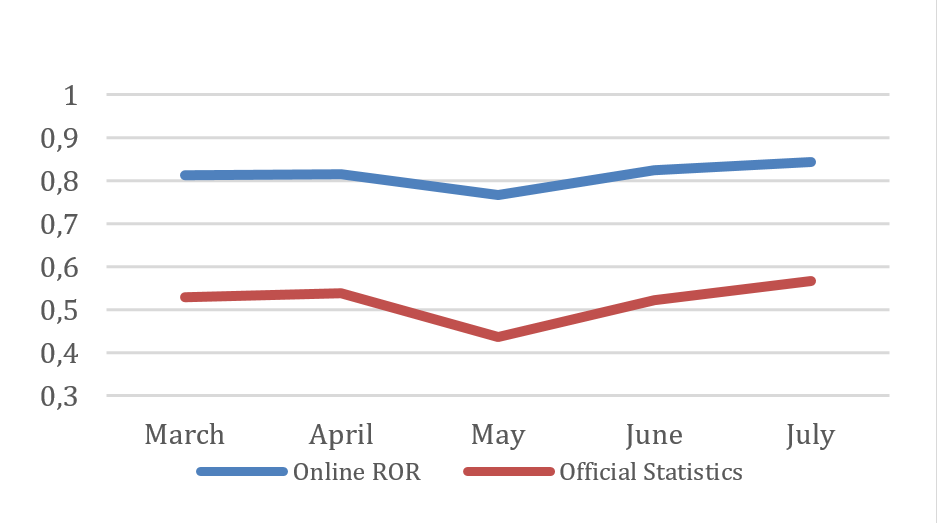
Figure 13: Comparison between online monthly room occupancy rate (ROR) and official statistics
The pattern of room occupancy rate from Web scraping has the same pattern of room occupancy rate as that produced by Statistics Indonesia. We can also say that the results of monthly room occupancy rate from the Web scraping forms a similar pattern as that from Statistics Indonesia.
To compute room occupancy rate in a particular province, the rooms occupied and rooms total are aggregated in that province. Then the aggregate of rooms occupied divided by an aggregate of rooms total to produce the rate. The daily room occupancy rate and daily accommodation price were analysed for each province on a certain range date. The results can be used to look for which province has a high accommodation demand at a certain time. Figure 14 shows daily room occupancy rate of several provinces in Java. We observed that the accommodation demand in Java forms similar pattern. During ramadhan period (May 2020) the occupancy is very low. Then, during the Eid Al-Fitr celebration in, the accommodation demand in all provinces rose rapidly until all of the accommodations were almost fully booked.
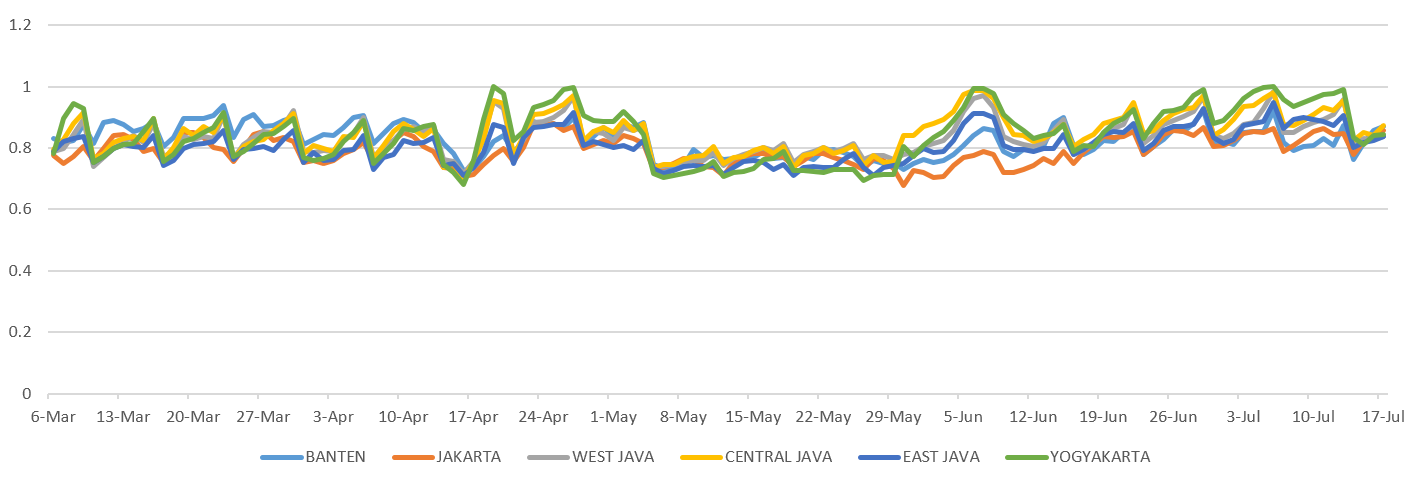
Figure 14: Occupancy pattern during Ramadhan and Eid Al-Fitr
Online accommodation directories
The number of combined accommodations from Agoda and Pegipegi was 19,834. When compared to the official statistics in 2019, we see the same geographical distribution pattern. The data in Figure 15 was the result of the monthly survey (VHT-S) conducted by BPS Statistics Indonesia in 2019
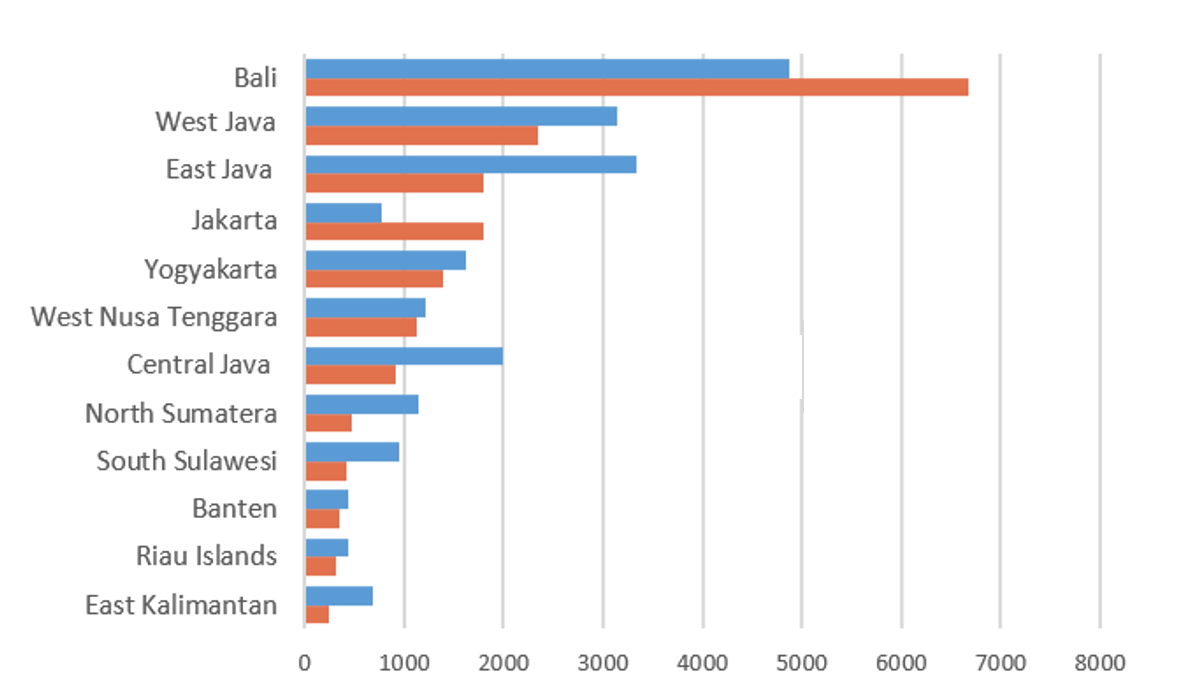
Figure 15: Comparison between the online directories and Official Statistics
Some provinces have a similar number of accommodations in the online directories and in the official statistics (Figure 15). Bali and Jakarta have more accommodations online than those recorded by Statistics Indonesia because, in this province, many accommodation service providers are familiar with the Internet, especially with travel Websites that provide online room sales.
By using Web search data, such as online travel agent data, we can look for predictions of tourism demand. ‘The advantages of using this data are low cost, and the result can reflect the public attention, but the disadvantages are biases estimation‘(Li et al., 2018). The pattern of the trend from the online room occupancy rate and official statistics were more similar at national level than province level. Furthermore, we can calculated room occupancy rate for different type of accommodations such as starred hotels and non-starred hotels. BPS Statistics Indonesia only survey starred hotels, hence stared hotel room occupancy rates could be used to estimate official statistics for all types of accommodations at the national level.
Conclusion
Software was built based on the implementation of the Web scraper. An accommodation directory was compiled based on big data collected from Agoda (11,744 accommodations) and Pegipegi (14,031 accommodations). After merging, 19,834 unique accommodations were obtained. In this study, we have determined room occupancy rates and a weighted average of accommodation prices daily and monthly. After comparing with Statistics Indonesia data, online occupancy figures were found to have the same pattern as official statistics.
The result of this research seems to satisfy the implementation of the Web scraper algorithm and the design of an online accommodation data collection system from a Web travel source. From the results above, it can be concluded that it is feasible to use big data as a proxy or as a complement of official statistics. By using the Web scraping technique, the indicator that usually requires more time and cost can be done in real-time and less cost.
Future work
Since only two Websites were Web-scrapped, this may be only part of all accommodation in Indonesia. To broaden the accommodation coverage, future work would include other online travel or accommodation booking Websites such as Traveloka, Tiket, or Booking.com. The challenge is not only that different Websites have different structures, but also in matching of accommodation to remove duplication since one accommodation provider can be listed in different sites. The use of better techniques such as using better Web scraping framework or using better data storage to keep the daily data, may also make data collection more efficient. The current collected data cannot be considered as the whole population of accommodation in Indonesia. Therefore, the room occupancy rate does not indicate the actual room occupancy rate in Indonesia. It describes the occupancy pattern only, despite being comparable with official statistics. A projection method considering non-probability sampling is needed to utilize this data as the official statistics.
About the authors
Yustiar Adhinugroho is a graduate of the Computational Statistics Department of Politeknik Statistika STIS, Jakarta, Indonesia. He works at BPS Statistics Indonesia as a government employee. His research interest includes Web scraping, big data analytics and Web programming. He can be contacted at yustiaradhinugroho@gmail.com
Amanda Pratama Putra is a bachelor of the Computational Statistics from Politeknik Statistika STIS, Jakarta, Indonesia. He works at BPS Statistics Indonesia as data scientist, and sampling statistician. His research interest includes machine learning, object oriented programming, data science, Web application, data processing, and computer science. He can be contacted at amanda.putra@bps.go.id
Muhammad Luqman is a bachelor in Computational Statistics from Politeknik Statistika STIS, Jakarta, Indonesia. He works at Politeknik Statistika STIS as a data scientist and researcher at BPS Statistics Indonesia big data team. His research interest includes Web scraping, data analyst, Web development, and database design. He can be contacted at luqman@stis.ac.id
Geri Yesa Ermawan is a bachelor in Computational Statistics from Politeknik Statistika STIS, Jakarta, Indonesia. He works at Politeknik Statistika STIS as a data scientist and researcher at the BPS Statistics Indonesia big data team. His research interest includes data warehousing, Web scraping, sentiment analysis, and Web programming. He can be contacted at geri@stis.ac.id
Takdir is a lecturer, researcher, software developer, and the secretary of Computational Statistics Department of Politeknik Statistika STIS, Jakarta, Indonesia. He holds bachelor degree of Applied Science from STIS, and a Master’s Degree in Informatics from Bandung Institute of Technology. His research interest includes distributed system, CAPI, linked data, automated data collection, real-time data streaming, and messaging system. He can be contacted at takdir@stis.ac.id
Siti Mariyah is a lecturer, researcher, and the head of Computational Statistics Research Center, Politeknik Statistika STIS, Jakarta, Indonesia. She holds bachelor degree in Statistical Computation from STIS, and a Master’s Degree of Informatics from Bandung Institute of Technology. Her research interest includes data mining, text mining, machine learning, and spatio-temporal analysis. She can be contacted at sitimariyah@stis.ac.id
Setia Pramana is an Associate Professor at Politeknik Statistika STIS, Jakarta, Indonesia. He currently works at BPS Statistics Indonesia as the Chief of Statistical Model Development Sub Directorate, and leads the BPS Statistics Indonesia Big Data Team. He received Master of Applied Statistics, Master of Biostatistics, and a PhD degree in Mathematics from Hasselt University, Belgium. He did post-doctoral programmme at the Medical Epidemiology and Biostatistics Department, Karolinska Institutet, Sweden. His research interest includes machine learning, big data analytics, bioinformatics, and computational statistics. He can be contacted at setia.pramana@stis.ac.id
References
- Dhiratara, A., Yang, J., Bozzon, A., & Houben, G. J. (2016). Social media data analytics for tourism: a preliminary study. The Delft University of Technology.
- Einav, L. (2014). The data revolution and economic analysis. Stanford University and NBER.
- Fedak, V. (2018, February 10). Big data: what is Web scraping and how to use it. Toward data science. https://towardsdatascience.com/big-data-what-is-Web-scraping-and-how-to-use-it-74e7e8b58fd6. (Archived by the Internet Archive at https://bit.ly/3caWyxm)
- Indonesia. Ministry of Tourism Indonesia. (2018). Tourism foreign exchange ranking. Ministry of Tourism Indonesia.
- Indonesia. Statutes. (1997). Law of the Republic of Indonesia number 16 of 1997 on statistics. Republic of Indonesia State Gazette 39, 22-43. http://unstats.un.org/unsd/vitalstatkb/Attachment568.aspx?AttachmentType=1
- Jaro, M. A. (1995). Advances in record-linkage methodology as applied to the 1985 census of Tampa, Florida. Journal of the American Statistical Association, 84(406), 414–420.
- Li, J., Lizhi, X., Tang, L., Wang, S., & Li, L. (2018). Big data in tourism research: a literature review. Tourism Management, 8, 301–323.
- Mahto, D. K., & Singh, L. (2016). A dive into Web scraper world. In Proceedings International Conference on Computing for Sustainable Global Development (INDIACom), New Delhi, India, 16-18 March, 2016. (pp. 689-693). IEEE.
- Narendra, A. P. (2015). Data besar, data analisis: dan pengembangan kompetensi pustakawan [Big data, data analyst, and improving the competence of librarians]. Record and Library Journal, 1(2), 83-93.
- Nielsen, J. (2020, January 19). Site map usability. Nielsen Norman Group https://www.nngroup.com/articles/site-map-usability/. (Archived by the Internet Archive at https://bit.ly/35BsCJs)
- Oliveira, R.A. de & Baracho, R.M.A. (2018). The development of tourism indicators through the use of social media data: the case of Minas Gerais, Brazil. Information Research, 23(4), paper 805. Retrieved from http://www.informationr.net /ir/23-4/paper805.html (Archived by WebCite® at http://www.Webcitation.org/74Lke0fOq)
- Pramana, S., Yuniarto, B., Kurniawan, R., Yordani, R., Lee, J., Amin, I., Satyaning P.P.N. L, Riyadi. Y., Hasyyati A.N., & Indriani, R. (2017). Big data for government policy: potential implementations of big data for official statistics in Indonesia. In 2017 International Workshop on Big Data and Information Security (IWBIS), Jakarta, 2017, (pp. 17-21). IEEE. https://doi.org/10.1109/IWBIS.2017.8275097.
- Putra, A. P., & Wulandari, H. (2018). Using big data for accommodation statistics: a new challenge in producing tourism statistics. In Asia–Pacific Economic Statistics Week 2018: closing the gaps in economic statistics for sustainable development, Bangkok, 7-11 May, 2018 (pp. 3-19). United Nations Economic and Social Commission for Asia and the Pacific. https://drive.google.com/drive/folders/1_KgI7QI5Cx6HWdSLdy2zjbxXVAppnL4C
- Richardson, R. (2019, December 24). Beautiful Soup 4.4.0 documentation. Python Software Foundation. https://www.crummy.com/software/BeautifulSoup/bs4. (Archived by the Internet Archive at https://bit.ly/3kf2yIa)
- Stantic, B., & Pokorny, J. (2014) Opportunities in big data management and processing. In H.-M. Haav, A. Kalja and T. Robal (Eds.), Databases and information systems VIII (pp. 15-26). IOS Press. (Frontiers in artificial intelligence and applications, 270). https://doi.org/10.3233/978-1-61499-458-9-15
- Statistics Indonesia. (2015). Statistik Indonesia 2015. (Statistical yearbook of Indonesia 2015). https://bit.ly/32Cl8U2 (Archived by the Internet Archive at https://bit.ly/36prhnU)
- Statistics Indonesia. (2018). Statistik Indonesia 2018. (Statistical Yearbook of Indonesia 2018). https://bit.ly/38Cmbar (Archived by the Internet Archive at https://bit.ly/36o7cyh)
- Statistics Indonesia. (2019). Tingkat Penghunian Kamar (TPK) Hotel. (Hotel room occupancy rate). https://sirusa.bps.go.id/sirusa/index.php/indikator/60 (Archived by the Internet Archive at https://bit.ly/35jkc8U)
- Winkler, W. E. (1990). String comparator metrics and enhanced decision rules in the Fellegi-Sunter model of record linkage. In Proceedings of the Section on Survey Research Methods: Papers Presented at the Annual Meeting of the American Statistical Association, Anaheim, California, August 6-9, 1990 (pp. 354-359). American Statistical Association. https://files.eric.ed.gov/fulltext/ED325505.pdf