Vol. 9 No. 3, April 2004
| Vol. 9 No. 3, April 2004 | ||||
Compares three user research methods of studying real-world digital library usage within the context of the Variations and Variations2 digital music libraries at Indiana University. After a brief description of both digital libraries, each method is described and illustrated with findings from the studies. User satisfaction questionnaires were used in two studies, one of Variations (n=30) and the other of Variations2 (n=12). Second, session activity log files were examined for 175 Variations2 sessions using both quantitative and qualitative methods. The third method, contextual inquiry, is illustrated with results from field observations of four voice students' information usage patterns. The three methods are compared in terms of expertise required; time required to set up, conduct, and analyse resulting data; and the benefits derived. Further benefits are achieved with a mixed-methods approach, combining the strengths of the methods to answer questions lingering as a result of other methods.
Usability has been a continuing topic of interest in the digital library (DL) community. In 1995 the US National Science Foundation sponsored "How We Do User-Centered Design and Evaluation of Digital Libraries: A Methodological Forum" (Bishop, 1995). Two more recent examples of such workshops are the JCDL 2002 workshop, "Usability of Digital Libraries" (Blandford & Buchanan, 2002) and the Fourth DELOS workshop, "Evaluation of Digital Libraries: Testbeds, Measurements, and Metrics" (Borgman, 2002), which, although not exclusively concerned with usability issues, included papers on user-centred topics.
Two general, comprehensive books about digital libraries each offer a chapter pertaining to usability: "Usability and Retrieval Evaluation" (Lesk, 1997) and "User Interfaces and Usability" (Arms, 2000). Although both chapters emphasize fitting the DL interface to the user, neither suggests users be consulted or studied. Both take what may be called a "weak" approach to user-centred activity. Weak user-centredness believes it is adequate to base design upon ergonomic principles gleaned from prior studies or upon best practices. Strong user-centredness believes one's own users, tasks, and contexts must be examined because contexts differ too much and design is too complex an activity for general ergonomic principles and best practices, though important, to be sufficient (see Flanagan, et al., 1997, for a similar, more comprehensive dichotomy).
One of the more common methods for studying users is laboratory-based user testing, examining representative or surrogate users as they work through set tasks in a controlled environment. For example, a survey of Digital Library Federation members reports:
Half of the DLF respondents reported conducting or planning to conduct user protocols. With rare exception, libraries appear to view think-aloud protocols as the premier research method for assessing the usability of OPACs, Web pages, local digital collections, and vendor products. (Covey, 2002: 24).
Although we have used and continue to use laboratory-based testing in our work (Fuhrman, et al., 2001; Swan, et al., 2002; Swan, 2002b; Swan, 2003), this paper describes studies of digital library usage in natural settings. We used three methods:
These studies were motivated by a recognition that laboratory-based testing differs from actual use, a difference we are exploring in greater detail (Notess & Swan, 2003). Unlike many studies of DL use, our studies primarily examined information use rather than information seeking. A final characteristic of our user studies is that they are motivated by product design: we are interested in learning about usage for the purpose of improving the design of our digital library. This intention places us in Fallman's (2003) 'research-oriented design' category: we are focused on product, conducting user research in order to generate and improve that product. Although this paper presents findings from our various user research methods, those findings are included because they illustrate the methods rather than because the user-study findings themselves are of general importance. The significant result in this paper is the description of and comparison amongst the user study methods. After a brief description of our digital music library systems, the method and findings of each study are summarized. Then, comparisons are drawn among the methods, looking at cost, skill requirements, and the nature and usefulness of the findings.
Variations is a heavily used digital music library, providing online access to music recordings and scores in the Indiana University (IU) Cook Music Library since 1996 (Dunn & Mayer, 1999). Variations contains over 200 scores (printed music) and 8,000 near-CD quality digitized recordings, most of which are classical, although jazz and popular music are also represented. The online collection has grown in direct response to requests for online reserve material or for access to special collection items. Items are available from the online catalogue and from course reserve Web pages. Students can use Variations recordings from any of ninety PCs in the music library. Faculty can use Variations from several music classrooms to support instruction.
Items in Variations are accessed by URL. Recording URLs in the MARC-based online library catalogue (IUCAT) lead to a Web page summarizing the item and its contents. Links on course reserve pages also lead to item Web pages. The Variations player window (Figure 1) is invoked by clicking on a link on the item Web page. Because Variations audio files are stored on tape and copied to disc-based cache on demand, users may have to wait several minutes for the player to appear if no one has requested that item during the previous day or two. Variations score items do not have summary Web pages: their URLs display the scanned musical score in a standard browser window.
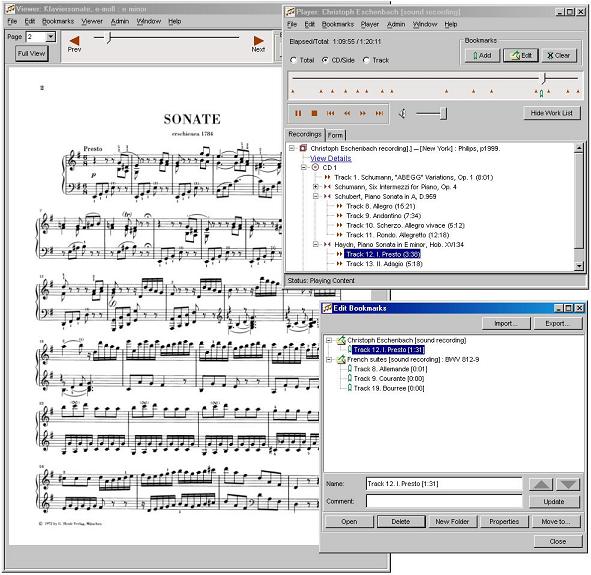
Variations2 is a completely new digital music library system under development as part of a research project (Variations2, 2003). Even though the Variations2 collection is quite limited at this point (approximately sixty recordings and six scores), it is already deployed in the music library and has experienced pilot usage by several faculty and their students. Variations2 also offers an audio player, but a score viewer and search window, along with additional functionality such as bookmarking, make Variations2 a far more capable system than the original Variations (see Figure 2).
We have completed two questionnaire-based studies of actual use. The first study looked at usage of Variations; the second study looked at usage of Variations2 during a pilot deployment. Both studies used a user satisfaction questionnaire adapted from QUIS (Chin, et al., 1988). The questionnaire contained a section for collecting demographic information, presented 11 subjective satisfaction ratings on 7-point Likert scales, and invited respondents to offer additional comments.
The purpose of the first study was to establish a baseline for user satisfaction with the existing DL implementation. Students in the Cook Music Library were recruited as they entered the computer laboratory. Thirty students who used Variations during their visit completed a printed questionnaire after completing their planned work and received a gift certificate as compensation for their participation. While we could have surveyed music students at large (nearly all of whom use Variations regularly), we wanted to get questionnaire responses immediately after a specific experience with Variations rather than simply asking for their general feelings about the software.
The purpose of the second study was to get an early comparative reading of user satisfaction with the new DL, again taking that reading after a specific experience. Variations2 is not yet in broad use because of its limited catalogue size, so we selected a particular class assignment for the pilot. Approximately thirty students in a graduate, song literature class were asked to complete a listening assignment (students listen to several songs and write an analysis of each), but for this pilot, they were required to use Variations2 instead of Variations. Before the pilot, students were given a brief introduction to Variations2 along with a demonstration. The assignment was presented as a Web page with hyperlinks to each of the songs (M531 Schubert listening assignment, 2002). For each song, students could access a recording, the score, and the song text in German and English. The song texts were provided in the score viewer as scanned images even though they were not scores. The Web page also invited them to click on a link and complete a Web-based satisfaction questionnaire after completing the assignment, but no compensation was offered for doing so. Twelve students submitted questionnaires.
Detailed findings from the first study (Variations) are available in a technical report (Swan, 2002a). A summary of findings is given in Table 1. A number in parentheses following a comment indicates how many respondents made a similar comment.
| Topic | Findings (n=30) |
|---|---|
| Frequency of Variations use | 26 use Variations at least once a week. 7 of these use it more than 5 times per week. 14 had first used Variations more than 2 years ago. |
| Purpose for using Variations | 17 were studying for an exam or completing an assignment for class. 5 were doing personal listening. |
| Satisfaction ratings | Overall mean: 5.56 (1-7 scale). All items averaged above 5 except for "slow...fast", for which the average was 4.77. |
| Positive comments | "Very useful" (2); "simply tremendous to use...a veritable heaven for all musicians here". |
| Negative comments | Waiting to retrieve recordings and the inability to launch multiple retrievals simultaneously (7); difficulty in moving to a specific point in a recording and the delay in hearing the music (2); sound skipping or cutting off (2). |
| Recommendations | Provide more detailed information (liner notes, track times, etc.) (3); more music or types of music (2); improved search (2). |
The satisfaction ratings from the second study (Variations2 pilot assignment) are compared with the ratings from the first study in Notess & Swan (2003). A summary of findings is given in Table 2. Note that even though we were studying Variations2 use, we also asked the questions about Variations use.
| Topic | Findings (n=12) |
|---|---|
| Frequency of Variations use | All use Variations twice a week or more; 3 use it five times a week or more. |
| Typical purposes for using Variations | Class assignments, listening to course reserves, or exam preparation (11); performance or voice lesson preparation (11); personal listening or pleasure (4); research (1). |
| Satisfaction ratings | Overall mean: 5.38 (1-7 scale). All items averaged 5 or above except for "number of screens/windows: confusing - very clear", for which the average was 4.86. |
| Positive comments | Five students specifically praised the easy availability of the scores and song texts, saying that it saves time and improves the overall experience: "my listening was accelerated greatly because I could reference the translations at any time", "great to have the translations and text handy, saves time as well---great program", "I love that I can look at a score and the text while listening to a song! That saves me so much time & my experience is 10x better because of it. Thanks.". Other positive comments mentioned the speed improvement over Variations (2). |
| Negative comments | Students offered disparate complaints. The only issue mentioned by more than one student was the difficulty of handling the many windows (2). Most respondents offered just one critique although one respondent offered five thoughtful, well-described user interface issues. |
| Recommendations | Two students mentioned that they would like to have a "repeat" option--Variations does this but Variations2 does not. |
The Variations2 software logs user activity. For this study we examined log files generated during the song literature pilot assignment mentioned above. Unlike many action log studies of digital libraries (e.g., Jones, et al., 2000), users in our study were not searching for items in a digital library. Because items in the pilot assignment were pre-identified, students did not need to search. They merely opened the item and used it.
Each log file entry contains a timestamp, an identifier for the window, and information about the user action. Hence, logging captures information about window opening, closing and resizing; button pressing, etc.
Text-based log files are easily processed by scripts. We developed some basic tools for extracting each session from the log file into a separate text file and creating a summary file showing the length of each session and the materials accessed. Beyond that we did not use any specialized tools. Analysis has been performed using Unix text processing command line tools.
A second form of analysis is the manual examination of a log file to try to reconstruct what the user did. The researcher walks through an individual session file performing a step-by-step analysis to interpret the user's experience.
Table 3 shows a selection of metrics that were generated from the log files. Although there were 175 total sessions, only sessions that included accessing media were analysed. The other sessions were either failed or neglected login attempts (13) or sessions where Variations2 was launched from the Start menu (34). In these latter cases, zero or more searches were performed but no items were opened.
| Measure | Results |
|---|---|
| Number of sessions | 128 |
| Average session length | 30 minutes |
| Average number of items accessed | 3.5 |
| Maximum number of windows open at one time | 7 |
| Maximum number of sessions in one day | 11 |
| Sessions using bookmarking functionality | 11% (14/128) |
| Sessions where any menu item was selected | 17% (22/128) |
| Sessions where record details were viewed | 23% (30/128) |
| Total "stop" button presses | 200 |
| Total "pause" button presses | 385 |
| Total "play" button presses | 588 |
| Total number of manual slider adjustments | 295 |
Manual analysis yields a picture of an individual session. We have not completed manual analysis for the sessions, but we offer a narrative representation for one complete fifteen-minute session below as an example, using a pseudonym for the anonymous user.
Karita began her session by clicking on the first song (3:02 in length) on the pilot assignment Web page. It took 28 seconds for her to log in, see the audio player, and hear the song. 16 seconds later, she paused the audio. 81 seconds later Karita clicked on the hyperlink in the audio player to view the detailed bibliographic information of the recording. After 6 seconds, she clicked on the score link on the assignment Web page. The score viewer took 11 seconds to appear. 45 seconds later, she closed the 'view details' window and maximized the score viewer. After 9 seconds, she clicked the 'Zoom in' button (zoomed to 70%). 7 seconds later, in the audio player, she clicked the 'rewind' button and then pressed 'play'. 20 seconds later, Karita clicked the 'next page' arrow in the score viewer (the score for the song is two pages long). 28 seconds later, she clicked the 'previous page' arrow (the song has a repeat of all but the two-measure introduction). After 27 seconds, she again went to the second page, and after 30 more seconds, again back to the first page. 18 seconds later, Karita brought up the song text and translation by clicking on the Web page link. The text viewer took only 3 seconds to appear. Karita immediately maximized the text viewer window. After 14 seconds, she went to the next page in the text (the text is split across 2 pages). 27 seconds later she pressed the 'stop' button on the audio player (this is 10 seconds before the song's end, but the singing had stopped and it was evident from the decrescendo that the song was over). After 67 seconds, Karita restarted the audio by clicking on the track in the track list and pressing 'play'. She immediately paged back to the first page in the text viewer. 41 seconds later she clicked to go to the next page, and then quickly went back and forward again. 94 seconds later she stopped the player 30 seconds shy of the song's end. Then there was no activity for 3 minutes, after which she restarted the audio as before and moved the slider twice to listen to specific parts of the song (for 11 and 21 seconds, respectively). Following a 69-second break, she proceeded to the second song in the listening list. The second audio player took only 3 seconds to appear. Karita then closed the first player, stopped the second one with the 'stop' button and then closed each of the remaining windows, ending the session.
This session does not reveal any major issues. The slow initial startup is a known problem. The incident at the end of the session (starting a new audio player and then ending the session) is enigmatic but uninterpretable from the session's data. Looking at an immediately subsequent session from the same network address, we can guess that Karita started a new session 42 minutes long and completed the entire assignment in these two sessions. But the reason for closing all the windows and then starting a new session 16 seconds later remains unknown.
A minor issue raised by this session is that Karita uses the 'stop' button and a click on the track list to go back to the beginning of the song. The Variations2 'stop' button rewinds the recording all the way to the beginning, unlike the Variations 'stop' button, which maintains playback position (analogous to 'pause').
Knowing the nature of this specific assignment, we can make guesses about the reason for the gaps in listening: the student was writing up the song analysis, which is the deliverable for this assignment. But this is merely a guess.
Contextual inquiry is a field study technique combining observation and interview methods to gain an interpretation of work practice (Beyer & Holtzblatt, 1998). The researcher watches someone doing normal work activity, takes notes, and asks questions to ensure a shared interpretation of the activity. Beyer & Holtzblatt's Contextual Design process adds on to contextual inquiry a method for building work models (diagrams) with the inquiry data. The present study used both contextual inquiry and the work modelling process.
Four graduate voice students (3 male, 1 female) were observed during 14 contextual inquiry sessions that focused on information usage patterns in academic study. Participants were selected from among volunteers recruited in a graduate song literature class. Participants received a gift certificate for participating in up to 5 hours of sessions. We observed a range of academic activities. Although we mainly observed library work, we wanted to get a holistic picture of the students' information-related activities, so we also included observations of voice lessons, a class session and a rehearsal. The library work often included use of Variations, but not Variations2, which at that time had an extremely limited amount of content.
For each contextual inquiry session, the participants were asked to do whatever work they needed to do next and were observed in their usual contexts, typically a library computer carrel or work table. While a participant worked, the researcher took handwritten notes. Discussion of the work sometimes happened during the observations, and the sessions nearly always ended with a discussion of the observed activity. The focus of both the observations and discussions was to understand what the user was doing and why. Especially of interest were any problems participants encountered in their work (breakdowns).
Most of the observations (10/14) occurred in the music library. Kinds of activities observed include the following:
Contextual inquiry generates a large amount of data, and the work models themselves are also detailed and extensive. This paper presents a fraction of the findings to give a flavour for the kind of results achievable with this research method. Of the various work models constructed from the data, the sequence model was the most interesting. A sequence model captures the step-by-step actions users take to accomplish an intent. Multiple sequence models can be consolidated to derive typical task sequences for a category of work. Table 4 shows a high-level view of a consolidated sequence model. The contextual inquiry data from the library observations consolidated into two typical sequences, 'study in detail' and 'collect and select'. The two consolidated sequences share their overall activity structure (shown in the first column) and also share some steps (shown by the table cells that span both of the right-hand columns). Although there were indications (and it is rather obvious) that the 'collect and select' consolidated sequence is sometimes followed by 'study in detail', none of the sessions included both.
| Activity | "Study in Detail" | "Collect and Select" |
|---|---|---|
| Prepare to do library work | - get headphones - find available carrel - locate assignment - log in and locate on-line tools |
|
| - select piece to study
- retrieve known recording - retrieve known auxiliary materials (scores, texts, reference works) | ||
| Work with library materials | - study material (listen, and follow along in score and/or
text; repeat whole piece or key parts) - make personal notes to capture key points gleaned from studying |
- find candidate materials - examine many details quickly to decide which to select (listen, check length, performer, key, etc.) - make personal notes to guide selection |
| - write assignment deliverable | ||
| Wrap-up the work | - preserve notes and/or assignment deliverable
(email to self, save on Zip disk or network drive, print) - log out - pack up - return reserve materials - return headphones |
|
For each of the sequence steps, there is a further level of detail showing some of the variation in how the work is performed and the breakdowns (problems) that can occur. For example, Table 5 shows the three ways to "retrieve known recording" from the "study in detail" task sequence. "BD" indicates a breakdown.
| Option 1: | Option 2: | Option 3: |
|---|---|---|
|
- Find course reserve list - Scroll to desired recording (BD: reserve list may be very long) - Select item (BD: easy to pick wrong item due to title similarities) |
- Looking at assignment sheet, type Variations URL for item in browser field |
- Enter search terms in online catalogue - Scroll through search results to find desired item (BD: easy to pick wrong item due to title similarities and lack of distinct visited-link colour) - Select item |
| Common final step: - Select CD/Side within Variations Web page to retrieve item |
||
Each of the breakdowns in Table 5 provides an opportunity for improving usability in the existing product or points out a difficulty to consider in the design of a new product. The different approaches to accomplishing the work indicate differences between users (e.g., willingness to type in a long URL), as well as between faculty (e.g., willingness to put the item URL on an assignment sheet and hand it out to students).
User study methods can be compared in several dimensions. From the perspective of research methodology, the satisfaction questionnaires and log analysis are primarily quantitative whereas contextual inquiry is a qualitative approach. Using Wilson's (2002) methods classification, satisfaction questionnaires are an indirect, imposed method of observation; contextual inquiry and log analysis are both direct, emergent forms of observation, albeit very different ones. For broad descriptions of and comparisons amongst user study methods, see Kuniavsky (2003). The paper by Covey (2002) provides a survey of how such methods are currently used in research libraries, and Bishop, et al., (2003) contains a variety of digital library user study reports.
In this section, we will describe our experience with each of the methods we used in terms of the expertise and time required, other costs, and the kind of benefit derived. In examining benefits, we consider whether the results seem most helpful formatively (for design) and/or summatively (for overall system assessment).
The chief expertise required for our questionnaire studies was survey design. The need for this expertise was moderately reduced because we borrowed ideas and items from an established user satisfaction instrument (Chin, et al., 1988). However, survey design was still important because we wanted to modify the survey to fit our study, which included adding items. Some Web form processing technical expertise was required to set up the online survey.
For the first questionnaire, conducted at point of use in the library, we spent three separate three-hour sessions recruiting participants. After we collected the paper surveys, it took a half-day to transcribe the results. The second questionnaire, conducted online, took a half-day to create, aided by a survey generator tool (Perlman, n.d.). This survey took no time to administer and several minutes to copy and paste the e-mailed responses into a text file, which was then imported into a spreadsheet. For both questionnaires, analysis time was limited to a half-day spent categorizing the free response data and summarizing the demographic and Likert-scale items. An additional cost of the first questionnaire study was providing gift certificates worth $3 for each of the 30 participants.
The benefit derived from the survey data was mainly summative: the ability to compare between Variations and Variations2, identifying major differences. The formative benefit was not large. Although we learn key satisfiers, dissatisfiers, and opportunities for improvement, the findings tended to confirm things we already knew or suspected. For example, we expected students would appreciate not having to wait while recordings were copied from tape to disk, and in fact the Variations2 survey results confirmed this. But the survey's open-ended items also yielded insights we did not expect, e.g., that students were delighted with the online scores because they felt they were wasting time hunting down scores in the library. This insight suggests an area for further investigation so that we can better characterize the benefit of Variations2 to library patrons. Also helpful were the five recommendations for user interface improvement from one respondent. But many of the open-ended item responses were unhelpfully cryptic (e.g., "I love Variations!", while heartening, doesn't give us much to work on).
Our session logging study required significant technical expertise. To log user activity, we had to insert statements into our program at the appropriate places so that, when users click a button or take some other action in Variations2, the program writes out a record of that action to the log file. This required expertise in Java programming as well as access to the source code. Processing of the data was accomplished by writing some Perl scripts and running Unix commands. The detailed session analysis was accomplished by hand on paper but also required running Variations2 and examining logging output experimentally to try to reproduce the sequence of entries in the log file.
Once the logging mechanism was in place, the study took no time to execute. Analysing the results has taken several days and is still incomplete. For example, analysing the fifteen-minute session included in this paper took approximately two hours and is the only session we have yet analysed in detail. To analyse and summarize all sixty-four hours of data would be a full-time job for several months. There were no additional costs for this study beyond disk space, which only amounted to a trivial 1.4MB for all the log files.
The main benefit of the session logging data was obtaining accurate, quantitative measures of overall utilization and feature usage. These data may identify usability problems or issues addressable either by training or software modification, but the benefit is more summative. Part of the problem is that the log files do not tell us anything about user motivation or rationale. For instance, we noted that only 11% of user sessions used bookmarking. But we do not know why the other 89% did not make use of this feature. Was it because they did not see the feature? Or because they did not need it for the tasks they were doing? We can only guess.
Detailed log file analysis offers more promise in providing formative insights, but such analysis can likewise raise as many questions as it answers. Why did the user close all the windows after opening the second audio player and then immediately restart? Log file analysis raises such questions; other methods must answer them.
The contextual inquiries and subsequent analysis required expertise in the Contextual Design methodology, a skill best developed by guided practice under expert supervision.
The inquiry sessions took eight to ten hours to plan and arrange, including visiting a class to explain the study and recruit participants, and email exchanges with participants to schedule the sessions. Because contextual inquiry is a real-time method, the fourteen inquiries of one to two hours in length took approximately twenty-four hours to conduct. Creating the work models and then putting them into a presentable format took approximately ten days. An additional cost of this study was $25 gift certificates for each of the four participants.
Contextual inquiry illuminated how our tools fit into users' tasks and contexts. A strength of the method is the comprehensive user stories it generates. The stories are also detailed (because of the observations and note taking) and memorable (because they were seen first hand). We have used contextual inquiry data to make design decisions and prioritize requirements, a significant formative benefit. The researcher who conducted the inquiries internalized much of the data simply by observing, but the modelling process helped identify patterns and made the results sharable with the other members of the development team. The small number of subjects in this study limited the summative benefit.
Without exception, the contextual inquiry participants (people being observed) were enthusiastic about the process. They enjoyed sharing their work and life with someone who was interested in understanding it and possibly improving it. Scheduling observations was sometimes difficult because of the students' busy schedules. Because of this, contextual inquiry is not a method to be used on a very short time schedule.
Method choice depends on available resources and objectives. Table 6 summarizes our experience with these three methods. The values in this table are approximate and represent what happened in our particular studies.
| Satisfaction Questionnaire | Session Activity Logging | Contextual Inquiry | |
|---|---|---|---|
| Expertise | survey design | technical (programming, scripting) | observation, interviewing, work modelling |
| Time to set up | moderate | low | moderate |
| Time to conduct | none (online) to moderate (recruit & use paper survey) | none | high, longitudinal |
| Time to analyse | low | moderate (metrics generation) to very high (manual analysis of all files) | high |
| Benefit | primarily summative; can uncover some topics for further investigation | summative (metrics generation) and formative (manual analysis) | primarily formative |
It is not necessary, of course, to use these methods in isolation from one another. We are using all these methods in our research and development effort, and it can be very helpful to compare findings amongst methods. For example, the lowest-rated item in the Variations2 satisfaction survey was 'number of screens/windows: confusing - very clear'. Our log analysis helps us determine how many windows users had open at one time (maximum was seven). This combined information on usage patterns and satisfaction can help us seek better design solutions. For example, we are now working on a playlist concept so that students' listening pieces for a given unit may all be accessed from within a single window.
Contextual inquiry, because of its high cost, cannot be done often enough to provide quantitative data. So even though we discovered two common work activities, 'collect and select' and 'study in detail', contextual inquiry will not tell us what proportion of users engage in which type of activity. However, it is a simple matter to use a questionnaire to determine this, and we can base the questionnaire items on the task steps uncovered by contextual inquiry.
This paper has described using three methods to study digital library use in its natural setting and has also compared the costs and benefits of the methods. Each of these methods has its value, and we plan to continue using all three. The time required for contextual inquiry can be reduced simply by doing fewer sessions. Watching even one user is likely better than watching none. We can build better tools for analysing log files, perhaps automating much of the metrics generation. Questionnaires offer an inexpensive albeit gross measure of user satisfaction and occasionally yield helpful suggestions. And all three methods can be fruitfully combined to provide a more holistic picture of use.
A limitation of this paper is that we did not apply all three methods to the same digital library: the studies were split between Variations and Variations2. A future opportunity is to use all three methods during a pilot project and compare the value of the results. In addition, findings from these studies of usage should be compared to findings from laboratory-based testing to help us better understand the difference between the two contexts. Finally, we plan to compare findings from different user populations to see how DL use by, e.g., a small sample of graduate voice students compares to other user communities.
The author acknowledges all the members of the Variations2 team for their help with this research. Jon Dunn, Maggie Swan, and Michelle Dalmau provided helpful review. Special thanks are due to Gary Arvin for granting access to his excellent students, to whom also thanks.
This material is based upon work supported by the National Science Foundation under Grant No. 9909068. Any opinions, findings, and conclusions or recommendations expressed in this material are those of the author and do not necessarily reflect the views of the National Science Foundation.
| Find other papers on this subject |
© the author, 2004. Last updated: 31 March, 2004 |