BOOK AND SOFTWARE REVIEWS
Wainer, Howard. Picturing the uncertain world: how to understand, communicate, and control uncertainty through graphical display. Princeton, NJ: Princeton University Press, 2009. xviii, 244 pp. ISBN 978-0-691-13759-9 $29.95/£17.95
I had not previously encountered the work of Howard Wainer, but he is the also the author of about a dozen works, including Visual revelations: graphical tales of fate and deception from Napoleon Bonaparte to Ross Perot and Graphic Discovery: a trout in the milk and other visual adventures, both of which, as you see, are devoted to the application of graphics in the analysis and presentation of data.
While tables are often used to present data and, indeed, for very large data sets, they may be essential, it is often the case that more is hidden in a table than is revealed by it. Wainer quotes the American economists Arthur and Henry Fahrquhar: 'getting information from a table is like extracting sunlight from a cucumber' (whether or not they acknowledge a debt to Dean Swift is not reported.) The object of graphs and charts, then, is to present the data from the table in more effective, readily appreciated ways.
Wainer begins with an apparently simple (or if not simple, then very common) question about how much we need to live in comfortable retirement. As his friend and financial adviser says, success is when the cheque to the undertaker bounces, i.e., it is better to spend everything before we die rather than leave the money behind. However, there are so many uncertainties associated with this issue, such as how long we are likely to live, economic inflation, our changing needs and habits, etc., etc., that coming to a decision on how to manage our money is not easy.
Uncertainties of this kind affect not only our personal lives and decisions but the lives of others, the life of society and the various political and economic problems that concern us. The author's aim is to show how the graphical representation of data can help us to get to grips with problems and, possibly, help to solve them.
The book is divided into sections: 1: Introduction and overview; 2: Political issues; 3: Educational testing; 4: Mostly methodological; 5: History and 6: Epilogue. Each chapter, apart from the introductory first (and, of course, the Epilogue), discusses a particular problem and shows how the use, and misuse of statistics, can exacerbate the problem and how correct interpretation, aided by graphs, can be achieved. One of his most telling examples is in Chapter 3, where he gives an account of how George Schultz, former US Secretary of the Treasury and, later, Secretary of State, sought to demonstrate that President Clinton inherited a situation of good employment and left a legacy of poor employment for George Bush. It turns out that Schultz was using a 'derivative', i.e., a measure derived from the base statistics of employment, and when the base statistics are used, lo and behold, exactly the opposite is demonstrated. Schultz demonstrated the use of the 'political statistic', Wainer shows the reality: employment declined under Bush I, rose under Clinton and declined again under Bush II.
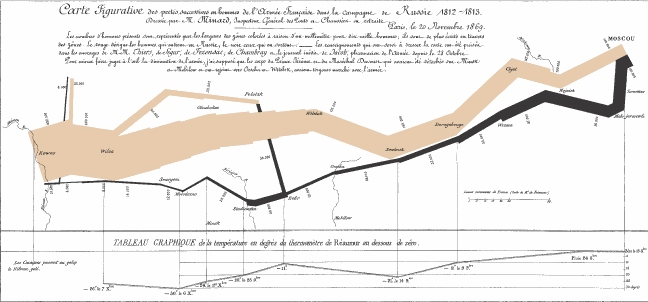
The 'history' section has some fascinating stories: one concerns the misuse of graphics, when Tom Stein attempted to use as a model Minard's famous graph of the progress of Napoleon's Russian campaign (Figure 1) to plot the effect of the merger of AOL and Time Warner in an article for Wired magazine.

Wainer demonstrates that the misguided adoption of Minard's graph as a model hides more information than it reveals and concludes:
But I may be too harsh in my criticism. Perhaps Stein's use of Minard's metaphor is more subtle. Maybe his point was that bad corporate decisions are well represented by bad graphical decisions; rougly akin to using poor handwriting to recount an ugle story. Such metaphoric parallelisms are rarely a formula for effective communication.
Some chapters may be rather too technical for the non-statistician, especially in the Methodology section, but generally, Wainer tells his stories simply and with humour. His chapter on the inventor of most forms of graph (William Playfair (1759-1823)) is well worth reading to remind us of what a major innovation it was.
Highly recommended for anyone with an interest in the presentation of data - which ought to be any researcher.