vol. 16 no. 4, December, 2011
vol. 16 no. 4, December, 2011 | ||||
According to the 2000 US Census, of the 128,279,228 Americans age 16 and older who commute to work, 6,067,703 use the subways (U.S. Census Bureau 2004). In New York City alone, the number of subway journeys made in 2009 was 1,604,198,017 (Metropolitan Transportation Authority 2011). Yet, there is very little publicly available research on the information behaviour of subway commuters, and particularly New York City subway commuters. To fill in this information gap, we have engaged in a study probing media consumption trends of New York City subway riders. We felt that the study would be particularly timely considering the plans to introduce wireless service on the Metropolitan Transportation Authority's underground sections (Transit Wireless 2010), since it could quantify the social value of extending cellular service into the majority of the areas serviced by the New York City subway lines.
We applied a number of methods, including observation, interview, and survey to examine the types and purposes of information devices used on New York City subways.
The article reviews relevant studies of travellers' behaviour, describes methods used in our research, reports and discusses results, and outlines directions for future investigations of commuters' information behaviour.
Reviewed literature can be divided into three broad categories: 1) papers that discuss classifications of commuters' behaviour; 2) articles that suggest technical solutions to address certain commuters' information needs; and 3) scientific and non-scientific publications about commuters' preferences for information media and activities.
One of the few classifications of commuters' information activities can be found in Flamm (2005). The author argues that travel time should not be considered dead time, but rather a transitional space in which travellers participate in a multitude of activities. Flamm interviewed twenty subjects from major metropolitan areas in Switzerland (Geneva, Lausanne, Bern and Basel) and based on their responses derived three main categories of travellers' activities: 1) productive activities, 2) relaxation and transition related activities, and 3) social activities. In Flamm's classification, productive activities relate both to work and leisure: work-related activities include planning tasks, writing or reviewing documents, and talking to colleagues, while leisure-related activities include reading newspapers or books. Relaxation activities include listening to music, daydreaming, dozing and playing games. Social activities are related to maintaining social relationships with family or friends, and include observing surroundings.
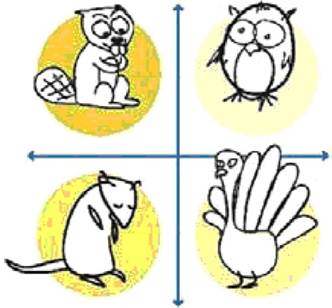
Several classifications of commuters' activities are reviewed in Brossard et al. (2009). The authors describe an information portal that was designed considering travellers' attitudes and emotions. The portal organized information into the following rubrics based on commuters' interests: communication, transport, general, leisure, and work-related information. One of the studies referenced in Brossard et al. (2009) was conducted by Viatic Mobilite team, which classified commuters based on levels of concentration and openness to others (Figure 1). Viatic researchers (as cited in Brossard et al. 2009) used zoomorphic labels to define the categories, which include (1) beavers that engage in productive activities, (2) owls that feel lost and look for information, (3) peacocks that are showing off, and (4) marmots that rest (clockwise from top left in Figure 1).
Similar classification is mentioned in the Akesson and Nilsson (2002) study. Even though researchers focused on the activities of car commuters, the categories of the identified activities are similar to the previous classification, and include vocational, mundane and traffic-related activities (see Table 1)
| Category | Examples | Direction of use |
|---|---|---|
| Vocational | Read documents | Going to work |
| Mundane | Keep in contact with friends | Going home |
| Traffic related | Traffic situation at a certain place | Both ways |
Akesson and Nilsson found a variation in the activities commuters were engagingin on the way to work, versus those they pursued returning from work. For example, on the way to work most of the activities were work-related, such as plan a day or sync a calendar; while on the way from work most of the activities were leisure-related, such as calling a friend. The interviews revealed that possible desired activities that commuters would have preferred to engage in had they had the right technology and/or application evolved around the three categories: vocational, mundane and traffic related.
While the reviewed classifications differ in the number of categories and methods used to develop them, they all include some forms of productive and leisurely activities.
An example of a study that developed and tested a software application for commuters' use can be found in Belloni et al. (2009). The authors developed and tested the use of a mobile friend-finding application on the subway system in Stockholm. As part of the study, the authors asked eight subway users to document their journey experience by taking photographs from their mobile phones. The authors provided emotional criteria for taking pictures, and asked participants to imagine 'something good during their journey, something unexpected, something that makes the journey shorter, unique, annoying, something to be changed, something of their choice' (Bellonie et al. 2009: 4545). Analysis of the participants' photographs, which the authors refer to as 'cultural probes', suggested the presence of isolated and lonely experiences during subway commuting. To mitigate the negative effects of commute, the authors developed a mobile phone application that notified commuters when their friends were on the same train. The authors argue that the application shows the possibilities of changing commuting from an isolated experience into a social one.
A number of the examined publications focused on the use of specific information devices or applications for these devices by commuters. Grasi et al. (2009) examined the use of mobile phones to relieve stress and anxiety. The authors found that students who used mobile devices during their commute to listen to music and watch videos were less stressed. The students also felt better, because they had the sense of accomplishment during their commute. Similar findings can be found in the sociological research of commuting patterns by Lyons and Urry (2004), who note that technology has helped to make travel more productive, and many commuters prefer to use public transportation, rather than car, because they can use the time productively.
Paez and Whalen (2010) examined university students' attitudes toward their commutes and derived results similar to the Grasi et al. (2009) study. In particular, authors found that students seemed to enjoy their commute much more if they were able to engage in a productive activity (e.g., doing work while sitting on a bus versus doing nothing while driving a car). Colbert and Livingstone (2006) examined ways to increase mobile technologies' usefulness during a commute. The authors asked twenty students to keep diaries and describe their commuting experiences in order to understand desirable conditions for use of cell phones for calls or texting. The study did not find any clear patterns regarding preferable public transportation conditions, since individual preferences or annoyances varied widely. However, the study findings suggested that participants preferred taking a bus or a train to driving. Some participants reported feeling comfortable making calls on a bus or train because it could provide a quiet and comfortable environment for the conversation. Others felt uncomfortable making calls with bystanders overhearing.
A number of more informal publications on the open Web and in the newspapers report the results of casual observations of travellers' behaviour. We chose to review some of these publications because they attest to the emerging public interest in the topic of information use on subway commutes.
Functionality of an Apple iPad is discussed in a blog entry from the UK (Baxevanis 2010); the author argues that all information activities commuters engage in can be performed on the Apple' iPad. Totilo (2010) discusses iPad capability as a gaming device for New York City subway commuters. Through interactions with other commuters and personal experiences in using the iPad, Totilo critiques some of the device's functionality (e.g., difficulties of using it on a crowded train.) Another blogger (Comeau 2010) reports his observations of the gaming device uses on the subway. He conducted informal observations and found that for every person using a portable gaming device, there were at least twenty people playing games on their smartphones (Comeau 2010). Comeau also points out that smartphone apps and games are a booming market while Nintendo and other gaming companies' profits are not as strong as they used to be. Furthermore, most people who already have a smartphone would prefer to only carry and use one device. He argues that with the introduction of iPad and iPhone, there is no longer a need to carry multiple devices (Comeau 2010).
Several articles in the New York Times looked at how New Yorkers spend their time on the train. Mainland (2009) tried to understand the reading habits of commuters by observing and interviewing New York City subway riders. The article focused primarily on books and described how people relate to their surroundings while reading. The author argues that it is the lack of Internet and mobile service access on the subway that keeps New Yorkers reading books on the subway rather than using electronic devices.
In summary, previous studies of travellers' behaviour reflect diversity of commuting experiences, and preferences for various types of activities and information devices. Our study extended earlier work by broadening the focus and examining the use of a wide variety of information devices on the New York City subway. Unlike most of the prior studies, we applied a number of methods and relied on larger samples to outline the landscape of information technology use by underground travellers.
Because of a lack of understanding of subway commuters' information behaviour and the absence of pre-existing models of this behaviour, the study was to a large extent exploratory in nature. We used observation, survey and interview to investigate the information behaviour of New York City commuters. We defined commuters' information behaviour as observable or self-reported interactions (or lack of interaction) with information media. These observable interactions or activities became a focus of our study.
The use of multiple methods allowed us to investigate the following research questions:
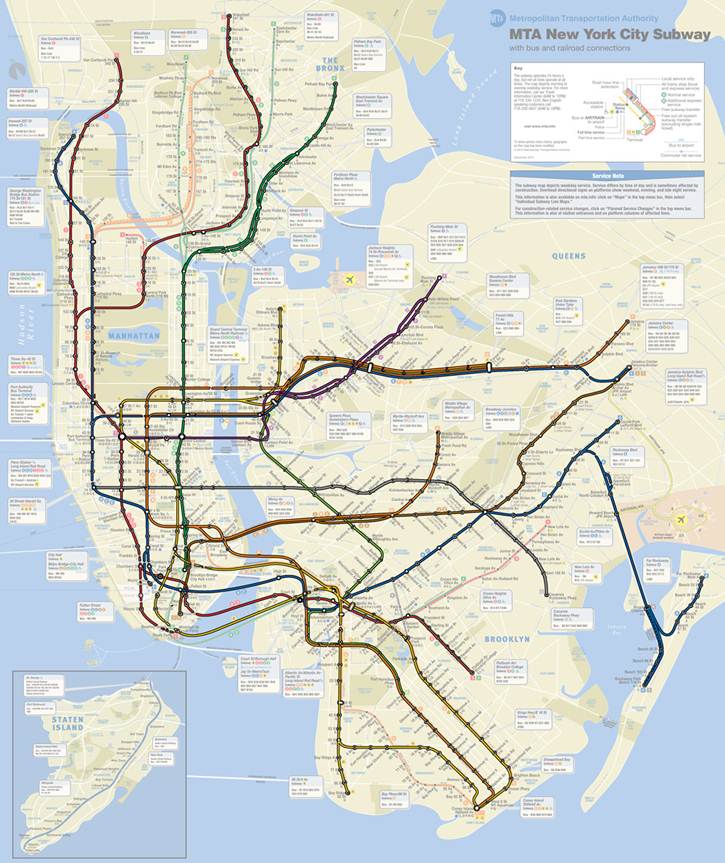
In order to examine the distribution and uses of information devices on the New York City subway, a series of observations were made between 24 September and 9 October 2010. Eight researchers made 154 observations of fifteen subway lines (see Figure 2 for the subway lines that were observed for the study). A total of 4,461 passengers was observed during different times of day and on various lengths of commute.
Upon entering a subway car, each researcher first counted the number of persons in the car, then noted down what media device each person was utilizing, and observed what they were doing on the device. After each stop, the passengers were re-counted and changes in the device presence and use were noted. Each subway car was observed by one researcher at a time. In cases where a subway car was extremely crowded, the observers estimated the total number of passengers visually but counted device usage in a specific portion of the car. We had hypothesized that subjects in more crowded cars would be less likely to use devices or media that required two hands to use, so observers made notes if the car was extremely crowded.
The observers performed unconcealed participant observations, but tried to remain discreet while making the observations. During each observation, field notes were taken in small notebooks or mobile devices. Observations were made between consecutive subway stations including end of the line stations where subjects were either only boarding or only leaving. Each observation consisted of a count of passengers (either exact or, in cases of extreme crowding, estimated) and a breakdown of print format and electronic devices being used by those passengers. Only observations with exact passenger counts were included in the analysis (N=122).
A pilot study was carried out before the main study to determine the range of information devices utilized on the New York City subway system. Based on the results of the pilot observations, we counted interactions with five traditional print media (books, magazines, printouts (including photocopies), notebooks, and newspapers) and five electronic device types (e-readers, laptop computers, music players, gaming devices and smartphones).
Multi-function devices such as iPods, smartphones and so forth can display text, play games, show video, and play music. They are also capable of two-way asynchronous communication through SMS texting and synchronous voice communication through the cellular network system or over VoIP networks. Since we were more interested in commuter activities (how the device is used) than device choice, we decided to count each of these uses separately. Smartphones and similar multi-use devices were grouped with single-purpose devices based on their observed use.
It was not possible to individually observe the screen of each handheld device, given the privacy considerations. Instead, several body-language clues were used to determine how a handheld device is being used (see Appendix A for the list of observed devices and information activities).
In addition to counting devices and their uses, we also counted two types of commuters' interactions with their surroundings. The first type was classified as 'staring at the walls of the cars/reading the car ads' and included instances when a traveller's gaze was obviously directed at the advertisement and/or poster on a wall. We assumed that staring is an active effort to obtaining textual or visual information from the sources designed to deliver a message. The second type of interaction with an environment was classified as 'doing nothing', a passive activity of commuters who did not interact with any information devices, only occasionally glanced at the walls of the subway cars, observed the environment without interacting with it, or appeared to be resting.
In addition to the passenger and media count, we recorded the date and time of the observation, the subway stations defining the start and end of the observation, whether the train was underground or above ground, an estimated crowding level, and any additional notes the observer thought might be relevant. Recording subway station and line enabled us to determine whether the observation was taken above ground, and consequently if wireless access was available for an augmented use of certain devices. It also helped us to ensure that our observations are covering wide area of the city and its diverse population.
In selecting the subway lines for the observations, we were primarily interestedin obtaining a representative sample of New York City population; therefore we selected the lines that connect various parts of town and various neighborhoods. While our observations did not cover every subway line, we feel that our sample is representative of the New York City subway system (Appendix E and Figure 2). In an attempt to obtain a representative sample of the commuters, our observations were also conducted at various times of the day, and on various days of the week (see Table 4 in Appendix A for the distribution of observations across various times of the day/week).
During our observations, we conducted thirteen short semi-structured informal interviews in an effort to determine how the passengers use their information devices and why. Nine males and four females were interviewed across eight different subway lines either in a subway car or on a platform. Each participant was chosen based on their willingness to discuss their devices on the condition of anonymity. Researchers approached subjects and secured permission to ask questions and use results in a paper. Most of the questions researchers asked were about the devices commuters carried and/or used, the nature of information tasks performed on the devices, and reasons for commuters' preference for specific devices. General demographic information with no identifying details was recorded (e.g., sex, approximate age). Interview notes were taken immediately after conversations. The text of the interview notes was coded to identify the themes related to commuters' use of information devices on the subway and is discussed in the Results section.
Analysis of the observation and interview data informed the design of a short survey that was created to better understand variables that might affect commuters' activities and preferences (Appendix B). The survey contained ten questions, four of which collected demographic data. The survey was created using the online SurveyMonkey application and took about five minutes to complete. The survey was distributed through the Pratt Institute library and information science school electronic mailing list, which has approximately 300 subscribers, who were asked to further distribute the survey, resulting in 460 responses. While the survey is based on convenience sample, it is an accepted method used in exploratory research (Grasi et al. 2009; Paez and Whalen 2010; Teevan et al. 2010), and represented demographically diverse group of New York City commuters (see Appendix C for the demographic information of the subway respondents).
Our exploratory study had a number of limitations. We used a convenience sample, which limits generalizability of our findings. We only observed subway lines, excluding other forms of public transportation (e.g., buses, ferries, taxi cabs). We did not observe all subway lines at all times of the day, and only glimpsed at a long list of all possible activities that were engaged in by commuters. When planning a study, we focused primarily on the travellers' interactions with information devices, and designed our survey and interviews accordingly. However, during the course of our observations we learned that a large number of commuters do not actively engage with any devices. Investigation of the commuters who do not interact with any devices would be an interesting focus for the future studies. Another limitation includes lack of a formal measure of inter-observer reliability which was monitored throughout study through observers' training and regular communication amongst research team members during the data collection phase of the project.
Most of the study's limitations were due to the novelty of our research on commuters' behaviour: we had to learn from our mistakes as we proceeded with the study. However, we think that our findings offer a good probe of the information universe of the New York City subway riders. We also think that due to the demographic diversity of New York City subway commuters, the information behaviour trends of commuters might represent trends in a broader population.
We spent 23.45 hours observing 4,461 people on fifteen lines (1, 2, 6, 7, A, C, E, F, G, J, L, M, N, Q, R) of the New York City subway system. We recorded observations for the following activities that we saw people engaging in: reading a book, reading an e-reader, typing or reading on a mobile phone, listening to music on a mobile device, making a call on a mobile phone, playing a game on a mobile gaming device, reading a newspaper, reading a magazine, reading printouts or photocopies, using a laptop computer, staring at advertising on the walls of the train, reading or writing in a notebook.
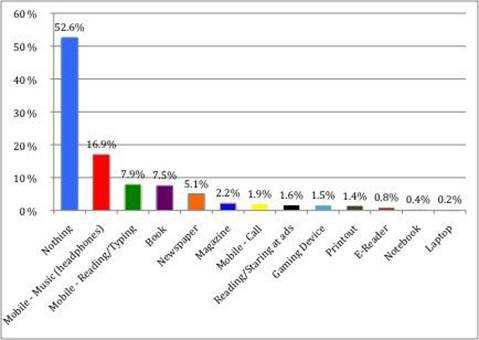
Most of the observed commuters did not engage with any type of information media (52.6%, see Figure 3). The most common activity among commuters who used information devices was listening to music on a mobile device, which was observed 756 times (16.9%). The second-most popular activity observed was reading or typing on a mobile phone (n=353, 7.9%), followed by reading books (n=336, 7.5%), newspapers (n= 227, 5.1%), and magazines (n=98, 2.2%). Mobile phone calls were observed 85 times (1.9%). Staring at advertising on the walls of the train was observed 71 times (1.6%), followed closely by playing a game on a mobile gaming device (n=68, 1.5%). Reading on an e-reader was observed 36 times (0.8%) and reading or writing in a notebook was observed 17 times (0.4%). Use of a laptop was the least frequently observed activity, accounting for 7 observations (0.2%).
In addition to analysing the frequency of observed devices and their uses, we examined whether frequencies of observed devices and activities were related to the subway line and the time of the day when the observation occurred. We hypothesized the existence of relationships between the type of devices commuters used and the subway line where the observation occurred. For example, commuters who take subway lines that go above ground will have cell phone reception that might lead to more frequent uses of their mobile devices, or certain subway lines might be taken by commuters coming from various socio-economic backgrounds that determine their ownership of certain devices. Similarly, we assumed that certain times of the day, such as during the morning rush hour, would be associated with certain commuting conditions (e.g., crowding) that would affect information device uses.
To examine the distribution of information devices and activities per subway line we conducted a frequency count, which indicated that listening to a music device with headphones was the most frequently observed activity on most of the observed lines (F, M, N, C, L, E, 7, A, J, and 6 lines.) Reading a book was the most frequently observed activity on the G and Q lines. Listening to music and mobile texting/typing were tied for the most frequently observed activity on the R line, while reading a book, listening to music and reading printouts were tied for the most frequently observed activity on the 2 line. We did not conduct a detailed analysis of the subway lines to identify the differences between their characteristics (e.g., passenger demographics), so results are linked to different subway lines to bring attention to the fact that the distribution of various devices is not homogeneous across lines.
We also used Lambda test of association (used on nominal data) to explore the relationships between subway line observed and type of devices used during the observations. Table 2 below shows Lambda values that represent relationships between dependent and independent variables. While the relationships between various types of information devices and subway lines where observations occurred were mostly weak, some relationships were stronger (and statistically significant) than others. Specifically, knowing a subway line can improve the prediction of whether commuters' are listening to the music (l = .194, p = 0.002), reading/typing on a mobile device (l = 0.184 , p= 0.000), calling (l = .163 , p = 0.000) or reading a book (l = .153, p =0.014) anywhere from 19.4% to 15.3%. Low Lambda values for other variables correlations suggest that staring at walls, reading printout, newspapers, and magazines, interacting with notebooks, e-readers, gaming devices and laptops do not significantly vary across different subway lines.
| All subway lines and activities | Lambda values | Approx. significance* |
|---|---|---|
| Music listening | 0.194 | 0.002 |
| Reading or typing on mobile | 0.184 | 0.000 |
| Calling | 0.163 | 0.000 |
| Books | 0.153 | 0.014 |
| Staring at walls | 0.082 | 0.031 |
| Printouts | 0.081 | 0.056 |
| Newspaper | 0.072 | 0.141 |
| Magazine | 0.071 | 0.191 |
| Notebook | 0.061 | 0.031 |
| eReaders | 0.041 | 0.479 |
| Gaming | 0.020 | 0.154 |
| Laptops | 0.010 | 0.315 |
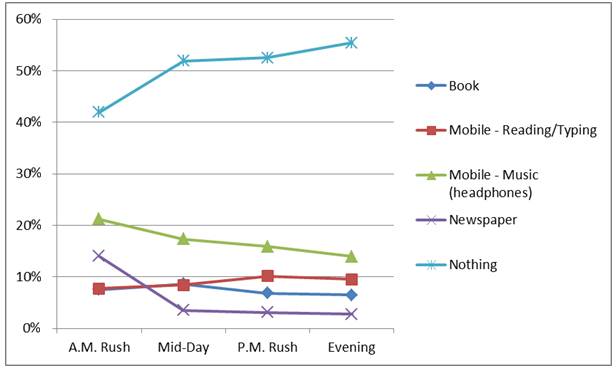
Analysis of the distribution of information activities and devices across various times of the day indicated that throughout the day, the most frequently observed activity was not actively using any information devices, or, in other words, doing nothing (see Figure 4). Listening to music was the most popular activity (N=756); it peaked in the morning (21.2%) and decreased during later hours (17%, 15.7%, 15.1%, respectively). Newspaper reading also peaked in the morning (14%) and dramatically decreased during mid-day, afternoon rush, and post-afternoon rush hours (4%, 3.4%, 3%, respectively). The distribution of the mobile device uses for reading and typing did not vary significantly throughout the day (7.7% for the morning rush hour, 6.8% mid-day, 9.1% afternoon rush hour, and 10.2% evening).
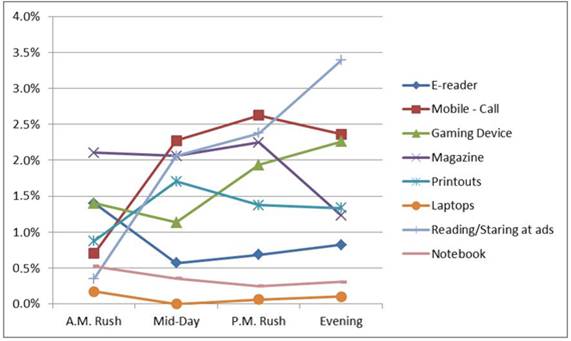
Several information activities were observed infrequently and comprised less than 5% of all commuters' activities (including passive engagements with the surroundings, see Figure 5). Among the relatively infrequent activities, staring at the car walls increased by 2.5% between morning and evening hours; calling from mobile phones was observed only 0.7% of times during the morning peak hours, but increased to 2.6% in the later times of the day; use of gaming devices increased during later hours (2.1%), while the magazine readership was steady throughout the day but went down in the evening hours (from 2.1% during morning rush hours to 1.9% in the evening). Distributions of certain activities peaked in various types of day (e.g., usage of e-readers peaked during the morning rush-hours at 1.4% compared to 0.6%, 0.7% and 0.8% during other time intervals), while readers of printouts increased during the mid-day commutes.
We compared the distribution of information activities on above ground trains (with wireless access) and underground trains (without wireless access). On the above ground trains we observed a higher number of mobile devices used for making calls, reading and typing, as well as more frequent reading of traditional books and passive observations of surroundings (combined in the Nothing category, see Figure 6).
During our observations, we have noted many activities that would be interesting to investigate in the future studies. For example, we observed New York City police officers using smartphones underground: it would be interesting to know how public servants use them and why. We have noted that certain train lines and commute times are associated with specific demographics (e.g., during rush hours, most of the riders of an observed New Jersey railway line were middle-aged males); such findings might inform future studies of the information behaviour of specific commuter populations.
Thirteen unstructured interviews were conducted by six researchers. Detailed notes were taken immediately after interviewing subway travellers. The text of the notes was analysed by two independent coders who identified the following themes: device type, purpose of device, preference for the device, and frequency of usage. The level of inter-coder agreement on identified themes was high (Cronbach's Alpha was calculated at 0.91, see Nunnaly 1978).
The devices most frequently mentioned were Apple's iPhone (n=4) and iPod (n=4). Participants reported using the iPhone for work-related tasks, such as reading PDFs (one participant noted: 'I usually get pretty into what I am reading and barely notice that I am using it [iPhone]'), gaming, and news applications.
iPod users reported using the device not solely for music, but also for podcasts. One particular interviewee noted the preference for the iPod on shorter commutes: 'I guess this trip is a short one, so the podcast is kind of nice. With really short trips I wouldn't bother with a book, I like to get into what I am reading'.
The most frequently mentioned activities were grouped into larger families based on the purpose commuters ascribed to activity: entertainment, textual or text-based, mobile device specific and work-related tasks (see Appendix B). The most frequent activity mentioned by interviewed commuters was listening to music, followed by reading books. Texting and e-mailing followed. Listening to music was often accompanied by another activity. For example, one participant remarked: 'I sometimes listen to music on it while I read the paper'. Both iPods and iPhones were mentioned as devices used for listening to music.
Four hundred and sixty (N=460) people completed the commuter survey between 8 and 29 October 2010. A copy of the survey can be found in Appendix C. A large percentage of the respondents (60%) reported using public transportation eleven or more times a week; the rest of the respondents used it less often. Three quarters of the respondents (75.7%) spend between 30 and 120 minutes daily commuting on public transportation. Fewer respondents (15.3%) spend less than 30 minutes on public transportation, and even fewer (9%) spend more than 120 minutes or more a day.
Participants were asked to identify activities they engaged in during commuting (more than one activity could be selected, see Figure 7). The most frequently identified activity on a train was reading printed material (18%) followed by observing people (17%) and listening to music (16%). Among the least frequently reported activities weremaking phone calls (2%), and watching videos (2%).
Participants were also asked to identify information devices that they use during the commute (see Figure 8). The most frequently reported activity was reading a book (22%), followed by the use of a smartphone (18%), music device (17%), reading a journal or magazine (14%), printouts or photocopies for school or work (14 %), newspaper (8%), reading from e-reader (3%), use of a laptop (2%), gaming device (1%), iPad or other tablet (1%).
When asked to identify factors that influence what they do on a train, the majority of the respondents choose crowding, followed by the length of commute (Figure 9). Ambient lighting and time of day were primarily identified as factors that somewhat influencewhat they do. Respondents were split in their estimation of importance of a subway line (underground or above ground) in choosing their activities during the commute. Forty-eight respondents said other factors influence what they do on a train, including seating availability (n=22), availability of company or friends (n=8), mood (n=6), destination (n=5), availability of information media (n=5) and noise levels (n=4).
The majority of respondents (65.6%) indicated that the addition of wireless or cell phone service in underground subway trains and stations would change their preferences for information devices.
Respondents' demographic characteristics are summarized in Appendix D. The majority of the respondents (60.1%) were between ages 25 and 34. Responses about the household income clustered around the opposite ends of the lowest and highest possible values. About a quarter of respondents reported a total household income of $100,000 per year or higher, 19.4% reported earning $20,000 to $29,999. Most of the respondents reported living in New York City's five boroughs, 41.7% reported Brooklyn as their place of residence, followed by 25.7% in Manhattan, 10.1% in Queens, 2.0% in Bronx, and 0.7% in Staten Island. The rest of the respondents reported living outside the New York. More than half of the respondents had been to college; the rest reported having a professional degree (2.6%) or a high school diploma (0.7%).
In addition to examining frequencies of survey responses, we ran a few correlations to explore the relationships between the types of devices respondents reported carrying and the types of activities they engaged in. We were interested to see whether preferences for certain devices correlated with preferences for certain types of activities. For example, if a person reported listening to the music or playing games, what was the most likely information device s/he would carry; or what are the most likely activities of the travellers who carry smartphones.
The survey responses to the questions related to activities and devices were dichotomously coded (1 for presence of response, and 0 for no response). We used nonparametric Phi test to examine the strength of the correlations between the device and activities variables (see Table 3). We only report on medium and large correlations (Phi > 0.2).
| Activity/ Device | Correlation strength (Phi) | Significance (p) |
|---|---|---|
| Read printed material | ||
| book | 0.519 | 0.000 |
| printout | 0.353 | 0.000 |
| magazine | 0.339 | 0.000 |
| newspaper | 0.227 | 0.000 |
| Read on electronic portable device | ||
| smartphone | 0.396 | 0.000 |
| e-reader | 0.354 | 0.000 |
| iPad | 0.234 | 0.000 |
| Play games | ||
| smartphone | 0.345 | 0.000 |
| gaming device | 0.273 | 0.000 |
| Listen to music | ||
| music device | 0.603 | 0.000 |
| smartphone | 0.527 | 0.000 |
| Text | ||
| smartphone | 0.274 | 0.015 |
| Watch video | ||
| laptop | 0.224 | 0.000 |
| Rest | ||
| printouts | 0.205 | 0.000 |
The correlation statistics suggest that an information device most frequently associated with reading print materials is the book, followed by printouts, magazines and newspapers. The most frequently mentioned device associated with reading electronic texts was the smartphone, followed by the e-reader, and the iPad. Smartphone ownership was also associated with a number of other activities, such as e-mailing, texting, and playing games. In fact, playing games had higher correlation with the ownership of a smartphone than a gaming device; and reading electronic texts had higher correlations with smartphones than specialized e-reading devices. We were interested to see whether there are relationships between the amount of time respondents spend commuting and their preferences for information devices and activities. We ran multiple regressions to examine how much variance of the commute time can be explained by the type of devices commuters carry and the types of activities they are engaged in. The regression model was statistically significant, but explained only 14% of the commute time variance (R2 = 0.142, F(21, 438) = 3.454, p = 0.000 at 95% confidence interval). Sleeping during commute was the strongest predictor of commute time, β = 0.187, t = 3.905, p = 0.000, followed by resting, with β = .121, t = 2.420, p = 0.016.
We also examined relationships between demographic variables, the types of devices respondents reported carrying and the types of activities they engaged in. We were interested to see whether ownership of certain devices or preferences for certain activities were associated with representatives of a particular population. We ran multiple regressions on commuters' age and their information devices and activities. The model explained about 17% of the age variance (R2 = 9.167, F(21, 437) = 4.174, p = 0.000 at 95% confidence interval). Listening to music was the strongest predictor of age, β =-0.225, t = 3.938, p = 0.000, suggesting that this activity was associated with younger commuters. We have to note that in this and other tests we chose not to interpret other independent variables' betas due to their relatively small size, even when they were statistically significant.
The identified correlations are illustrated in the Figure 10 below, where information activities are associated with 1) specific types of devices (e.g., electronic texts' reading is associated with smartphones); 2) commuters' demographic characteristics (e.g., music listening is associated with the younger commuters); and 3) commute time (e.g., the longer the commute, the more likely commuter will be resting or sleeping).

The study has explored the information behaviour of New York City subway commuters. The data for the study were collected through observations, interviews, and an electronic survey and analysed using a number of qualitative and quantitative techniques. Our analysis identified several overarching themes, some of which were supported by prior research (Akesson and Nilsson 2002; Flamm 2005; Brossard et al. 2009), while others were unique to our study. One of our significant findings is that information activities of travellers fall into several categories related to the level of engagement with the activity, and the situational factors influencing that activity.
We have classified the commuters' activities into two groups:
One of the reasons for avoiding a more detailed classification (e.g., classifying work-related and entertainment activities) is linked to the type of data collected. For example, by observing the travellers, we were not in a position to conclusively determine the intent of using an information device, even though, in some instances, we were able to speculate about the intended use (e.g., a fiction book is most likely read for entertainment purposes). Information behaviour categories identified in our study are discussed below. In addition to describing commuters' active and passive activities, we discuss the factors that influence (or might influence) them.
One of the most frequently observed and self-reported activities during commute was reading. The reasons for popularity of reading on New York City subway are outlined in Mainland (2009), who suggests that the subway commute offers a time of quiet and solitude, and that many travellers prefer to use this time productively (also supported by Grassi et al. 2009) Some of the commuters interviewed by Mainland (2009) reported studying dense religious texts, or studying acting sides, others reported using the time to read texts for entertainment purposes. Similar to the Mainland (2009) observations, our study confirmed the fondness New York commuters have for reading books, printouts, and electronic texts on e-readers, and other devices.
Books and smartphones were the most frequently observed and self-reported devices used during the commute. The phenomenon of traditional book readership on the subway warrants further, more detailed investigation. On the one hand, books are relatively heavy and bulky items to carry, compared with alternative devices for reading print and electronic formats, notably multipurpose devices like the smartphones and e-readers. On the other hand, books are inexpensive, can be borrowed, are independent from the availability of the wireless service or electrical power source, and some users may prefer their physical dimensions, etc. Future studies might investigate specific reasons for the popularity of books, as well as opportunities for information institutions to better satisfy commuters' reading needs, such as the book vending kiosks installed on some of the train stations in California (Kantor-Horning 2009).
A slightly higher percentage of self-reported book use compared to the observation data can be attributed to the limitations of the survey instrument that was primarily distributed to the library and information science community and associates. Higher book reading numbers in the survey might suggest that this community is more involved in book reading than other populations; the numbers might also reflect the bias of self-reporting since people might think of book reading as one of the activities that improves their image, and consequently over-report it.
In addition to books, other types of traditional media used for reading on a subway are newspapers, magazines and printouts. We observed that the use of these media is relatively low and varies during different times of the day. For example, newspaper reading during the morning hours can be correlated to commuters' habit to read their news in the morning (Readership Institute of Northwestern University 2002) and the distribution of free publications during the morning rush hour (e.g., Metro-New York. Reading from printouts or photocopies goes up at midday and slowly drops at later hours. It is very likely that printout is a medium that offers work-related information and the need for this type of information emerges during business hours. Future investigations would require the use of qualitative techniques for understanding the patterns of print media use throughout the day.
The most frequently observed electronic device used on a subway was the smartphone. This finding can be related to the high ownership of smartphones: according to Nielsen (2010), 28% of American wireless subscribers had smartphones as of the third quarter of 2010, and it is estimated that in one year that number will double. In addition, the smartphone's multipurpose functionality and portability allows for various activities. A young professional interviewed on an above ground train said that she uses her iPhone for browsing the Web, reading PDFs, writing, and responding to e-mails, and occasionally watching videos, and listening to music. She states that she does not 'want to carry around more than I have to'. Another commuter we observed was bent over her iPhone with furrowed brow reading a document on the small screen. When asked if she would consider ever using a specific electronic reader device she conceded that an iPad may be nice, but that her smartphone worked fine for now. With wider market penetration of smartphones and addition of wireless service, we hypothesize that in the near future, the number of smartphones uses on the New York City subways will increase.
Our statistical analysis of the survey data highlights a preference for reading electronic texts from smartphones rather than specialized e-reading devices. We observed a relatively low number of e-readers and iPads that were used for reading electronic texts. This observation might reflect a relatively low market penetration of such devices, even among sophisticated consumers like New Yorkers. One of the interviewed commuters noted that he was hesitant to carry expensive devices like iPads and e-readers for fear they would be stolen. It would be interesting to investigate the distribution of e-readers and iPads among subway commuters in the future, when those devices become cheaper and more available and as readers develop new habits for reading media.
In addition to reading, texting, e-mailing and calling require active attention. All of these activities were associated with smartphones and availability of wireless service which is currently limited to above ground trains. The interview data and our accidental observations of commuters' information devices (e.g., a glance at a laptop screen) also suggest that commuters engage in scheduling tasks, work-related activities (e.g., working on spreadsheets), writing and taking notes. We did not collect sufficient data about these tasks to draw any conclusions about their role in commuters' behaviour. Future studies might investigate what devices are preferred for work-related tasks, during what times of the day are commuters more likely to work on their information devices, and whether commuters consider engaging in these tasks an unpleasant necessity for catching up with work or an enjoyable use of their travel time.
While playing games is usually associated with entertainment or relaxation, we classified it under active activities since playing a game requires constant interaction with information media. Both the survey and observation data indicate that the majority of games played during commute are on smartphones or similar multi-function devices. Survey respondents reported playing games during commute (28.8%), but very few reported owning gaming devices (3.7%). The gaming capabilities of the last few generations of smartphone are almost on par with the Nintendo DS and allow the commuter to carry fewer devices. It is also possible that gaming on a mobile device that has more grown up uses makes commuters feel more mature or perhaps less embarrassed than they would feel using dedicated game machines in front of their peers. Games for smartphones tend to be much cheaper, often costing $1 US but in most cases less than $5. Games for Nintendo DSi and Sony PSP tend to cost between $20 and $30 US (Amazon, n.d.). While playing games offers an engaging alternative to passing travel time, it might require certain environmental conditions, such as availability of seating to free both hands for handing the device. Future studies might focus on examining the relationships between those factors as well as exploring demographic characteristics of subway gamers. Some of the observed gamers, e.g., a middle-aged well-dressed woman, did not meet a typical gamer stereotype suggesting that, perhaps, commute offers a unique anonymous environment that accommodates identity changes (Blumen 2000).
While reading, along with writing e-mails, texting, calling, playing games and other activities are all industrious activities, certain commuters' activities are more passive in nature. Listening to music and not interacting with any devices are the activities we classified as passive.
Listening to music is a popular form of entertainment for commuters. It was the most frequently observed activity (as inferred from the presence of headphones, Table 4 in Appendix A); it was the second most frequently reported activity from the survey (Figure 7). One of our interviewees who reported listening to music on a train did not seem to consider listening to her iPod as an active activity, but rather part of the commuter background experience. Listening to music is an effortless activity and could be related to the need to create personal space in an environment that otherwise does not have any.
Another possible explanation for the popularity of music on the subway is that this activity can be pursued in parallel with other activities. During our observations, we noticed some commuters had headphones on while using their smartphones for reading or typing of text messages or e-mails, or reading print material while listening to music. Interviewed passengers have reiterated that listening to music is a common and constant activity.
Through our analysis, we discovered some interesting patterns in the relationships between music listening and commuters' demographic characteristics. Specifically, we found that music listening was associated with the younger, lower income and lower education levels among the commuters (as outlined in Results). Future work can focus on investigating this correlation which might be linked to age-related preferences, availability of free time, convenience and cost (some of these devices might have been received for free with the purchase of 'Back to school' computers (Student buying guide 2010). Most smartphones store music and have applications for online radio, but standalone devices that play music are also prevalent and relatively inexpensive. Another explanation for the popularity of music devices among children, young adults, and college age students could be peer pressure. Similar pressures might exist for older higher-paid professionals who might be expected to carry e-readers, tablets, smartphones, and laptops by their community. Future work might focus on investigating commuters demographic and socio-cultural differences in relations to information devices and activities.
The majority of the observed commuters (53.7%) did not use any information devices while commuting. Our survey responses reported resting 46.6%, sleeping 20%, or observing other people 74.9% as activities in which they engaged most of the time. All of these activities can be classified as passive. Our analysis indicated that rest and sleeping were related to the length of the commute: the longer our respondents travelled, the more likely they were to rest or sleep. Choosing to relax instead of interacting with information devices might be related to the commuters' personality types, lack of ownership of various information devices, their vocations (e.g., the desire to relax after a busy day at work), length of commute, the time of the day (e.g., feeling sleepy during early-morning or late-night commute, rush hour or crowding of the train), and other factors. All these questions can be considered in the future studies.
Time of day and crowding of the train were reported as directly influencing the information activities of commuters. Newspaper reading is most affected by time of day, with a significant increase in the morning hours (Figure 4). Information and news are time-sensitive, and newspapers have high availability in the morning hours. This availability and convenience influence use. Interview data also suggest a desire for news in the morning as preparation for the day.
In the late evening hours, a significant increase in passive activities was observed, suggesting that people are tired or are less focused on active activities such as reading and writing. Listening to music and doing nothing are passive activities that increase late into the night.
Rush hours and crowding of the train are influential in the type of activity commuters pursued. According to our survey results, 72.6% of respondents are heavily influenced by crowding relative to what device they use while commuting, and a high proportion of Other fill in responses indicated that if a commuter cannot find a seat on the train that would also influence behaviour and choice of device.
Crowding is likely to reduce activities that require two hands or the need to spread out. One may be less inclined to read a book, or a newspaper in a crowded situation. It is also less likely that commuters would use expensive devices like e-readers, tablets, and laptops as crowding may heavily influence the likelihood of devices being stolen. Passive activities such as listening to music, resting, and observing other people frees commuters' hands for holding the rails or maintaining their balance on the moving train.
During all of our observations we noted that the subway cars were adequately lit. Survey respondents did not identify lighting as a factor that influences what they do on a train, making us believe that lighting on subway trains is adequate for most of the activities travellers choose to perform.
Our research coincides with the New York City Metropolitan Transit Authority's decision to implement an underground wireless network. On 26 July 2010, Transit Wireless made an official announcement that they would partner with the Transit Authority to outfit a $200 million dollar wireless network in subway stations. According to Transit Wireless (2010), 277 stations will support wireless capacity by 2016. Commuters will be able to use their smartphones and other internet-dependent wireless devices underground to talk, e-mail and text on the subway platform, and it is predicted that wireless signal will reach into subway cars.
The majority of our survey respondents thought that the presence of wireless service would change their behaviour; our observational data supports this. We observed that when wireless service was available on above ground trains, reading of books or e-readers and listening to music went down while the use of mobile devices for calling, reading and texting went up. In order to understand better the effect of wireless service on information behaviour of subway commuters we would recommend studying transportation systems where wireless is already available, such as Boston or Chicago.
A large number of Americans use public transportation, yet there are very few studies on how commuters use their travel time. Our study explored information behaviour of New York subway commuters in order to understand what they do on the train and what information devices they choose to use. Explorative in nature, our study has identified avenues for future studies of human information behaviour, changes to city commuting, technology adoption and use by urban population, and market research.
Our study allowed us to classify commuters' activities as either active or passive, and to explore some of the factors influencing these activities, including information device ownership, commuters' demographics, time of commute, commute length and environmental conditions. We found that certain types of activities, such as music listening, calling, and reading print or electronic media, varied between subway lines. Further investigation is needed into possible differences between the different subway lines, including demographics of their riders and communities they connect and availability of wireless access. We found that frequencies of some activities (e.g., newspaper reading) varied throughout the day, while frequencies of other activities (e.g., mobile phone use) did not. This finding suggests existence of time-specific information tasks and habits (e.g., reading the news in the morning), and time-neutral tasks and habits (e.g., texting); more work is needed to confirm this hypothesis. We explored the link between type of activity and demographic variables and found some correlation (e.g., music listening was associated with the younger commuters). Future studies might investigate whether correlation between information activities and commuters' demographics are unique to the subway environment or they represent the trends of technology use in a general population. We also discovered that certain activities were influenced by the availability of wireless service (e.g., mobile calls increased in the above ground trains), length of commute (longer commute times were associated with higher likelihoods of resting or sleeping on a train), and crowding.
Analysis of the information activities on the New York City subway revealed the popularity of reading and, specifically, book reading among riders. Considering the availability of various reading media, books remain an attractive option. Future studies might investigate the reasons for the popularity of books, including their relatively low cost, independence from wireless connection and power sources, easy availability, or entertainment value. Another popular information device was the smartphone. We found commuters using this device for reading, writing, listening to music, playing computer games, calling, and other activities. This finding is not surprising considering portability and multi-functionality of the smartphones. With the future introduction of wireless service on the MTA lines, we anticipate that the use of smartphones will increase.
Along with reading, one of the most popular activities during the commute was listening to music. Research into reasons behind the popularity of this passive activity (e.g., for relaxation, establishment of personal spaces) may merit further investigation. Another possibly fruitful avenue for future studies is an investigation of the passive commuters: the majority of commuters who prefer not to use any information devices and do not engage in any obvious activities (one might argue that a passive traveller might be busy thinking, resting, actively observing people, or engaging in other non-observable cognitive activities). It is possible that no matter what information devices are available to travellers, there will also be a category of commuters who prefer not to use them. Future research should consider soliciting commuters' opinions on travel experiences and activity preferences.
As information technology and services continue to evolve, so will the commuters' behaviour: introduction of wireless service will probably increase the number of calls and text messages from mobile phones and decrease book reading on a subway; improvements in electronic devices and the decrease in price of e-readers and tablets will increase their ownership and usage, etc. Based on our findings and their relationships to prior studies, we also hypothesize that regardless of the technological landscape, information activities of future travellers will fit into the underlying fundamental structure of the reviewed models: some commuters will prefer to use their time productively, while others will prefer to entertain themselves, or rest. The classification of commuters' activities can be used in a number of ways. It may inform the design of the in-train information services; for example, current trains already have commercial and educational posters (Metropolital Transit Authority... 2011) and information screens (PATHVision 2011) that cater to the passive activity travellers. Public libraries and other information institutions might explore the on-site landing services, both for physical content as well as digital (e.g., although some of the subway platforms have commercial newsstands, there is no public library presence). Certain smartphone applications (similar to the ones discussed in the Relevant Literature section) might be designed for the large number of underground smartphone users.
While our study left a lot of unanswered questions, we hope that we have laid the groundwork for the future studies of commuter's information behaviour.
We would like to thank Rita Clavin, who inspired this study by identifying the gap of research on commuters' information behaviour. We also thank all participants who volunteered their time for this study. We appreciate the work of anonymous reviewers and a copy-editor who helped to improve this publication.
Irene Lopatovska is an Assistant Professor at the School of Library and Information Science at the Pratt Institute in New York. Alexandra S. Basen, Anshuman M. Duneja, Helen Kwong, Denise L. Pasquinelli, Sarah Sopab, Brian J. Stokes, Christopher Weller are graduate students at the same school.
| Find other papers on this subject | ||
Print media observed:
Electronic devices and activities observed (Smartphones were grouped with dedicated devices based on their observed use)
| Observation Times* | N | % |
|---|---|---|
| 06:30 - 09:00 AM Rush Hour | 7 | 5.7 |
| 09:01 - 16:29 Midday | 42 | 34.4 |
| 16:30 - 19:00 PM Rush Hour | 14 | 11.5 |
| 19:31 - 06:29 Overnight | 33 | 27.0 |
| Saturday and Sunday = Weekend | 26 | 21.3 |
| Total: | 122 | 100.0 |
| Handheld device usage | Body language clues |
|---|---|
| Reading or typing | Subject is holding any cellular phone, while fingers or thumbs are tapping screen or keyboard in a “typing rhythm” with occasional finger swipes or long pauses. |
| Listening to music | Subject is wearing headphones or earbuds without looking at device for more than a few seconds or no device is visible. |
| Telephone call | Device is held to ear or subject is speaking into earbuds or Bluetooth headset with occasional pauses. |
| Playing a game | Subject's fingers are touching screen or/keyboard while making swiping or other gestures rapidly or rhythmically. Subject has eyes focused on device screen. |
| Activity type | Activity (frequency) | Total Frequency |
|---|---|---|
| Entertainment | ||
| Listening to music (10) | ||
| Gaming (4) | ||
| Watching videos (2) | ||
| 16 | ||
| Text-related | ||
| Reading books (6) | ||
| Make lists (2) | ||
| Reading News (2) | ||
| Reading PDF/documents (2) | ||
| Take notes (2) | ||
| Read Magazine (1) | ||
| Read Newspaper (1) | ||
| Reference (1) | ||
| Writing (1) | ||
| 18 | ||
| Mobile device-related | ||
| Texting (4) | ||
| Making calls (2) | ||
| Mobile application (2) | ||
| Facebook (1) | ||
| Searching on device (1) | ||
| Twitter (1) | ||
| 11 | ||
| Work-related | ||
| e-mailing (4) | 4 | |
| Scheduling / calendar (1) | 1 | |
| Work-related tasks (2) | 2 | |
| 7 |
Q1: How often do you use public transportation per week?
Answer options:
1-10 times
11 or more times
Q2: How much time do you spend on public transportation per day?
Answer options:
Less than 30 minutes
Up to 1 hour
Up to 2 hours
Three hours or more
Q3: What are you doing while commuting on a subway train? Please check all that apply.
Answer options:
Make phone call
Text
Check and respond to e-mail
Listen to music
Play games
Watch video
Read printed material
Read on a mobile phone, eReader or other portable device
Rest
Sleep
Observe people
Q4: What information devices are you using during your commute? Please check all that apply.
Answer options:
Book
eReader
Music device
Smart phone
Laptop
Newspaper
Journal or magazine
Printouts (school or work reading)
Gaming device
iPad or other tablet
Q5: How much do these factors influence what you do on a train?
Answer options: Heavily, Somewhat, Not at all
Crowding
Lighting
Length of commute
Underground/above ground
Time of day
Other (please specify)
Q6: Would the addition of wireless or cell phone service in underground subway trains and stations change your preferences for information devices and the way you engage with them?
Answer options: Yes, No
Q7: What is your age?
Answer options:
18-24
25-34
35-44
45-54
55+
Q8: What is your total household income?
Answer options:
$20,000-$29,999
$30,000-$39,999
$40,000-$49,999
$50,000-$59,999
$60,000-$69,999
$70,000-$79,999
$80,000-$89,999
$90,000-$99,999
$100,000-$149,999
$150,000+
Q9: Where do you live?
Answer options:
Brooklyn
Bronx
Manhattan
Queens
Staten Island
Long Island
Connecticut
New Jersey
New York State (excluding New York City/Long Island)
Q10: What is the highest level of education you have completed?
Answer options:
High school diploma/GED
Some college
Bachelors Degree
Some graduate school
Graduate degree
Professional Degree
| Question/Answer option | Number (n) | Percentage (%) |
|---|---|---|
| Age | ||
| 18-24 | 86 | 18.9% |
| 25-34 | 274 | 60.1% |
| 35-44 | 64 | 14.0% |
| 45-54 | 22 | |
| 55+ | 10 | 2.2% |
| Total household income | ||
| $20,000-$29,999 | 86 | 19.4% |
| $30,000-$39,999 | 53 | 11.9% |
| $40,000-$49,999 | 52 | 11.7% |
| $50,000-$59,999 | 29 | 6.5% |
| $60,000-$69,999 | 32 | 7.2% |
| $70,000-$79,999 | 27 | 6.1% |
| $80,000-$89,999 | 25 | 5.6% |
| $90,000-$99,999 | 23 | 5.2% |
| $100,000-$149,999 | 55 | 12.4% |
| $150,000+ | 62 | 14.0% |
| Residence | ||
| Brooklyn | 190 | 41.7% |
| Bronx | 9 | 2.0% |
| Manhattan | 117 | 25.7% |
| Queens | 46 | 10.1% |
| Staten Island | 3 | 0.7% |
| Long Island | 12 | 2.6% |
| Connecticut | 6 | 1.3% |
| New Jersey | 64 | 14.0% |
| New York State (excluding NYC/Long Island) | 9 | 2.0% |
| Highest level of education | ||
| High school diploma/GED | 3 | 0.7% |
| Some college | 17 | 3.7% |
| Bachelors Degree | 162 | 35.4% |
| Some graduate school | 135 | 29.5% |
| Graduate degree | 128 | 28.0% |
| Professional Degree | 12 | 2.6% |
Observations were made on lines that run from the Bronx to Brooklyn and from Queens to Brooklyn, all of which pass through Manhattan and include both the midtown and downtown districts. Residents of Staten Island who take the Staten Island Ferry to Manhattan are close to the 6 and 1 trains, which are included in our observations. Commuters from New Jersey come in via the PATH trains, which terminate near the N/R/Q trains and the B/D/F trains, which were also observed. Buses to Port Authority are closest the A/C/E trains and connect via tunnel to the Times Square station. New Jersey Transit and Amtrak trains terminate at Penn Station near the 1/2/3 trains. Metro-North trains terminate at Grand Central Terminal, which is on the 4/5/6 and 7 lines.
© the authors, 2011. Last updated: 23 November, 2011 |
|
