Public library Websites as electronic branches: a multi-country quantitative evaluation
Diane L. Velasquez and Nina Evans.
Introduction. This paper describes the findings of a study of 1517 public library Websites in Australia, Canada, and the United States over a period of four years. These Websites are referred to as ‘electronic branches' of the libraries, thereby extending the definition of physical library branches into the digital realm. The purpose of the research was to investigate the accessibility of public library Websites, the available online resources and whether library staff are available to respond to users' questions and concerns regarding the Website.
Method. A quantitative study was conducted, using a spreadsheet protocol to determine if 18 criteria were present on the Websites. General comments about the Websites were also recorded and included in the analysis.
Analysis. The quantitative data analysis for the 1517 Websites was done using Excel spreadsheets through formula manipulations. Descriptive statistics are used to report the findings.
Results. The data revealed that the Websites of Canadian and USA libraries include more of the criteria than the Australian libraries. Overall many similarities were found between the accessibility of the Websites of the different countries.
Conclusion. The study provides exemplars of an electronic branch of a public library and the services it can offer to its community members. These examples can be used to model ideal electronic branch libraries for library staff to improve their Websites.
Introduction
Public library Websites are often the first, if not the main, point of contact that people have with their local library. In the future, public library patrons may not go into the bricks and mortar building but just access the Website for the services, materials, and programmes that are needed. Members access a public library Website for a variety of reasons, including locating resources, reserving resources, managing library accounts, bill payments, downloading e-books and audio books, and accessing online databases available free through their library. A library Website can be regarded as an electronic branch of the library. An electronic branch is the Website of the library versus the bricks and mortar version of the library where patrons physically enter the library.
A physical library branch will not be used if it cannot be accessed, if patrons do not know where or how to ask for help, if the information and resources are out of date, and if the building and furniture are dilapidated and unappealing. The same can be said of the electronic branch. An inviting, easily accessible and vibrant Website is an essential part of a successful electronic branch. Library electronic branches also need to be developed, managed and maintained just like any other library branch. In short, the electronic branch needs to be easy to access and use.
Public library Websites provide information that includes catalogues, databases, events, marketing, staff information, programming, and services. In this study, 1,517 public library Websites were assessed and evaluated in a study over four years. The intent of the project was to find out what basic and desirable information was available on the Websites and to make recommendations about how Websites can be improved. The study extends previous research carried out in Pennsylvania (Powers, 2011), from which a checklist of criteria for evaluating Websites was developed. Powers conducted the research in 2010 and used a random sample of 305 points of contact (URLs) of libraries in Pennsylvania. She used ‘yes' and ‘no' responses to code the answers. According to Powers, a basic library Website contains ten of the criteria, while a desirable Website would include eight additional criteria. For this study, these were the criteria used and it was based upon two papers: an article by Persichini, Samuelson, and Zeiter (2008) which set out the ten basic features and another by Mathews (2009), which set out eight desirable criteria. The criteria are described in the Research methods section. This particular checklist was used as it was something that could easily be explained and used for student researchers. While the checklist had aspects that were unique to the USA, these could be changed and adapted for whichever location one chose to use.
The study presented here differs from the Powers study in three ways: first, a number of researchers evaluated and assessed the 1,517 Websites, instead of a single researcher; secondly, our study was conducted in three countries, whereas the Powers study was done in one USA state only; finally, our study was over a four-year time-frame, while Powers completed her study over a six-month period. We used most of Powers's criteria except that we added ‘joint-use facilities' and deleted ‘Library board information' and ‘Description of particular library services'.Literature review
Evaluation and assessment of Websites
Evaluation of library Websites began as early as 1994, when the Internet and World Wide Web were in their infancy. Empirical studies on Websites in other industries are informative regarding the questions to ask and the frameworks needed to move forward with the study of library Websites (Cao, Zhang and Seydel, 2005; Chua and Goh, 2010; Teo, Oh, Liu and Wei, 2003). The majority of literature available on library Websites relates to the academic library sphere. Although these findings can inform the research on public libraries, they have a different focus. Academic libraries focus on curriculum and supporting academic staff and students with their scholarly research, while public libraries support lifelong learning and leisure. Literature describes the criteria for evaluating Websites as follows below.
Usability
A Website's usability and the quality of its content are important aspects of its viability. According to Poll (2007, p. 1), ‘contents, language, structure, design, navigation, and accessibility' of Websites are key areas of focus for libraries. Determining what usability is can be different for each member of the community. Past research based on users' acceptance of a particular system has shown that usability is based upon the way the site functions or works (Goodwin, 1986; Wang and Senecal, 2007).
Usability has been defined as ‘how well and how easily a visitor, without formal training, can interact with an information system of a website' (Benbunan-Fich, 2001, p. 151). According to Nielsen (2012, para. 3) usability is defined as a ‘quality attribute that assesses how easy user interfaces are to use'. Nielsen goes on to argue that usability refers to the methods for improving the ease of use during the design process. He further defines the five quality components of ‘learnability, efficiency, memorability, errors, and satisfaction' (Nielsen, 2012, para. 4). Implementing Nielsen's usability heuristics will improve any Website.
User-centred design
In order to add value for community members, public libraries should stimulate user involvement and allow users to give feedback (Sørum, Andresen and Vatrapu, 2012).
Nielsen proposed simple user-centred design guidelines that he called usability heuristics. Nielsen's suggestions were to ‘make screens simple and natural, speak the users' language, be consistent, provide feedback, use plain language for error messages, prevent errors, and provide clearly marked exits' (Nielsen, 1996, p. 34). None of Nielsen's suggestions are difficult to envisage when considered within a library framework. These suggestions can make a library Website move from a hard to navigate site, to an easy one that users will want to come back to visit. If a Website is difficult to navigate, users will leave and not return (Nielsen, 2012). For a public library, this has to be avoided, as return visitors indicate that the electronic branch of the library is also a valued branch.
One aspect of good user-centred design is finding out what the community wants and expects on the Web page. It is important to remember that the Website exists for the users, not the library staff (Goodman and Schofield, 2015). Library literature underscored the importance of usability testing and having an iterative process during the design phase (Becker and Yannotta, 2013; Dominguez, Hammill and Brillat, 2015). If a library is redesigning their Website, many different methods can be used. Becker and Yannotta (2015) in their project at Hunter College Libraries used an iterative usability testing process to improve their Website. Dominguez et al. (2015) used a think-aloud protocol during usability testing, focus groups, and card sorting during their many phases of Website design from 2001 to 2012. Becker and Yannotta, as well as Dominguez et al., used many of the processes that Nielsen (1996; 2012) suggested to carry out user-centred design, in order to improve the accessibility of the Website.
Accessibility
Riley-Huff (2012) suggests that every library should seriously consider accessibility for all. When putting the Website together, each piece has to be considered from the standpoint of each potential visitor who will be looking at it. Accessibility can be difficult if there are blind, deaf, or people with other disabilities visiting the library site. A simple colour choice can be something that can make a Website unavailable to a colour blind person. Conway (2011) did a Website audit of public libraries in Western Australia during 2010 to find out if they adhered to the W3C Web Content Accessibility Guidelines and discovered that none of the public libraries adhered to those guidelines. These Guidelines (an international standard) make recommendations for Websites that are ‘perceivable, operable, understandable and robust' (World Wide Web Consortium, 2011).
Other studies focused on public libraries
Metrics are needed to measure the success of Websites for public libraries. Public library Websites can be regarded as the electronic front door of the library. The impression they make may be viewed by some patrons as an indicator of the level of digital services of the library. Bérlanger et al. (2006) suggest that owners' goals for the Websites will differ and therefore the success of the site may need to be specific to the information and audience. Public library Websites have multiple purposes. Community members can use the Website to look for the services and programming that is available at the library, they find information about the physical branch such as the address, telephone number, and operating hours; and gain access to available e-services (Chow, Bridges and Commander, 2014; McMenemy, 2012).
A literature review of studies that mainly focus on public libraries identified only a few worldwide. Beside the study by Powers (2011), which is the basis for the methods used here, there is Conway's (2011) audit, mentioned above, and Maatta Smith (2014), like Conway, looked at specific information for users to find on Websites of urban libraries in the USA. She concentrated on information related directly to disabilities and found that ‘this was one of the greatest areas of disparities among libraries' (Maatta Smith, 2014, p. 199). McMenemy's study researched the emergence of digital libraries in Scotland, which found that there was a ‘consistent set of electronic resource… offering high quality information…' (McMenemy, 2012, p. 525). He also found difficulties with using resources, as there was confusion about terminology across different library services. Chow et al. (2014) studied usability design comparing academic and public libraries, as each user group has different needs and functions. They focused primarily on how the pages were laid out, how the navigation worked, and if the Websites adhered to recommended design guidelines. Overall, Chow et al. determined that more than 70% of the libraries they studied had not conducted usability studies.
Research method
This project partially replicates Powers's study in Pennsylvania, where a random sample of public library Websites were evaluated and assessed against the following eighteen criteria in a checklist (Powers, 2011, p. 8-9):
| 1. Library name 2. Library address (physical and mailing) 3. Library phone number 4. Online contact (e-mail address or online contact form) 5. Hours of operation 6. Library board members' names 7. Link to online catalogue 8. Link to state wide collaborative services 9. Description of library services available to patrons 10. Current site content indicated by a date when last updated or last reviewed |
11. Mixture of text and images 12. Library events being promoted on the page 13. Search box present 14. Place to provide feedback about the site 15. Free from spelling or grammatical errors 16. Place to ask for help 17. Image or icon or other graphic used to represent the library 18. Site employs some Web 2.0 technologies like blogs or wikis or reference to a social networking profile. |
The research was conducted by postgraduate students who are pursuing a library and information management degree at the University of South Australia, as part of an information management project course. This course was part of the student's capstone project under supervision of the course coordinator and lecturer. A total of forty-six students participated in the project over four years, in groups of four to six students per semester. This research project was ideal for students who needed to do virtual projects, because of either work or family commitments, instead of being placed at a host industry location. The students were located in different states throughout Australia and some were located internationally. The use of forty-six student researchers helped to eliminate bias in the project that would occur if only one person conducted the study (Raward, 2001). Students were required to write a 1,500 to 2,000 word literature review on any aspect of Website assessment, evaluation, or usability.
To assess and evaluate the Websites, nine groups of students worked over nine semesters (four years) from February 2013 to November 2016 to evaluate 1517 Australian, Canadian, and American public library Websites using a pre-determined protocol adapted from Powers' 2011 research. Each student was assigned a minimum of twenty-five public library Websites. The students were given a template (in Excel) on which they had to capture information for each public library. Powers used ten criteria from a study done in Idaho, which determined the elements that a basic public library Website should have (Persichini, Samuelson, and Zeiter, 2008; Powers, 2011). The remaining eight criteria that are considered desirable for library Websites, were based upon an article by Matthews (2009). Powers (2011) combined the two sets of criteria and used it in a spreadsheet protocol to assess which of the items appear on the sample Websites. Two of the criteria that Powers used were excluded for this study: first, the names of library board members were not included in the protocol, as Australian libraries do not have boards; secondly, the description of library services available to patrons was also removed. Instead, a section was introduced for student researchers to make free form comments regarding each public library Website, including what the student researcher thought of the Website, the navigation of the site, programming, or other general comments. The student researchers were encouraged to enter their opinions about the Websites in Item 20 in Table 1. Another deviation from the Powers study was the inclusion of branch libraries in the data, which was time-consuming. Some of the branches share information with the main branch; others have their own Website presence.
The two sets of criteria (basic or desirable) that were used by Powers are shown in Table 1 below.
Many of the students added their own opinions about what constituted a good or bad Website. The disadvantage of having students do the research is that the lead researcher could not evaluate all 1,517 Websites; the advantage is that it helped to mitigate the bias that could occur when only one researcher does the whole investigation (Raward, 2001). The lead researcher did spot checks of some of the Websites to make sure the findings were consistent with what the students recorded on the spreadsheets and to check the quality of the findings.
| Item no. | Criteria | Response |
|---|---|---|
| Basic criteria | ||
| 1 | Council or library name | Provided |
| URL | Provided | |
| 2 | Is this a joint-use facility | Yes or No |
| 2a | If yes, it is a joint-use facility, which entities are sharing the site? (i.e., public library/school, public library/council, etc.) | Actual answer |
| 3 | Library address (both physical & mailing) | Yes or No; complete address |
| 4 | Telephone | Yes or No; phone number |
| 5 | Online contact | Yes or No; online contact or email |
| 6 | Hours of operation | Yes or No; actual hours |
| 7 | Director/manager | Yes or No; name of library director or manager |
| 8 | Yes or No; email address | |
| 9 | Link to online catalogue | Yes or No |
| 10 | Link to state wide collaborative services (e.g., Trove or state provided databases) | Yes or No |
| 11 | Current site content indicated by a date when last updated or last reviewed | Yes or No; date site last updated |
| Desirable criteria | ||
| 12 | Mixture of text and images | Yes or No |
| 13 | Library events being promoted on the page | Yes or No |
| 14 | Search box present | Yes or No |
| 15 | Place to provide feedback about the site | Yes or No |
| 16 | Free from spelling and grammar errors | Yes or No |
| 17 | Place to ask for help | Yes or No |
| 18 | Image, icon or other graphic used to represent the library (not the council) | Yes or No |
| 19 | Site employs some Web 2.0 technologies like blogs, wikis, or reference to a social networking profile (Facebook, Twitter, Instagram, Pinterest, Historypin, Yammer, etc.) | Yes or No |
| 20 | Comments | Free form comments |
The binary (yes/no) responses to the questions were converted into numerical data (in Excel) in order to do descriptive statistics.
Research question
The main research question guiding the study was: What kind of online access do public libraries provide to their community members?
Findings
Descriptive statistics
The researchers reviewed 1517 public library Websites between February 2013 and November 2016. The data were gathered in Australia (February 2013 to February 2014), followed by Canada (July 2014 to November 2015) and then the USA (July 2015 to November 2016).The state and provincial data for each country will be shown first. Then all data will be collated, discussed and compared. The data were processed using Excel.
Australian data
Table 2 shows all the states and territories in Australia where the public libraries are located. The Australian Capital Territory (ACT) has one library system with multiple branches throughout the territory. In Tasmania, the State Library of Tasmania is responsible for the public library system and all their Websites are part of the state library system. In South Australia, the public libraries adopted the One Card system during the time the research was conducted. The One Card system requires all public libraries in the state to be part of the one library management system with only one public library catalogue for the state. Users need only one public library card to access any public library in the state. Library users can also reserve an item from any library through the online catalogue, after which the item is delivered to their library of choice (Strempel, 2013). The system went live in South Australia in 2012. The 130 South Australian libraries were incrementally converted to the One Card system over a period of three years from 2012 to 2014 (Strempel, 2014).
| State | No. of public library websites | Percentage |
|---|---|---|
| Australian Capital Territory (ACT) | 1 | 0.2 |
| New South Wales (NSW) | 88 | 18.0 |
| Northern Territory (NT) | 17 | 3.5 |
| Queensland (QLD) | 69 | 14.1 |
| South Australia (SA) | 65 | 13.3 |
| Tasmania (TAS) | 44 | 9.0 |
| Victoria (VIC) | 43 | 8.8 |
| Western Australia (WA) | 161 | 33.0 |
| Totals | 488 | 100.0 |
Table 3 shows all the provinces and territories represented in the public library Websites in Canada.
| Province | No. of public library websites | Percentage |
|---|---|---|
| Alberta | 178 | 29.7 |
| British Columbia | 54 | 9.0 |
| Manitoba | 37 | 6.2 |
| New Brunswick | 2 | 0.3 |
| Newfoundland & Labrador | 106 | 17.7 |
| Northwest Territories | 3 | 0.5 |
| Nova Scotia | 5 | 0.8 |
| Nunavut | 12 | 2.0 |
| Ontario | 163 | 27.2 |
| Prince Edward Island | 3 | 0.5 |
| Quebec | 25 | 4.2 |
| Saskatchewan | 7 | 1.2 |
| Yukon Territories | 4 | 0.7 |
| Totals | 599 | 100.0 |
The provinces with the largest number of libraries were Alberta, Ontario, Newfoundland and Labrador. Libraries from Quebec were also included, as one of the student researchers had lived in Quebec and could speak French.
Table 4 shows all four the regions of the USA represented in the public library Websites. The Appendix shows how the states were grouped into regions.
| Region | No. of public library websites | Percentage |
|---|---|---|
| East | 122 | 28.4 |
| Midwest | 119 | 27.7 |
| South | 135 | 31.4 |
| West | 54 | 12.6 |
| Totals | 430 | 100.0 |
Comparison of Australian, Canadian, and American public library Websites
The project was not initially designed as a comparative study. It started as an Australian project, but was expanded because of the success of that project. The project was first expanded to include Canada and then the USA. Such a comprehensive study allows comparison between countries. One cavaet must be mentioned, namely that the study did not include large urban or small rural libraries in the USA, but mostly suburban libraries situated just outside the large metropolitan areas that serve a population between 25,000 and 100,000. In Canada and Australia, libraries of any size and location were included in the study.
Joint-use facilities
Joint-use facilities were notable in the results, with 351 of the 1,517 sites surveyed (23.1%) falling into this category. A joint-use facility is a library building that is shared with another type of library (e.g., school, Technical and Further Education, or university libraries), another type of cultural centre (e.g., gallery or museum), or another type of council or governmental facility (e.g., a community centre or city government council centre). Each country had joint-use Websites, with Canada having the highest number. The top categories for joint-use facility by type were, first schools, then community centres, followed by other types in third place. ‘Other' refers to any type of facility that was not captured in the eight categories listed, such as tourist information centres, family centres, cultural centres (not an art gallery or a museum), post office, welcome centres, women's institute, local history rooms, and gardens. In Australia, joint-use facilities were found in 22% (108) of the public libraries. Within the 108 public libraries, four states noticeably have the majority of the joint-use facilities: New South Wales (26), South Australia (26), Tasmania (21), and Western Australia (26). The other four states or territories with joint-use facilities only had a maximum of four such facilities. The two most common types of joint-use facilities were public schools (30) and ‘other' (32) including family centres, tourist information centres, or a conglomeration of more than one function like a regional gallery, council office, and leisure centre.
As mentioned above, joint-use facilities are also prevalent in Canada. Joint-use facilities were found in 27% (159) of the public libraries that were included in the study. The three most common types of joint-use facilities were public schools (63), community centres (34) and meeting rooms (31) which together represented 80.5% of the joint-use facilities of the library Websites. Within the 159 public libraries, three provinces have the majority of the joint-use facilities, namely Newfoundland and Labrador (63), Ontario (35), and Alberta (33). The other provinces or territories only had minimal numbers of joint-use facilities.
In the USA, joint-use facilities were present in 20% (84) of the public libraries. The two most common types of joint-use facilities were community centres (29) and ‘other' (25). These two categories accounted for 64% of the joint facilities of the libraries in the USA.
Table 5 shows the joint use facilities by type for Australia, Canada and the USA.
| Joint-use facility type | Australia | Canada | USA | Totals |
|---|---|---|---|---|
| Schools (K/R-12) | 30 | 63 | 7 | 100 |
| Technical and further education/community college | 6 | 0 | 0 | 6 |
| Universities | 7 | 2 | 1 | 10 |
| Galleries | 3 | 12 | 3 | 18 |
| Community centres | 17 | 34 | 29 | 80 |
| Meeting rooms | 7 | 31 | 5 | 43 |
| Councils | 1 | 0 | 8 | 9 |
| Museums | 8 | 4 | 6 | 18 |
| Other | 29 | 13 | 25 | 67 |
| Totals | 108 | 159 | 84 | 351 |
Top five and bottom five criteria
The top categories included in the Websites in Australia were the address, phone number, hours of operations, and link to the catalogue. Spelling and grammar used on the Websites were also of a high standard (refer to Table 6). The top categories in Canada were address, phone number, hours of operation, and having text and images on the Website. Similar to Australia, the spelling and grammar on the Websites were of a high standard. Australia and Canada also had the library's street address on the website. Unlike both Canada and Australia, the address was not one of the top five categories found in the USA Websites. Libraries in Australia and the USA had links to their catalogues on the Website. Sites in Canada and the USA included text and images.
| Criterion | Australia n=488 | Canada n=599 | USA n=430 | |||
|---|---|---|---|---|---|---|
| Yes | % | Yes | % | Yes | % | |
| Address | 430 | 88 | 580 | 97 | — | — |
| Telephone | 415 | 85 | 568 | 95 | 404 | 94 |
| Hours of operations | 404 | 83 | 551 | 92 | 404 | 94 |
| Catalogue link | 328 | 67 | — | — | 382 | 89 |
| Spelling and grammar | 400 | 82 | 537 | 90 | 374 | 87 |
| Text and images | — | — | 528 | 88 | 383 | 89 |
The five criteria that were included in the fewest public library Websites for each of the three countries are shown in Table 7:
| Criterion | Australia n=488 | Canada n=599 | USA n=430 | |||
|---|---|---|---|---|---|---|
| Yes | % | Yes | % | Yes | % | |
| Ask for help | 89 | 18 | 274 | 46 | 187 | 43 |
| Director or manager name | 99 | 20 | — | — | — | — |
| Date Website updated | 146 | 30 | 123 | 21 | 126 | 29 |
| Place to give feedback | 132 | 27 | 190 | 32 | 155 | 36 |
| Unique icon for library | 171 | 35 | — | — | — | — |
| Place for online contact | — | — | 315 | 53 | 160 | 37 |
| Search box available | — | — | 331 | 55 | — | — |
| E-mail address 229 53% | — | — | — | — | 229 | 53 |
Three of the bottom five categories were shared by all the countries, namely asking for help, being able to give feedback about the Website, and an indication when the Website was last updated. Australia also had a very few cases where the director's name and the library manager's name appeared on the Website. In Australia, many of the libraries are associated with councils and the councils tend to manage the libraries' marketing, so not many distinct icons or images were present on the libraries' Websites. In Canada and the USA online contact details were not included on many of the Websites. In Canada, the search box was not available in 45% in the libraries. In the USA, there was a lack of an e-mail address in 47% of the libraries.
Basic and desirable data
The research with this particular group of libraries produced some interesting results on the distribution of basic and desriable data. Most of the libraries have basic information about their library on the Website:
| Item | Australia n=488 | Canada n=599 | USA n=430 | Totals n=1517 | ||||
|---|---|---|---|---|---|---|---|---|
| Yes | % | Yes | % | Yes | % | Yes | % | |
| Library name | 488 | 100 | 599 | 100 | 430 | 100 | 1517 | 100 |
| Address | 430 | 88 | 580 | 97 | 361 | 84 | 1371 | 90 |
| Telephone | 415 | 85 | 568 | 95 | 404 | 94 | 1387 | 91 |
| Online contact | 182 | 37 | 315 | 53 | 160 | 37 | 657 | 43 |
| Hours of operations | 404 | 83 | 551 | 92 | 404 | 94 | 1359 | 90 |
| Director or manager name | 99 | 20 | 422 | 71 | 319 | 74 | 840 | 55 |
| E-mail link | 288 | 59 | 444 | 74 | 229 | 53 | 961 | 63 |
| Catalogue link | 328 | 67 | 437 | 73 | 382 | 89 | 1147 | 76 |
| Databases | 289 | 59 | 465 | 78 | 283 | 66 | 1037 | 68 |
| Date Website updated | 146 | 30 | 123 | 21 | 126 | 29 | 395 | 26 |
| Joint-use facility | 108 | 22 | 159 | 27 | 84 | 20 | 351 | 23 |
The desirable information on the Website depended on what library management deemed important for the patrons and varied across the country, state, county, and municipality. The council's information technology department could also suggest what is included and excluded on the Website. This list of the desirable elements is in accordance with that of Powers (2011). Table 9 shows the summarised results of each country's libraries:
| Item | Australia n=488 | Canada n=599 | USA n=430 | Totals n=1517 | ||||
|---|---|---|---|---|---|---|---|---|
| Yes | % | Yes | % | Yes | % | Yes | % | |
| Text and images | 325 | 67 | 529 | 88 | 383 | 89 | 1237 | 82 |
| Events promoted | 324 | 66 | 469 | 78 | 360 | 84 | 1153 | 76 |
| Search box | 200 | 41 | 331 | 55 | 270 | 63 | 801 | 53 |
| Feedback form | 132 | 27 | 190 | 32 | 155 | 36 | 477 | 31 |
| Correct spelling and grammar | 400 | 82 | 537 | 90 | 374 | 87 | 1311 | 86 |
| Ask for help | 89 | 18 | 274 | 46 | 187 | 43 | 550 | 36 |
| Icon or image different from council | 171 | 35 | 358 | 60 | 325 | 76 | 854 | 56 |
| Web 2.0 | 219 | 45 | 420 | 70 | 357 | 83 | 996 | 66 |
Number of items included
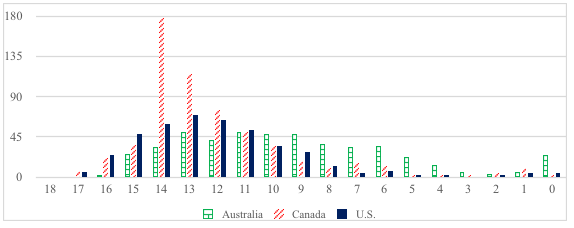
The study identified the number of items that were included on the Websites of the libraries in the three countries. Figure 1 below shows the USA data (solid bar) as a normal distribution (bell curve) that peaks at 13 items. Of the Canadian Websites, 293 out of 599 (49%) contained 13 or 14 items. The USA and Australian numbers were not as high as that of Canada. Australia's data follows a wavy bell curve that peaks at 51 libraries containing 11 and 13 items, followed by 48 libraries with nine and 10 items. Between 9 and 15 items are included in 300 of the 488 libraries (62%). Canada's numbers were higher; 483 libraries (81%) had between 11 and 17 criteria on their Websites. The USA numbers varied from 11 to 17 items for 325 libraries (77%). This number is a little lower than Canada, but the items are spread more evenly. The number of items for Canadian Websites peaks at 14.
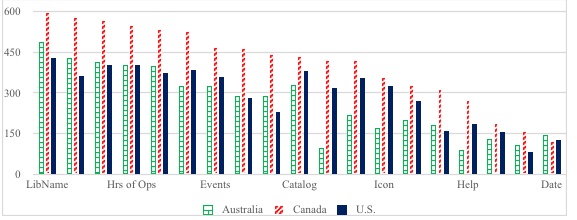
When looking at the data by category (Figure 2), it is obvious that, in some areas, one country's public libraries have more effective Websites. Given that there were more Canadian Websites than either Australian or American in most categories or topics, they have a larger impact on the data.
As public library Websites represent the electronic branch, certain data elements need to be included. In many cases, the majority of the libraries' Websites contained the data we searched for, but some included minimal or no data. Either these libraries did not have the ability to provide the services the community needed, or they did not have access to the required funding. Despite operating in the 21st century, some libraries still have not fully committed to including relevant information on their Website. The researchers discovered that static Websites still exist in all the countries. A static Website is one that does not have any links, search boxes or any way to contact the library through the Website. In a static Website there is no way to search for anything and the Website is simply a placeholder Website that has the name of the library, address, telephone number, and the hours the library is open.
Discussion
In the 21st century, public libraries need well designed Websites to encourage community members to access and use their services. Public library Websites can also be referred to as electronic library branches as opposed to the bricks and mortar branch that can be physically entered. This paper reported the findings from research that focused on the accessibility and usability of public library Websites, regarding the inclusion of numerous criteria or items on the Websites. Although some well-designed Websites exist in all three countries included in this research, none of the libraries included all the criteria on the research template. These libraries can improve their Websites by following good Web design principles, especially user-centred design (Goodman and Schofield, 2015; Nielsen, 1996; 2012).
This research contributes to the understanding of public library managers about how the accessibility of their Websites can be improved, to make them effective points of entry to the programmes and services required by community members. The research questions were answered as follows:
What kind of online access do public libraries provide to their community members?
The library Websites in the three countries provided varying degrees of access, first to the Website and secondly, to the resources. Access to a Website can be provided through the city council's site or a separate library Website and examples of both types were included in the research. Some of the Websites were static and included only basic information like the library name, address, telephone number, operating hours, and other branch locations. On some of the sites the user could link to maps and interactive information to find access to databases, catalogues, lists of books, as well as information tailored for a particular patron type (e.g., children, teens and seniors).
The resources that can be accessed also varied. Some Websites do not provide access to any resources, except to a catalogue link. Others made a plethora of information available, but users needed a library card number to obtain access to the databases. For example, in Australia the Websites provided links to the National Library of Australia's Trove database, as well as State Library resources. In South Australia specifically, the streaming services for e-books and movies is done through the State Library of South Australia. In Canada and the USA, the library databases varied and some also included streaming services for movies and e-books.
Were the users able to contact the public library through the website?
Four criteria directly determined whether the library can be contacted through the public library Website. Firstly, the Website can contain an online contact link where the customer can complete a form requesting library staff to contact them. Secondly, an email link with either a form or an email address for the library's general site can be provided. A feedback form can be included to ask questions about sources, programmes, or just about anything. Finally, there could be an ‘ask for help' link. Many libraries have this as a way to go into chat or instant messaging. Interestingly, three of these four items were not on many of the libraries' Websites.
| Item | Australia n=488 | Canada n=599 | USA n=430 | Totals n=1517 | ||||
|---|---|---|---|---|---|---|---|---|
| N | % | N | % | N | % | N | % | |
| Online contact | 182 | 37 | 315 | 53 | 160 | 37 | 657 | 43 |
| E-mail link | 288 | 59 | 444 | 74 | 229 | 53 | 961 | 63 |
| Feedback form | 132 | 27 | 190 | 32 | 155 | 36 | 477 | 31 |
| Ask for help | 89 | 18 | 274 | 46 | 187 | 43 | 550 | 36 |
Table 10 illustrates that online contact, feedback forms, and ask for help functions are all areas that are not done well by all of the libraries in our research study.
How can users use the Websites to contact the library?
Contacting the library can be done in many ways, e.g., by telephone or e-mail, in person, through the Website, by providing feedback about the Website, and online contact forms. All of these methods, except in person contact, were captured as part of this research. The majority of the libraries show telephone numbers and addresses to facilitate personal visits to the bricks and mortar site, and e-mail addresses are included on the Websites, but not to the same degree as physical addresses and telephone numbers. E-mail addresses were not often included for all three countries (Australia 59%, Canada 74%, and the USA 53%). In fact, e-mail information was in the bottom five categories for the USA.
Contacting the library through providing feedback appeared in the bottom five categories for all three countries. Search boxes were available on the majority of the Websites for the three counties combined (801/1517, 53%), but Canada and the USA (55% and 63% respectively) were better at providing search capability than Australia (41%). Online contact forms were not popular for providing contact on any of the library Websites. Of the Canadian Websites, 53% provided online contact forms, but these figures were lower in the case of Australia (37%) and the USA (37%). Providing feedback on the Websites was available on only a small minority of Websites for all three countries and it seems that the libraries prefer not to receive feedback about the content and quality of their Websites (Australia 27%, Canada 32%, USA 36%).
Study limitations
A limitation of this study was that inexperienced researchers were used in conducting research. However, the research design has been validated in previous studies and the questions were already developed, which simplified replicating the study with inexperienced researchers.
Conclusions and recommendations
Four major observations emerged from the analysis of the data:
1. From the student comments, some of the Websites that were evaluated were high quality Websites that gave users a positive experience and welcomed them back repeatedly. These public library electronic branches used an intuitive approach and user-centred design to provide the patron with the experience they expect when visiting the site.
2. Based upon our knowledge of how public libraries work with councils, public libraries have to adhere to policies and procedures that are designed and implemented by information technology professionals in their city council offices. This often precludes the development of a custom Website, which is not the image that library management want to portray. When discussing this with public library managers during conferences, it was obvious that they were not always able to do exactly what they felt was necessary with their Websites.
3. From the research, it was obvious that Facebook and Twitter were still the most popular social media sites used by the public libraries. The inclusion of other Web 2.0 tools, such as Instagram and Snapchat, would improve the ability of public libraries to reach younger target audiences in order to improve engagement and perceptions about what libraries actually provide communities.
4. Public libraries do not communicate well to their communities and they do not provide sufficient mechanisms to allow their users to respond to the library staff. Websites lacking information such as e-mail addresses, staff names, feedback mechanisms, contact forms, etc. indicate that library staff are not interested in their users' opinions about their Website content and quality.
The research question investigated the access of libraries and resources through the Websites for the users. In all cases, the electronic branch of the public libraries could be found. However, true access includes satisfaction with the type of information the community members need. Some of the public libraries had databases and catalogues on their Websites and others did not. In the digital world that our communities live in today, there is an expectation that our public libraries need to inhabit this world and provide access to digital sources. The programming and other services that public libraries create for their stakeholders is the other aspect the staff provide.
The study has provided rich binary data on more than 1500 public libraries in three countries. This data shows that some of the public libraries provide a better quality Website experience than others. Overall, some of the staff in the exemplar libraries could guide other library staff towards improving their sites and providing better services to their community.
As part of future research, the researchers will revisit the Australian Websites to determine whether there have been any changes to the public library Websites and whether the original research findings are still valid. Websites evolve and change over a four year period. There have also been amalgamations in councils and changes in how the Australian councils are configured in different states. Changes in political structures will also have influences on how libraries are managed and what will and will not be placed on a library Website. It will investigate similar aspects of Websites, but will expand some of the questions to provide additional information. We also suggest that future research should investigate what types of tools and resources are available on the library Websites.
Acknowledgements
The authors would like to thank the following students who assisted with the research while undertaking Information Management studies at the University of South Australia: Andrew Angus, Sarah Barkla, Andree Brett, William Chan, Michelle Chitts, Natalie Clifford, Seam Connelly, Robin Costelloe, Renee Davy, Lungile Dlamini, Daniel Easterbrook, Jenny Gallas, James Gaunt, Cory Greenwood, Fariha Hamid, Deanna Harrison, Jed Hood, Kerrie Impiombato, Catharine Kelly, Thea Kitchen, Isabelle Laskari, Matthew Leach, Annie Lewis, Zoe Manger, Daniel Mason, Cyprian Maynard, Tyler McCaffery, Claire Morris, Patrick O'Leary, Margaret Parker, Lauren Pillar, Jesse Pollard, Tamsin Reed, Brett Ross, Paula Saegenschnitter, Jessica Smith, Jasmine Taylor, Claire Telfer, Malcolm Thompson, Sarah Thompson, Amelia Trimboli, Amy Vanner, Jana Waldmann, Luke Watsford, Jaq Wheadon, and Fiona Wilkinson.
About the authors
Diane L Velasquez is the Program Director of the Information Management Program at the School of Information Technology and Mathematical Sciences, University of South Australia. She holds a BA in political science from San Jose State University, an MBA in Management from Golden Gate University, a MLS from the University of Arizona, and a Ph.D. from the University of Missouri. Her research interests are in risk management and disaster recovery, administrative and management of information agencies, and evaluation and assessment of public library websites. Dr Velasquez can be reached at diane.velasquez@unisa.edu.au.
Nina Evans is Associate Head, School of Information Technology and Mathematical Science (ITMS) at the University of South Australia. She holds tertiary qualifications in Chemical Engineering, Education and Computer Science, a Masters' degree in Information Technology, an MBA and a PhD. Her research interests relate to business-IT fusion, information and knowledge management, enterprise social networks, innovation and ICT education. She can be contacted at nina.evans@unisa.edu.au
References
- Becker, D. A. & Yannotta, L. (2013). Modeling a library website redesign process: developing a user-centered website through usability testing. Information Technology and Libraries, 32(1), 6-22.
- Benbunan-Fich, R. (2001). Using protocol analysis to evaluate the usability of a commercial web site. Information & Management, 39(3), 151-163.
- Bérlanger, F., Fan, W., Schaupp, L. C., Krishen, A., Everhart, J., Poteet, D. & Nakamoto, K. (2006). Web site success metrics: addressing the duality of goals. Communications of the ACM, 49(12), 114-116.
- Cao, M., Zhang, Q. & Seydel, J. (2005). B2C e-commerce web site quality: an empirical examination. Industrial Management & Data Systems, 195(5), 645-661.
- Chow, A. S., Bridges, M. & Commander, P. (2014). The website design and usability of U.S. academic and public libraries: findings from a nationwide study. Reference & User Services Quarterly, 53(3), 253-265.
- Chua, A. Y. K. & Goh, D. H. (2010). A study of web 2.0 applications in library Websites. Library & Information Science Research, 32(3), 203-211.
- Conway, V. (2011). Website accessibility in Western Australia public libraries. Australian Library Journal, 60(2), 103-112.
- Dominguez, G., Hammill, S.J. & Brillat, A. I. (2015). Toward a usable academic library web site: a case study of tried and tested usability practices. Journal of Web Librarianship, 9(2-3), 99-120.
- Goodman, A. L. & Schofield, M. (2015). The user experience. Public Libraries, 54(3), 20-21.
- Goodwin, N. (1986). Functionality and usability. Communications of the ACM, 30(3), 229-233.
- Maatta Smith, S. L. (2014). Web accessibility assessment of urban public library Websites. Public Library Quarterly, 33(3), 187-204.
- McMenemy, D. (2012). Emergent digital services in public libraries: a domain study. New Library World, 113(11/12), 507-527.
- Mathews, B. (2009). Web design matters: ten essentials for any library site. Library Journal, 134(3), 24-25.
- Nielsen, J. (1996). Usability heuristics. Health Management Technology, 17(11), 34.
- Nielsen, J. (2012). Usability 101: introduction to usability. Fremont, CA: Nielsen Norman Group. Retrieved from: http://www.nngroup.com/articles/usability-101-introduction-to-usability/ (Archived by WebCite® at http://www.webcitation.org/6wVi3GDp5.)
- Persichini, G., Samuelson, M. & Zeiter, L. B. (2008). E-branch in a box: how Idaho libraries created an easy and sustainable web presence. PNLA Quarterly, 72(6), 18-19.
- Poll, R. (2007). Evaluating the library website: statistics and quality measures. Paper presented at the World Library and Information Conference: 73rd IFLA General Conference and Council, Durban, South Africa. Retrieved from http://archive.ifla.org/IV/ifla73/papers/074-Poll-en.pdf (Archived by WebCite® at http://www.webcitation.org/6wViIINak.)
- Powers, B. S. (2011). Oh, what a tangled web we weave! An evaluation of Pennsylvania's public library Websites for a basic level of web presence and beyond. Current Studies in Librarianship, 31(1) 21-35.
- Raward, R. (2001). Academic library web site design principles: development of a checklist. Australian Academic and Research Libraries, 32(2), 123-136.
- Riley-Huff, D. A. (2012). Web accessibility and universal design: a primer on standards and best practices for libraries. Library Technology Reports, 48(7), 29-35.
- Sørum, H., Andersen, K. N. & Vatrapu, R. (2012). Public Websites and human-computer interaction: an empirical study of measurement of website quality and user satisfaction. Behaviour & Information Technology, 31(7), 697-706.
- Strempel, G. (2013). South Australian public libraries moving towards a state-wide consortium. InCite, 34(1/2), 30.
- Strempel, G. (2014). Standing on the shoulders of giants: how the New Zealand public libraries inspired the South Australian "One Card" Network. Paper presented at the LIANZA Conference 2014 Pou Whakairo. Retrieved from http://www.lianza.org.nz/geoff-strempel-standing-shoulders-giants-how-new-zealand-public-libraries-inspired-south-australian (Archived by WebCite® at http://www.webcitation.org/6wVibx62e.)
- Teo, H-H., Oh, L-B., Liu, C. & Wei, K-K. (2003). An empirical study of the effects of interactivity on web user attitude. International Journal of Human-Computer Studies, 58(3), 281-305.
- World Wide Web Consortium (W3C). (2011). WCAG 2 at a glance. Cambridge, MA: W3C. Retrieved from https://www.w3.org/WAI/WCAG20/glance/ (Archived by WebCite® at http://www.webcitation.org/6wVipP0bt.)
- Wang, J. & Senecal, S. (2007). Measuring perceived website usability. Journal of Internet Commerce, 6(4), 97-112.
How to cite this paper
Appendix
| Region | State | No. of public library websites | Percentage |
|---|---|---|---|
| East | No state designated | 2 | 0.5 |
| Connecticut | 20 | 4.7 | |
| Delaware | 1 | 0.2 | |
| Maine | 0 | 0.0 | |
| Maryland | 6 | 1.4 | |
| Massachusetts | 19 | 4.4 | |
| New Hampshire | 1 | 0.2 | |
| New Jersey | 18 | 4.2 | |
| New York | 31 | 7.2 | |
| Pennsylvania | 21 | 4.9 | |
| Rhode Island | 3 | 0.7 | |
| Washington DC | 0 | 0.0 | |
| Vermont | 0 | 0.0 | |
| Total East | 122 | 28.4 | |
| Midwest | Illinois | 27 | 6.3 |
| Indiana | 14 | 3.3 | |
| Iowa | 5 | 1.2 | |
| Kansas | 2 | 0.5 | |
| Michigan | 17 | 4.0 | |
| Minnesota | 3 | 0.7 | |
| Missouri | 6 | 1.4 | |
| Nebraska | 6 | 1.4 | |
| North Dakota | 3 | 0.7 | |
| Ohio | 23 | 5.3 | |
| South Dakota | 1 | 0.2 | |
| Wisconsin | 12 | 2.8 | |
| Total Midwest | 119 | 27.7 | |
| South | Alabama | 5 | 1.2 |
| Arkansas | 6 | 1.4 | |
| Florida | 10 | 2.3 | |
| Georgia | 8 | 1.9 | |
| Kentucky | 10 | 2.3 | |
| Louisiana | 16 | 3.7 | |
| Mississippi | 11 | 2.6 | |
| North Carolina | 7 | 1.6 | |
| Oklahoma | 2 | 0.5 | |
| South Carolina | 7 | 1.6 | |
| Tennessee | 10 | 2.3 | |
| Texas | 30 | 7.0 | |
| Virginia | 8 | 1.9 | |
| West Virginia | 6 | 1.4 | |
| Total South | 136 | 31.4 | |
| West | Alaska | 3 | 0.7 |
| Arizona | 5 | 1.2 | |
| California | 20 | 4.7 | |
| Colorado | 4 | 0.9 | |
| Hawaii | 1 | 0.2 | |
| Idaho | 2 | 0.5 | |
| Montana | 1 | 0.2 | |
| Nevada | 3 | 0.7 | |
| New Mexico | 3 | 0.7 | |
| Oregon | 6 | 1.4 | |
| Utah | 1 | 0.2 | |
| Washington | 2 | 0.5 | |
| Wyoming | 3 | 0.7 | |
| Total West | 54 | 12.6 |